Download to read offline

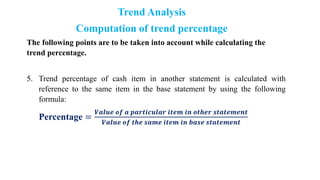
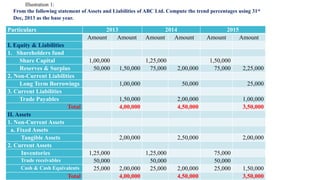
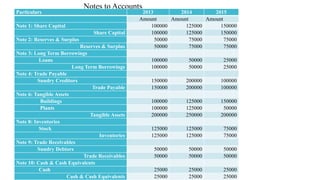
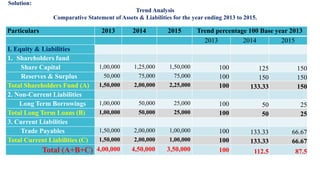
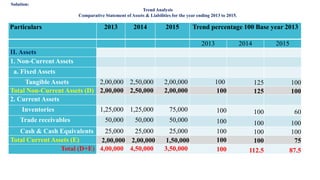
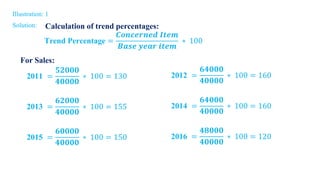
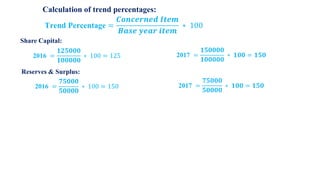


The document discusses trend analysis and provides an example calculation. Trend analysis involves comparing financial data over multiple years to a base year, which is set at 100%. The example shows a comparative statement of assets and liabilities from 2013 to 2015 for a company. It calculates the trend percentages for various line items like share capital, reserves, borrowings, assets, and liabilities by taking the value for each year as a percentage of the base year 2013. This allows analyzing changes and trends over the period.