Downloaded 593 times


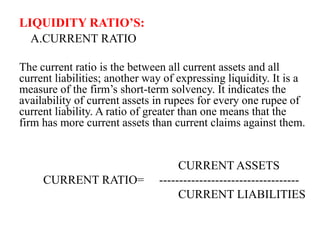


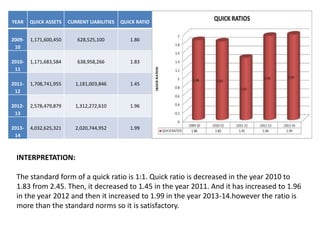
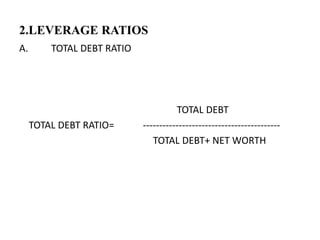
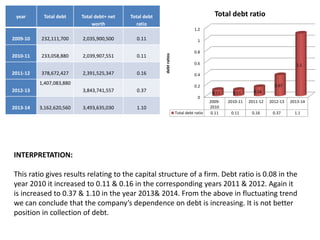


- The document analyzes the ratio analysis of Amara Raja Batteries Limited over 5 years from 2009-2014. - Key ratios like current ratio, quick ratio, total debt ratio, and debt-equity ratio are calculated from the company's annual reports. - Current ratios were above 2:1 standard except in 2011-2012. Debt ratios increased over time, showing a rising dependence on debt financing rather than equity.


