Downloaded 19 times


![Pathway-based methods
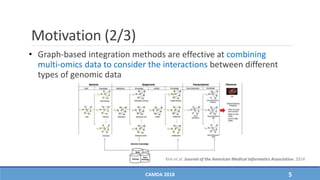
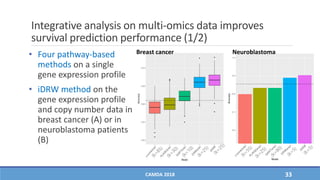
• For gene expression data in each dataset, four pathway-based
methods were compared
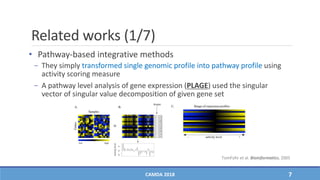
− PLAGE [TomFohr et al. Bioinformatics, 2005]
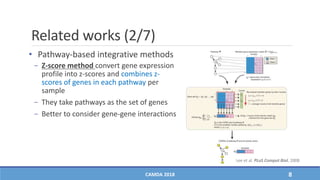
− Z-score [Lee et al. PLoS Comput Biol, 2008]
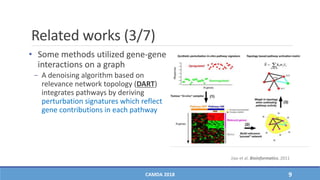
− DART [Jiao et al. Bioinformatics, 2011]
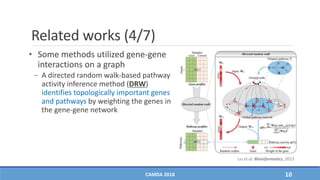
− DRW [Liu et al. Bioinformatics, 2013]
• Evaluate classification performances in the same way as the
proposed method
CAMDA 2018 32](https://image.slidesharecdn.com/camda2018180704-190501145710/85/Robust-Pathway-based-Multi-Omics-Data-Integration-using-Directed-Random-Walk-for-Survival-Prediction-in-Multiple-Cancer-Studies-32-320.jpg)
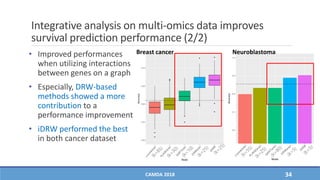


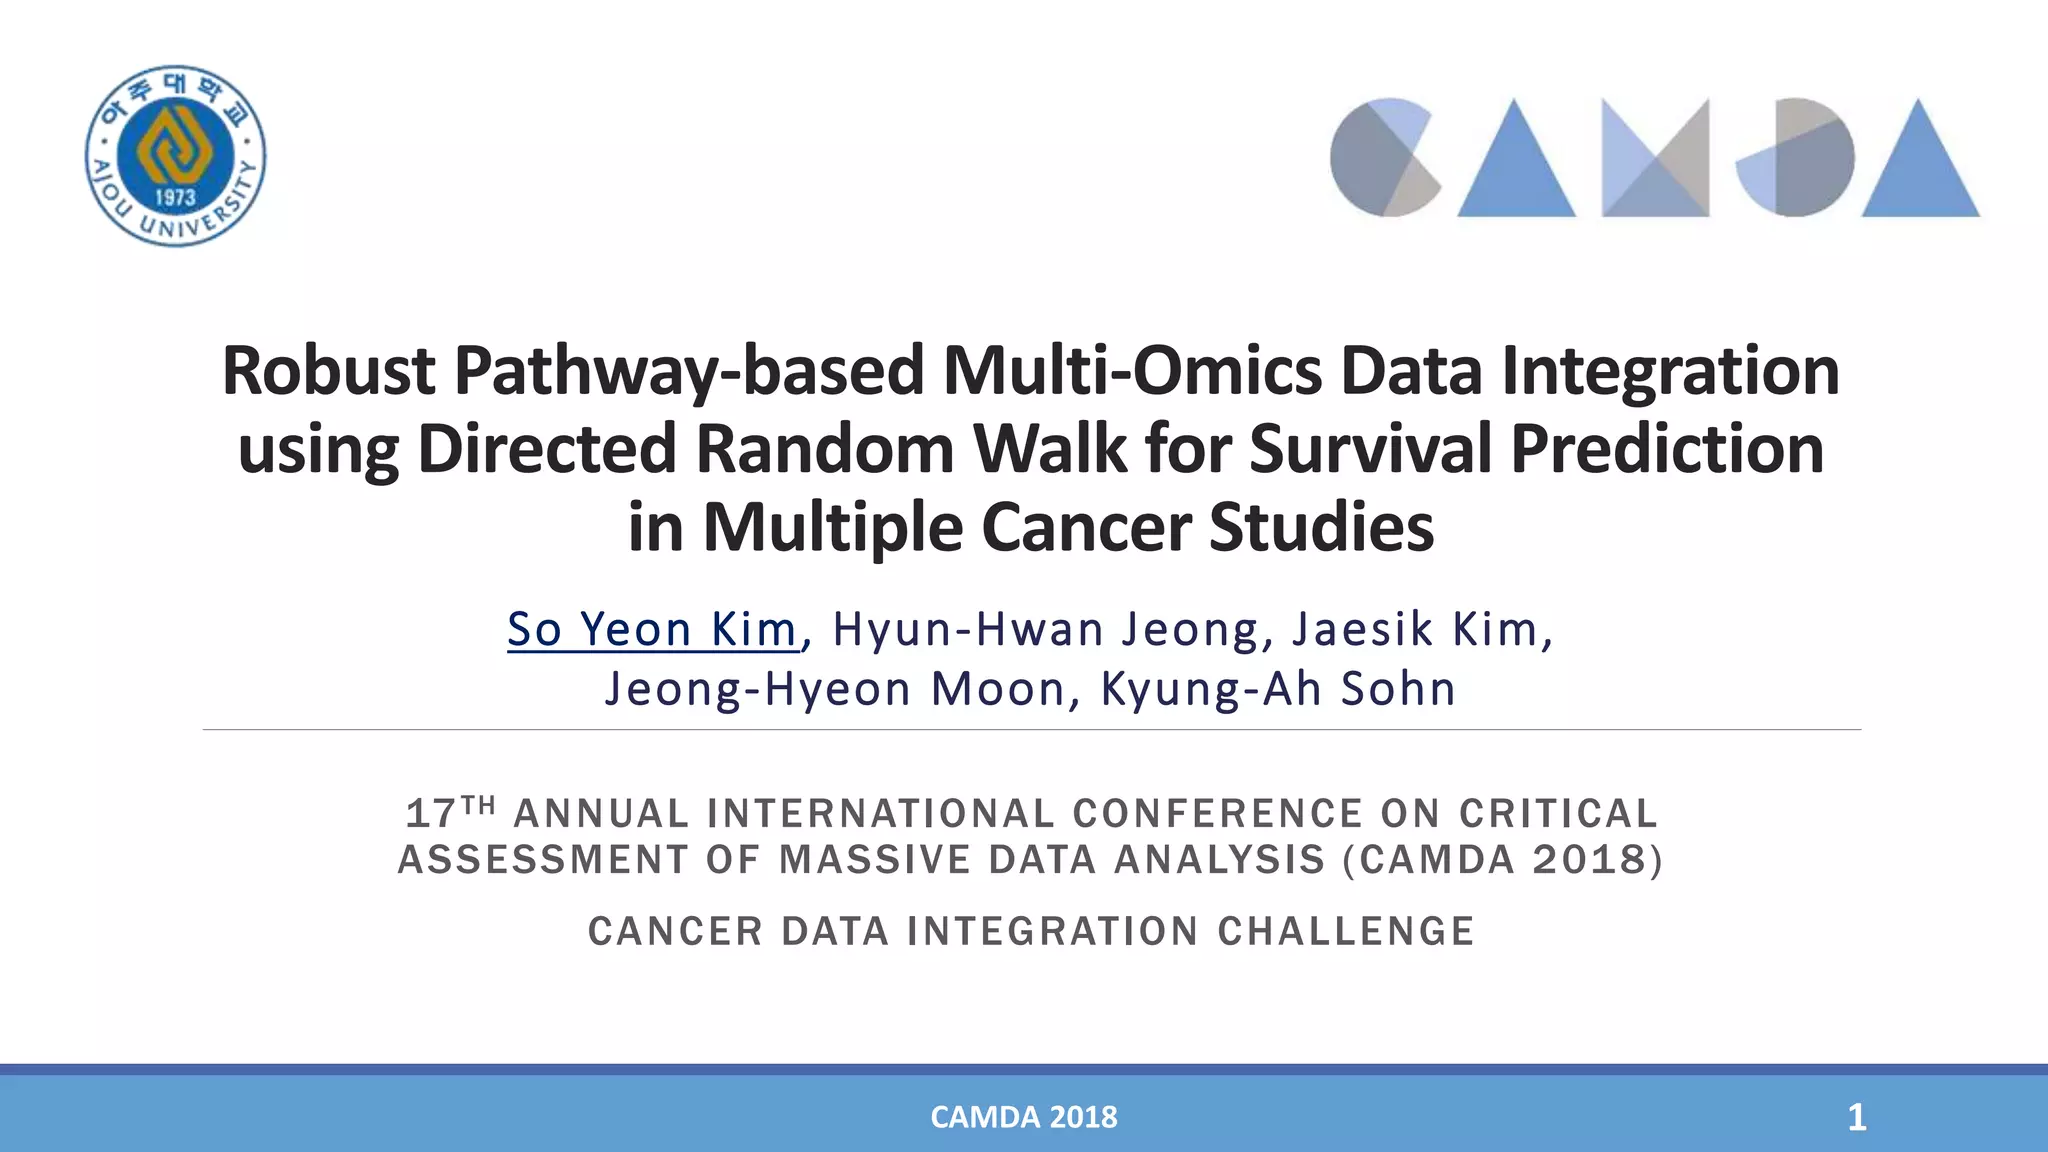
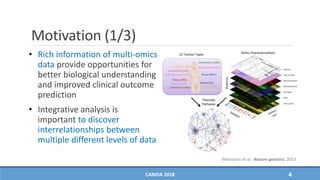
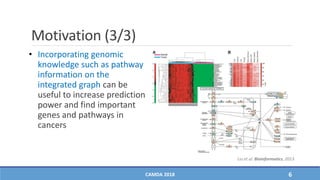
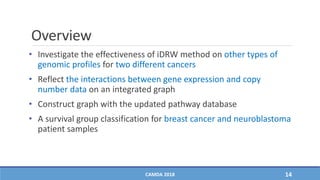
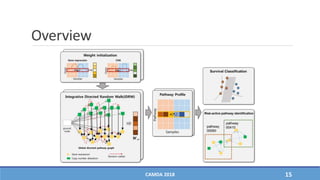
The document presents a study on the effectiveness of an integrative directed random walk-based method (idrw) for survival prediction in breast cancer and neuroblastoma cases using multi-omics data. It emphasizes the importance of pathway information and gene interactions for improving prediction performance and identifies significant cancer-associated pathways and genes. The proposed method shows superior performance compared to traditional pathway-based approaches in survival classification tasks.