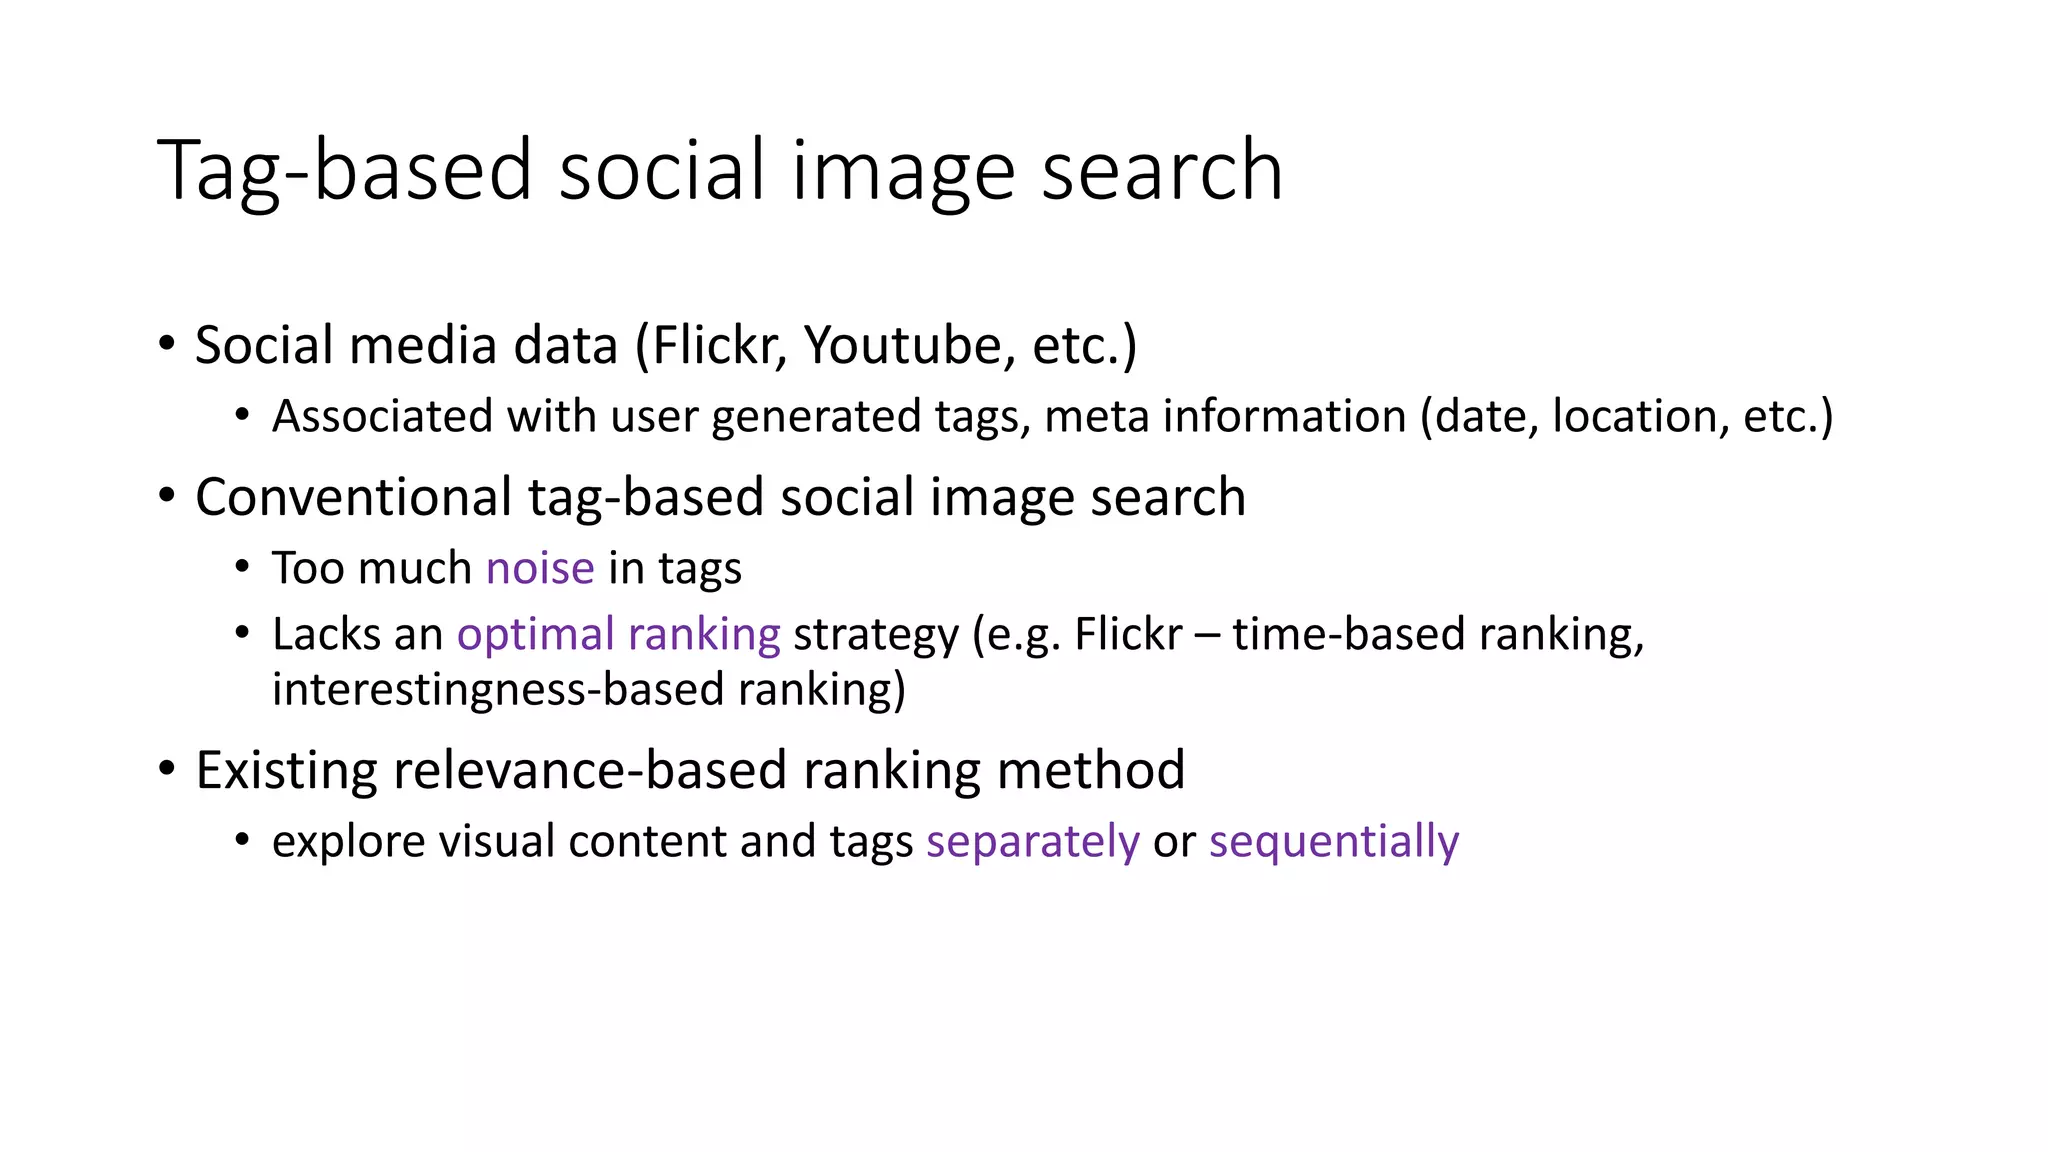
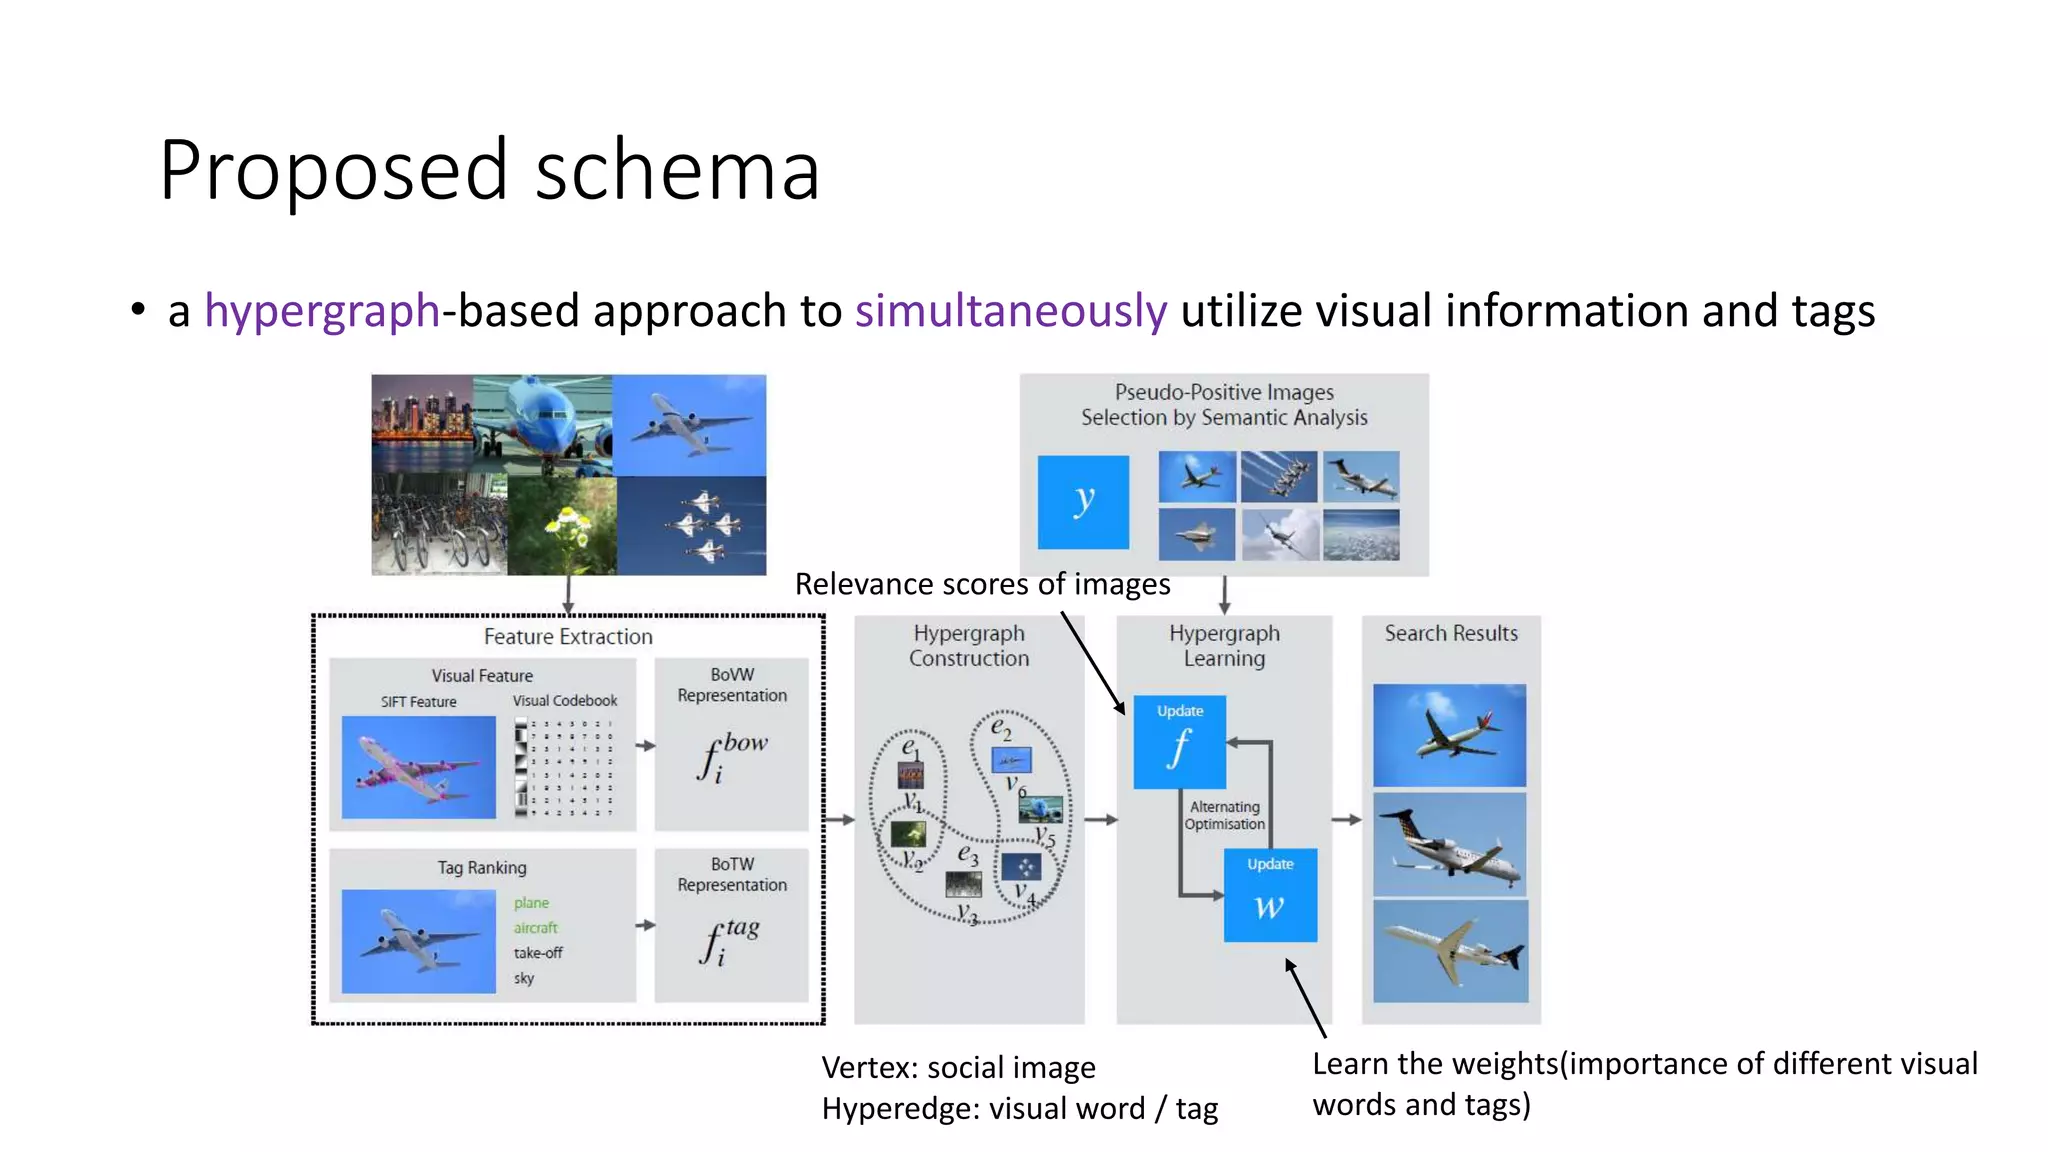
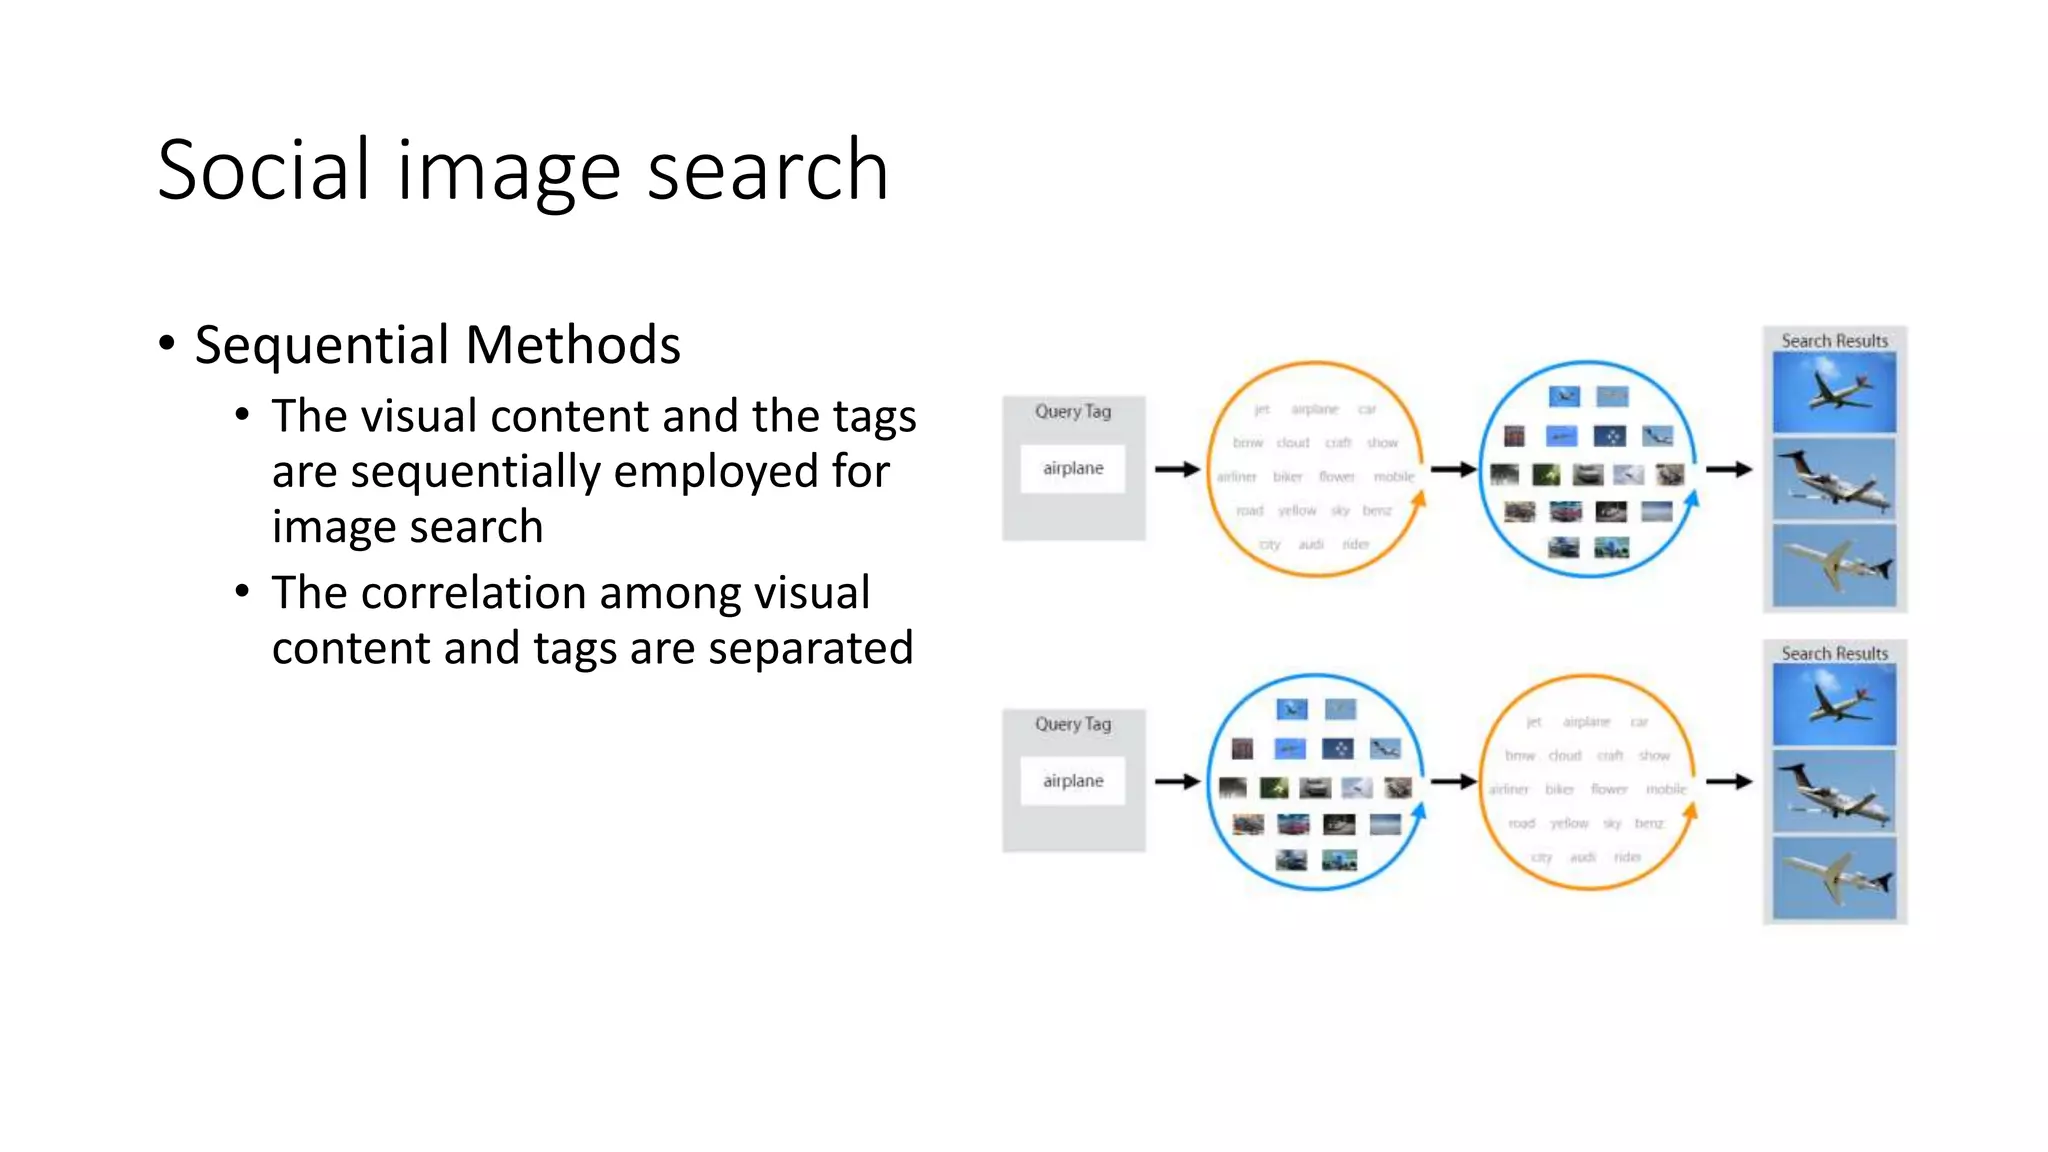
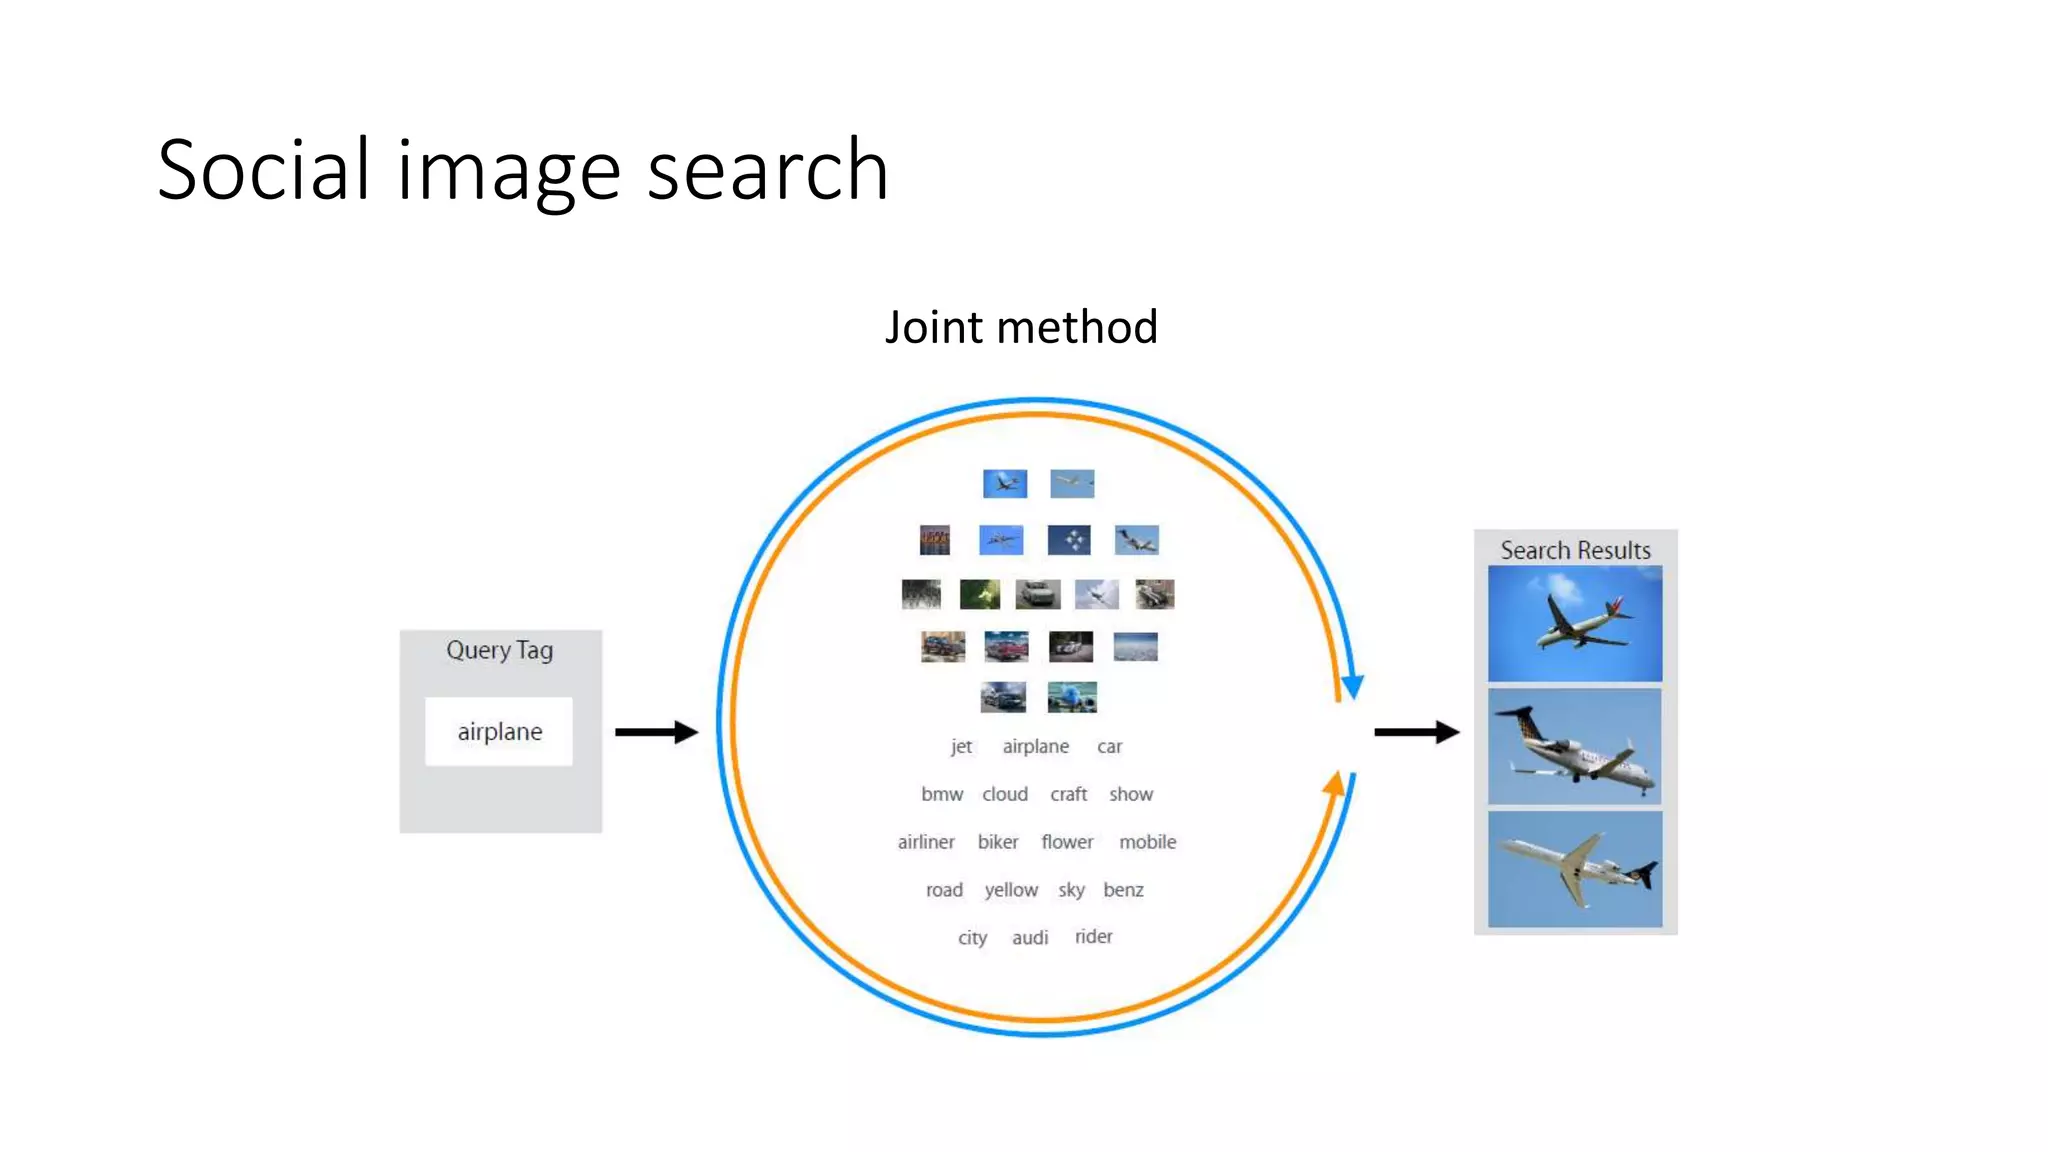
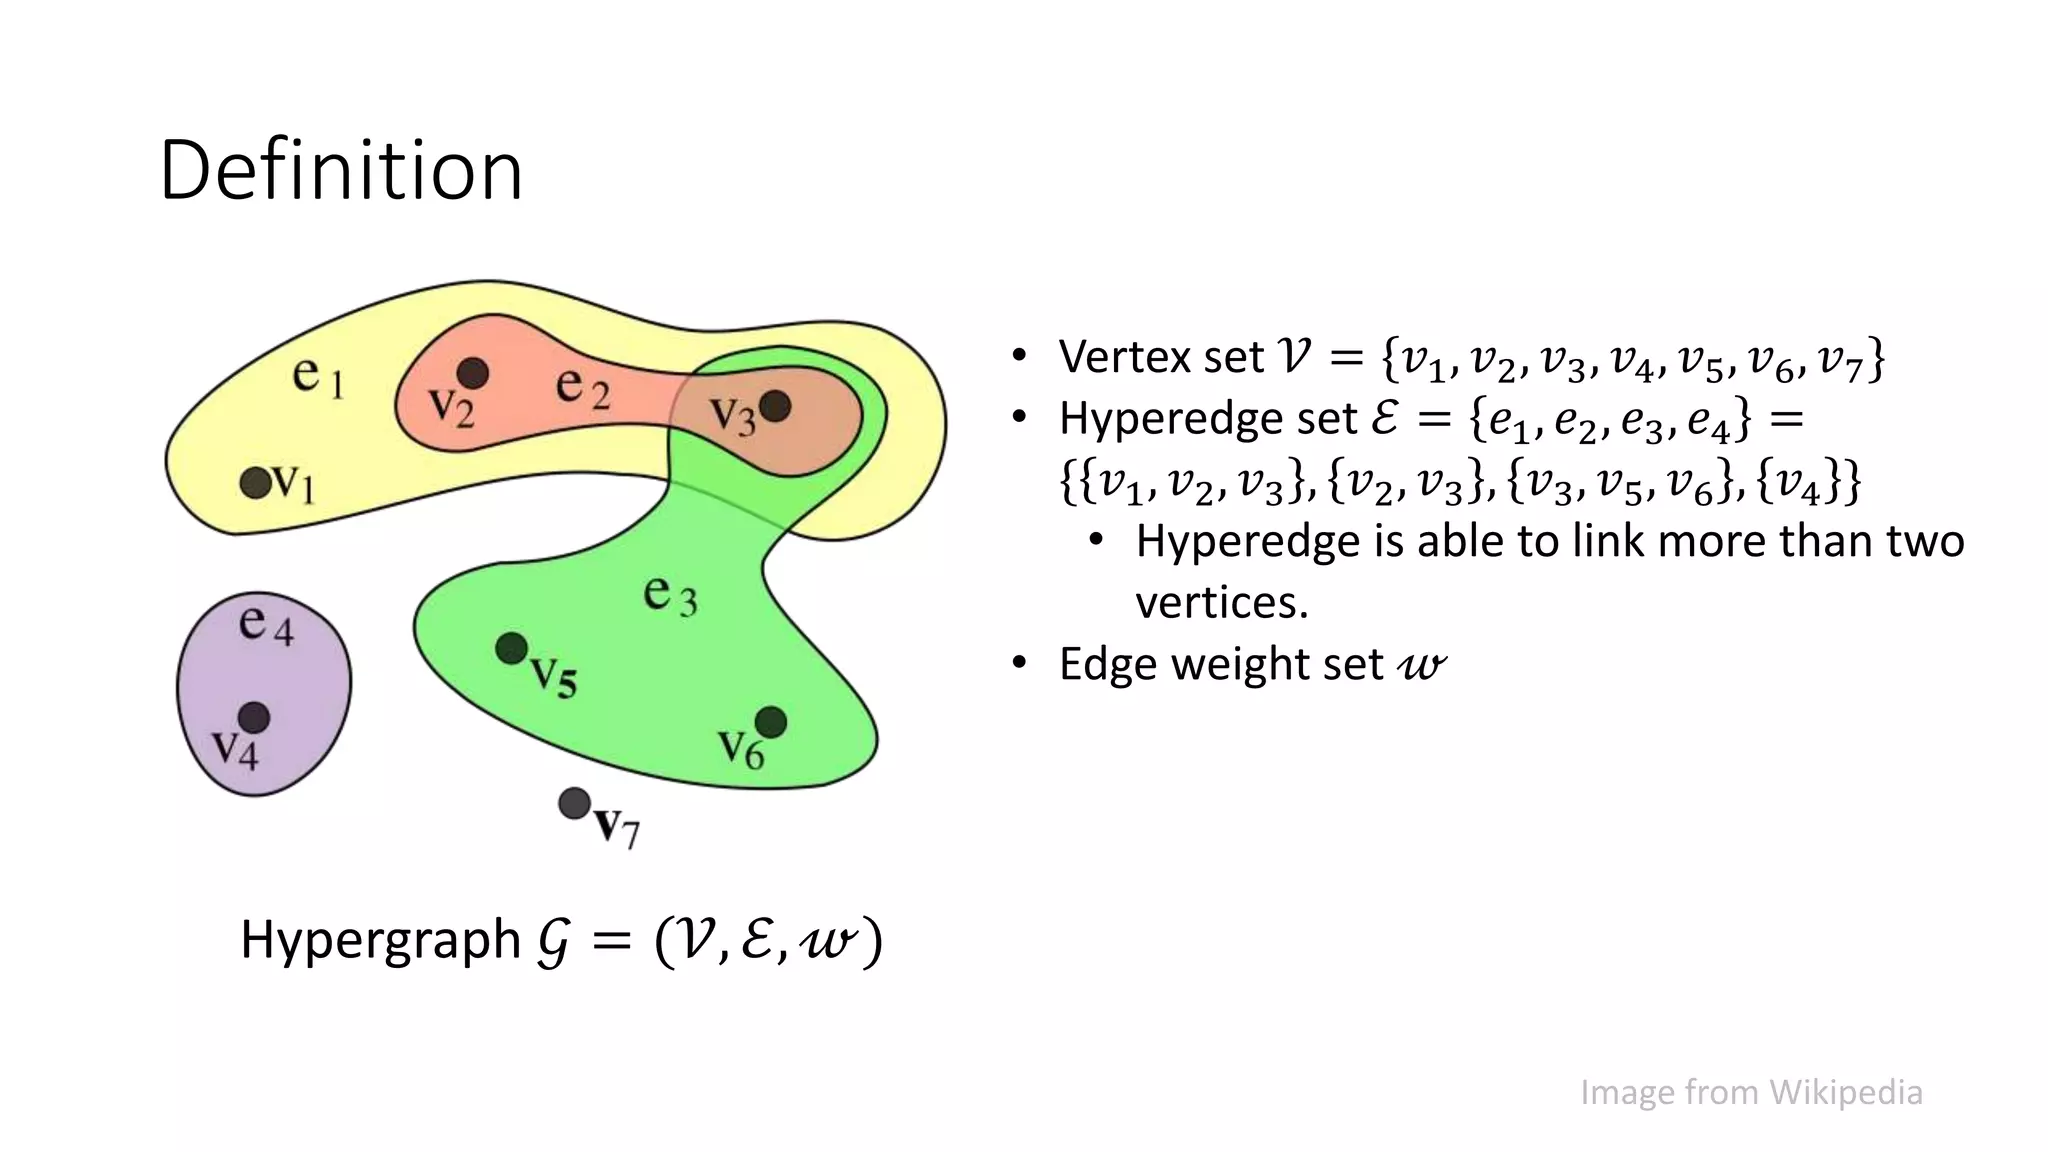
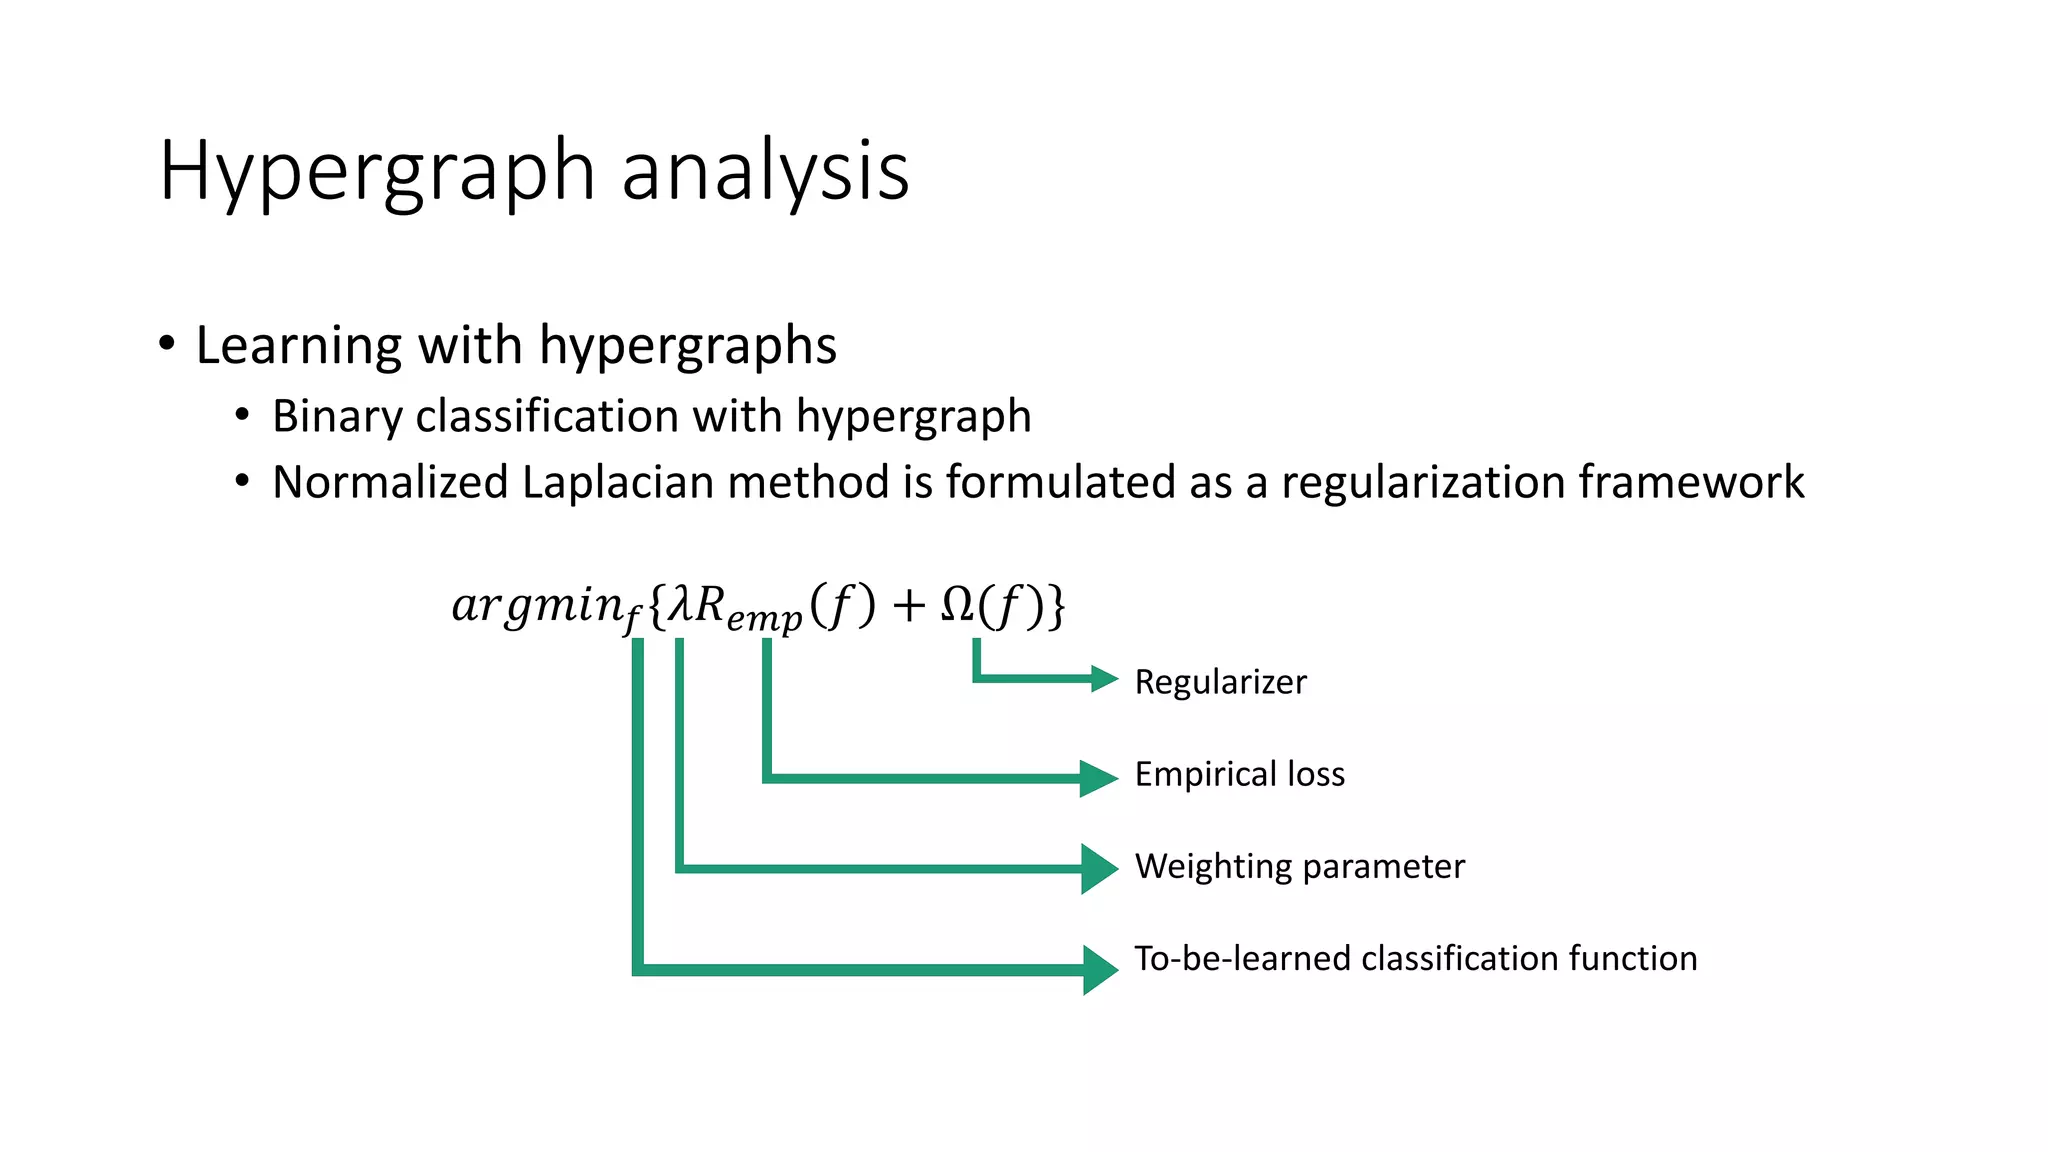
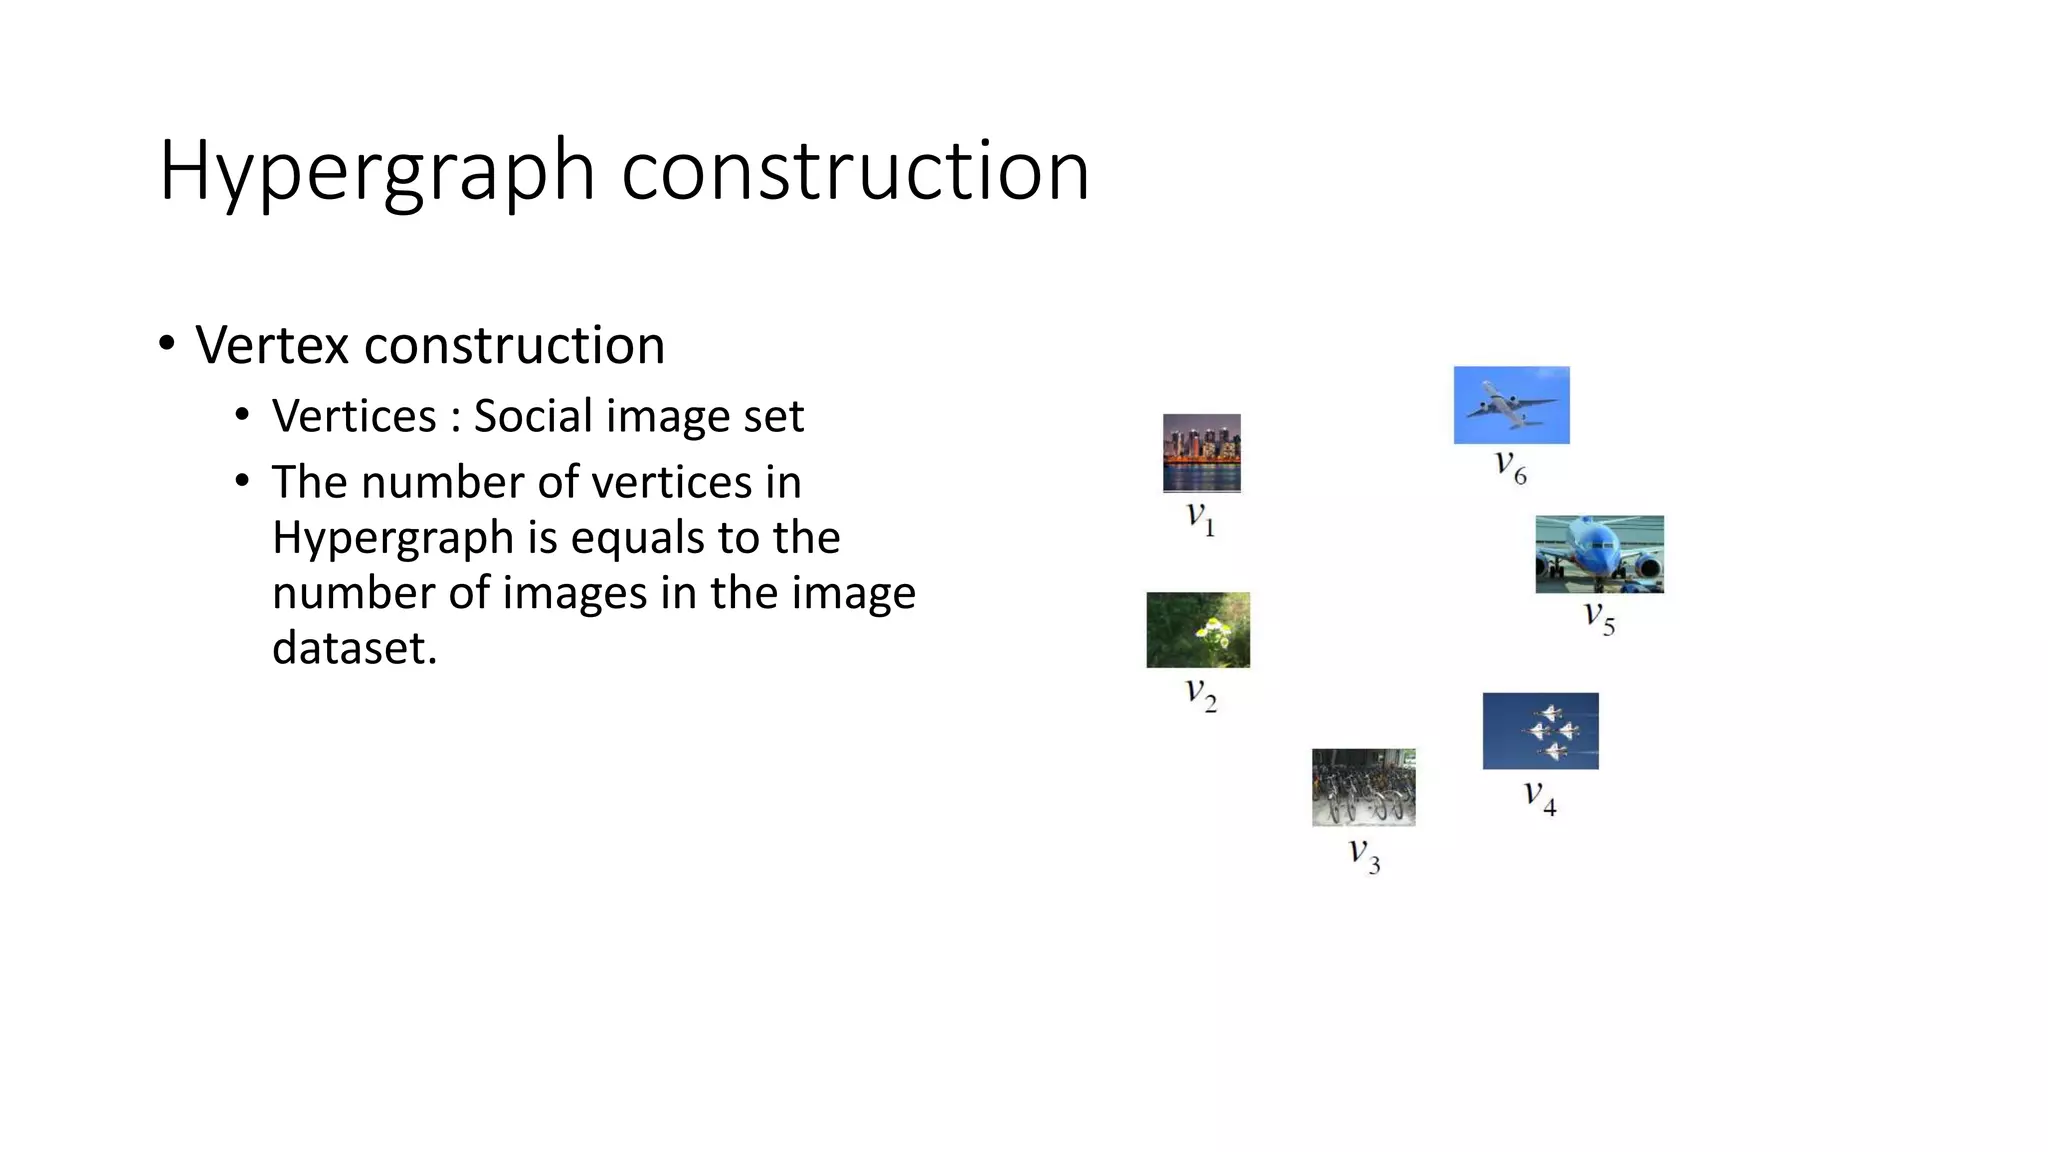
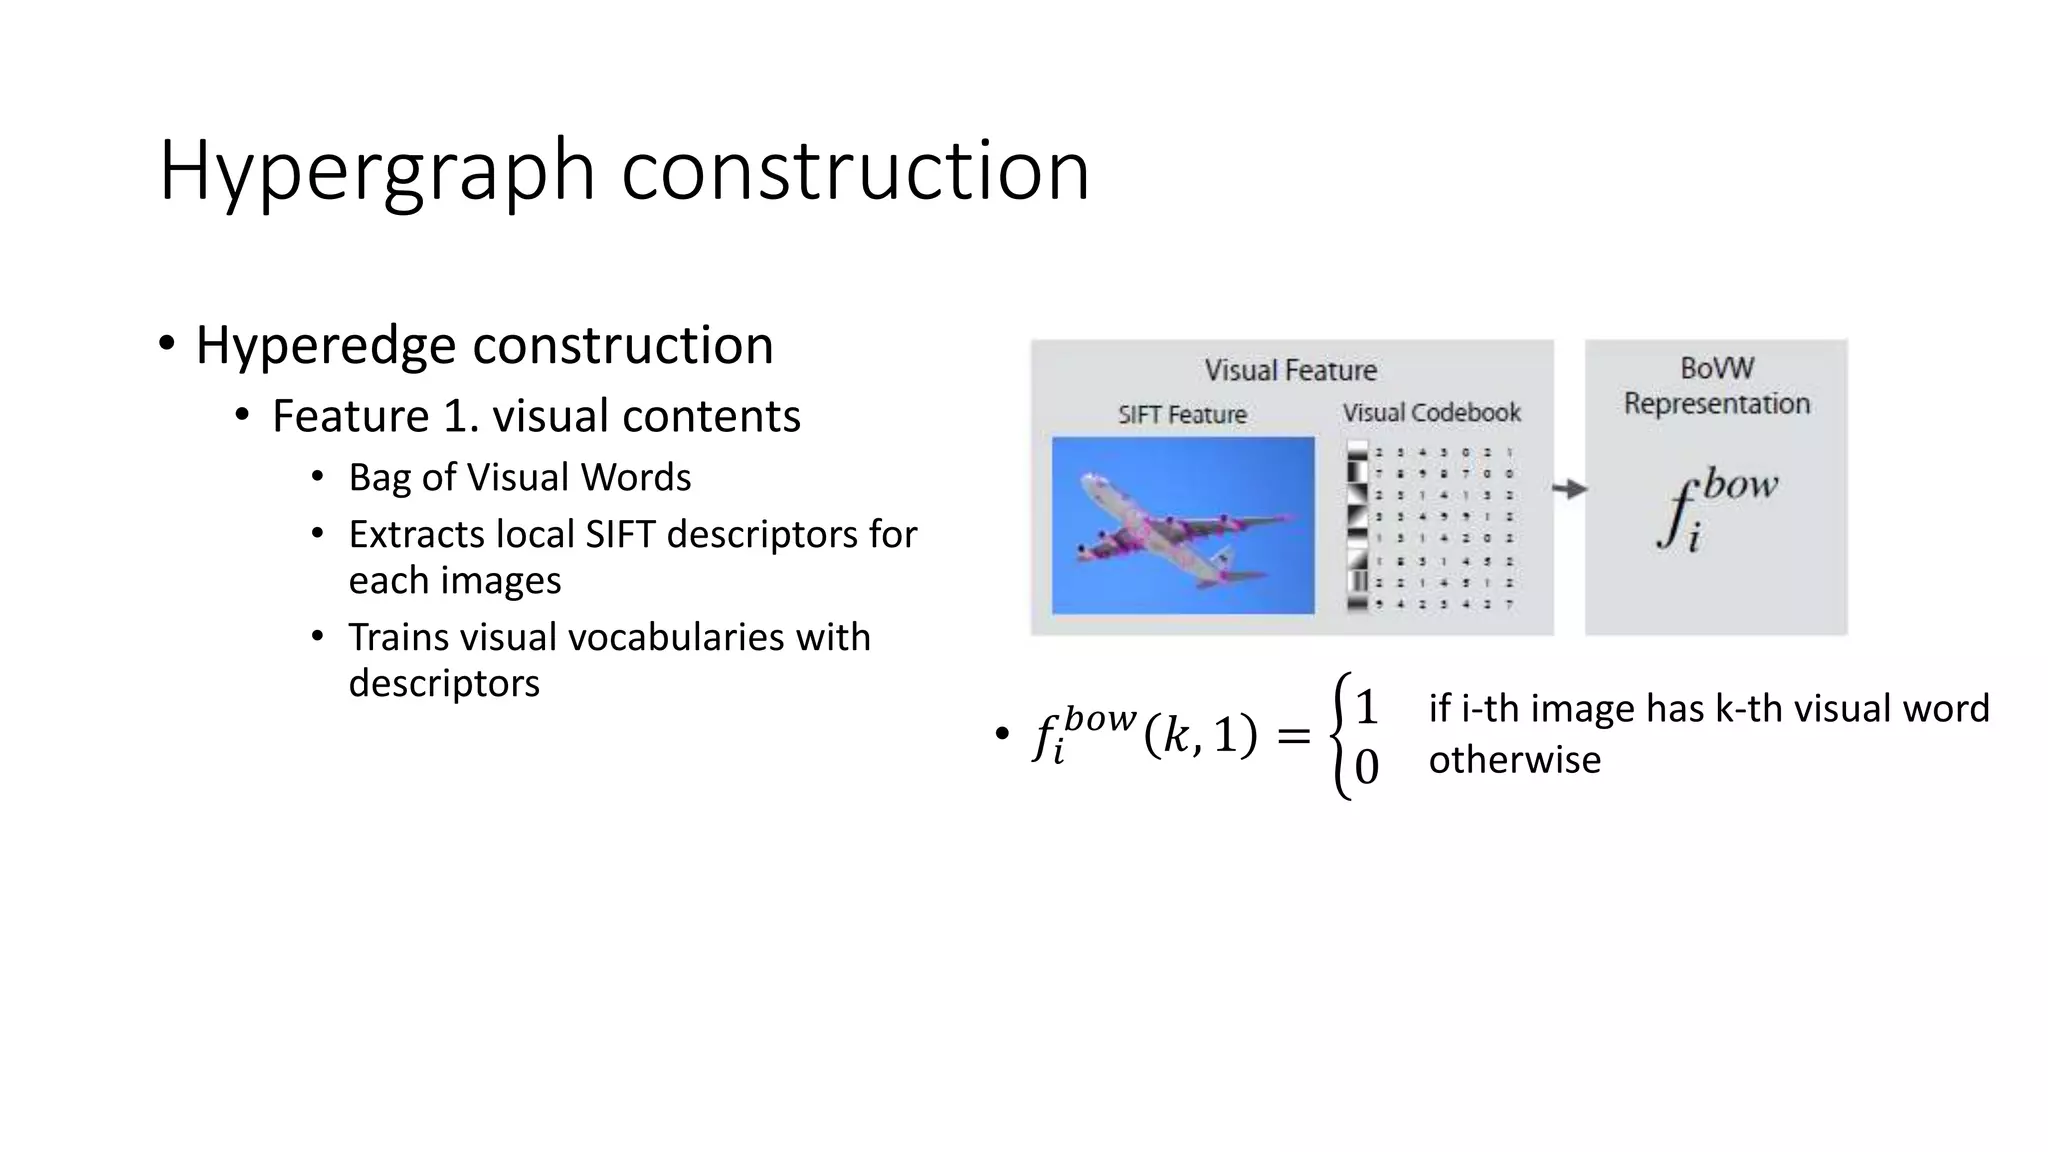
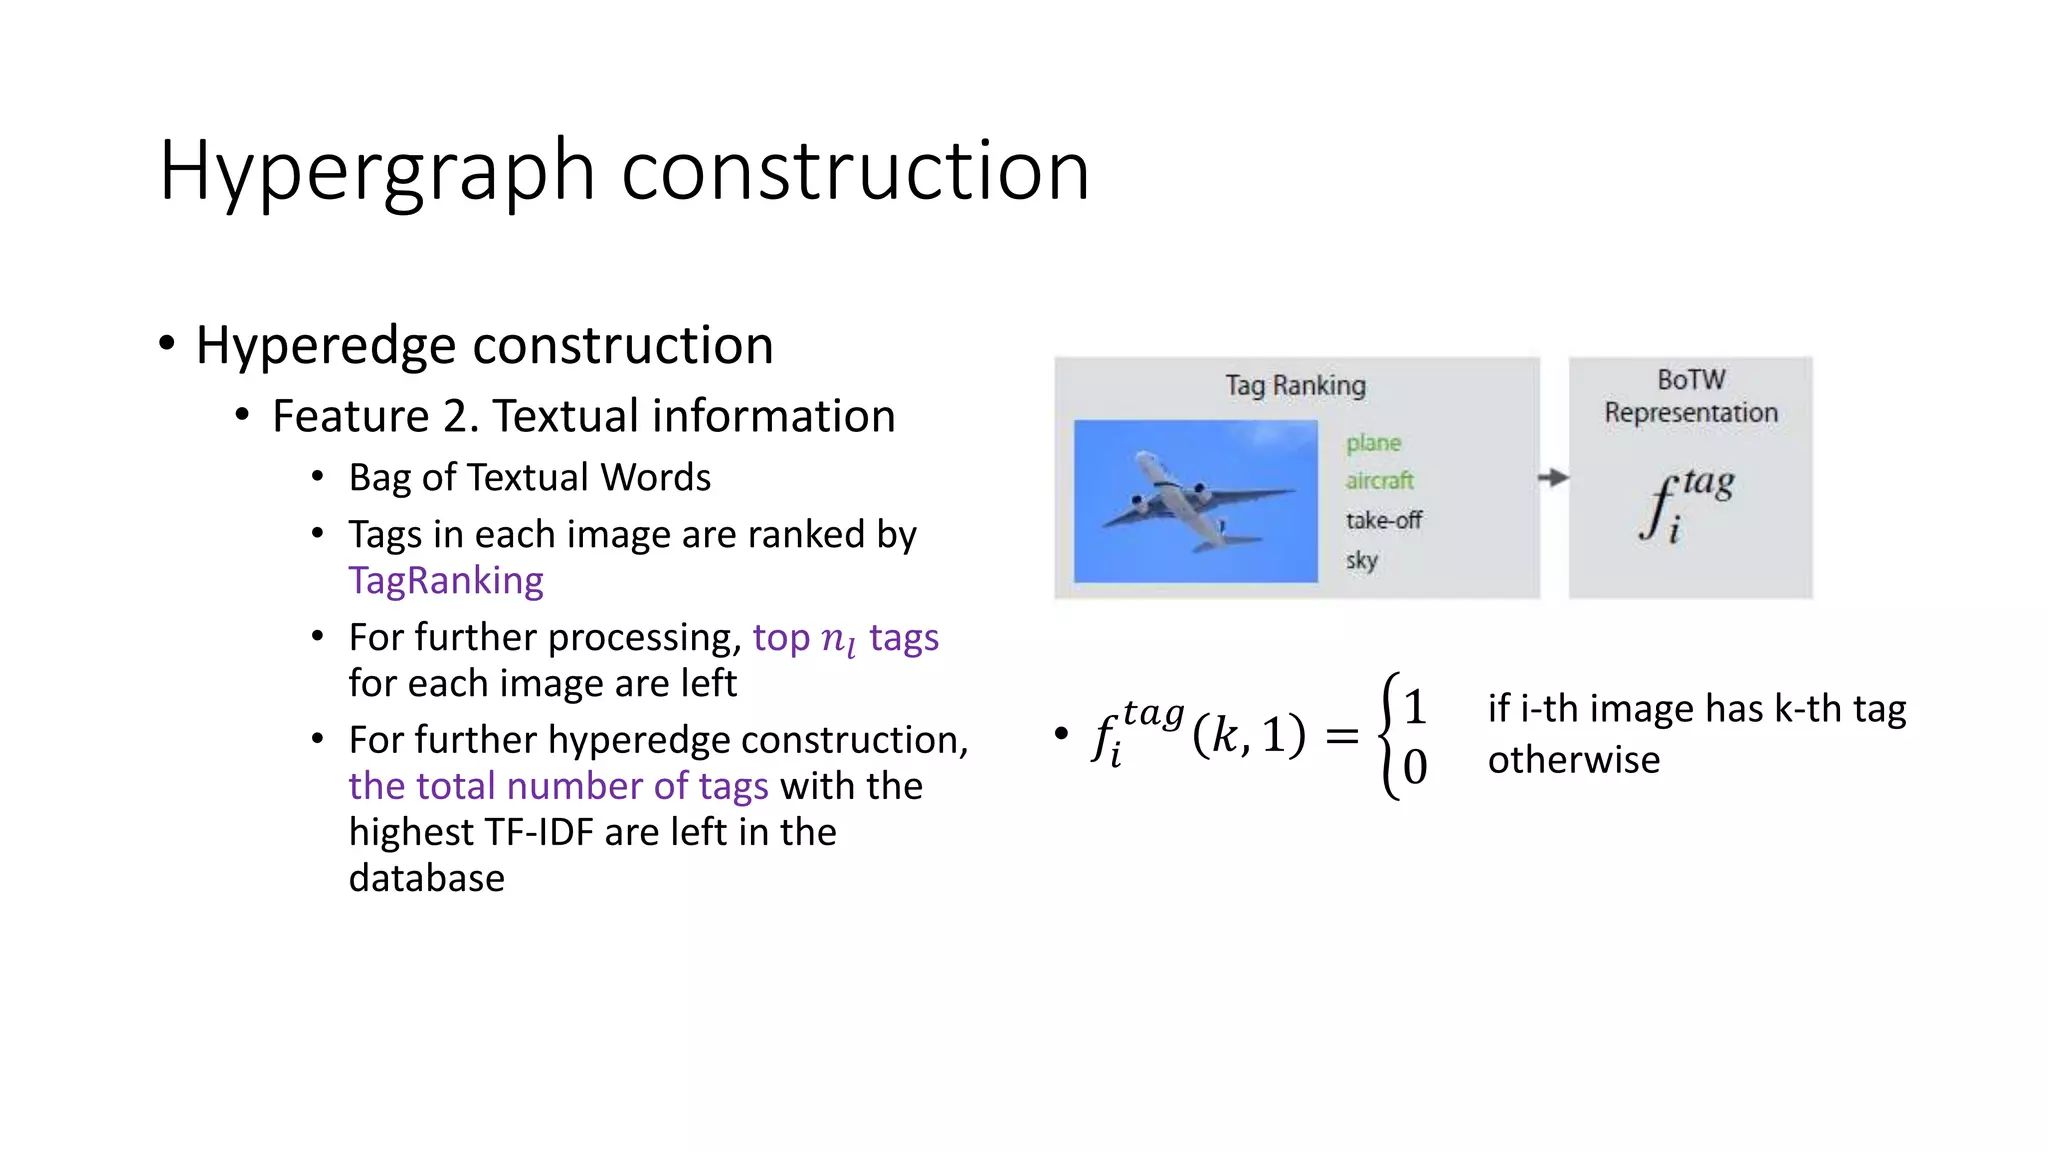
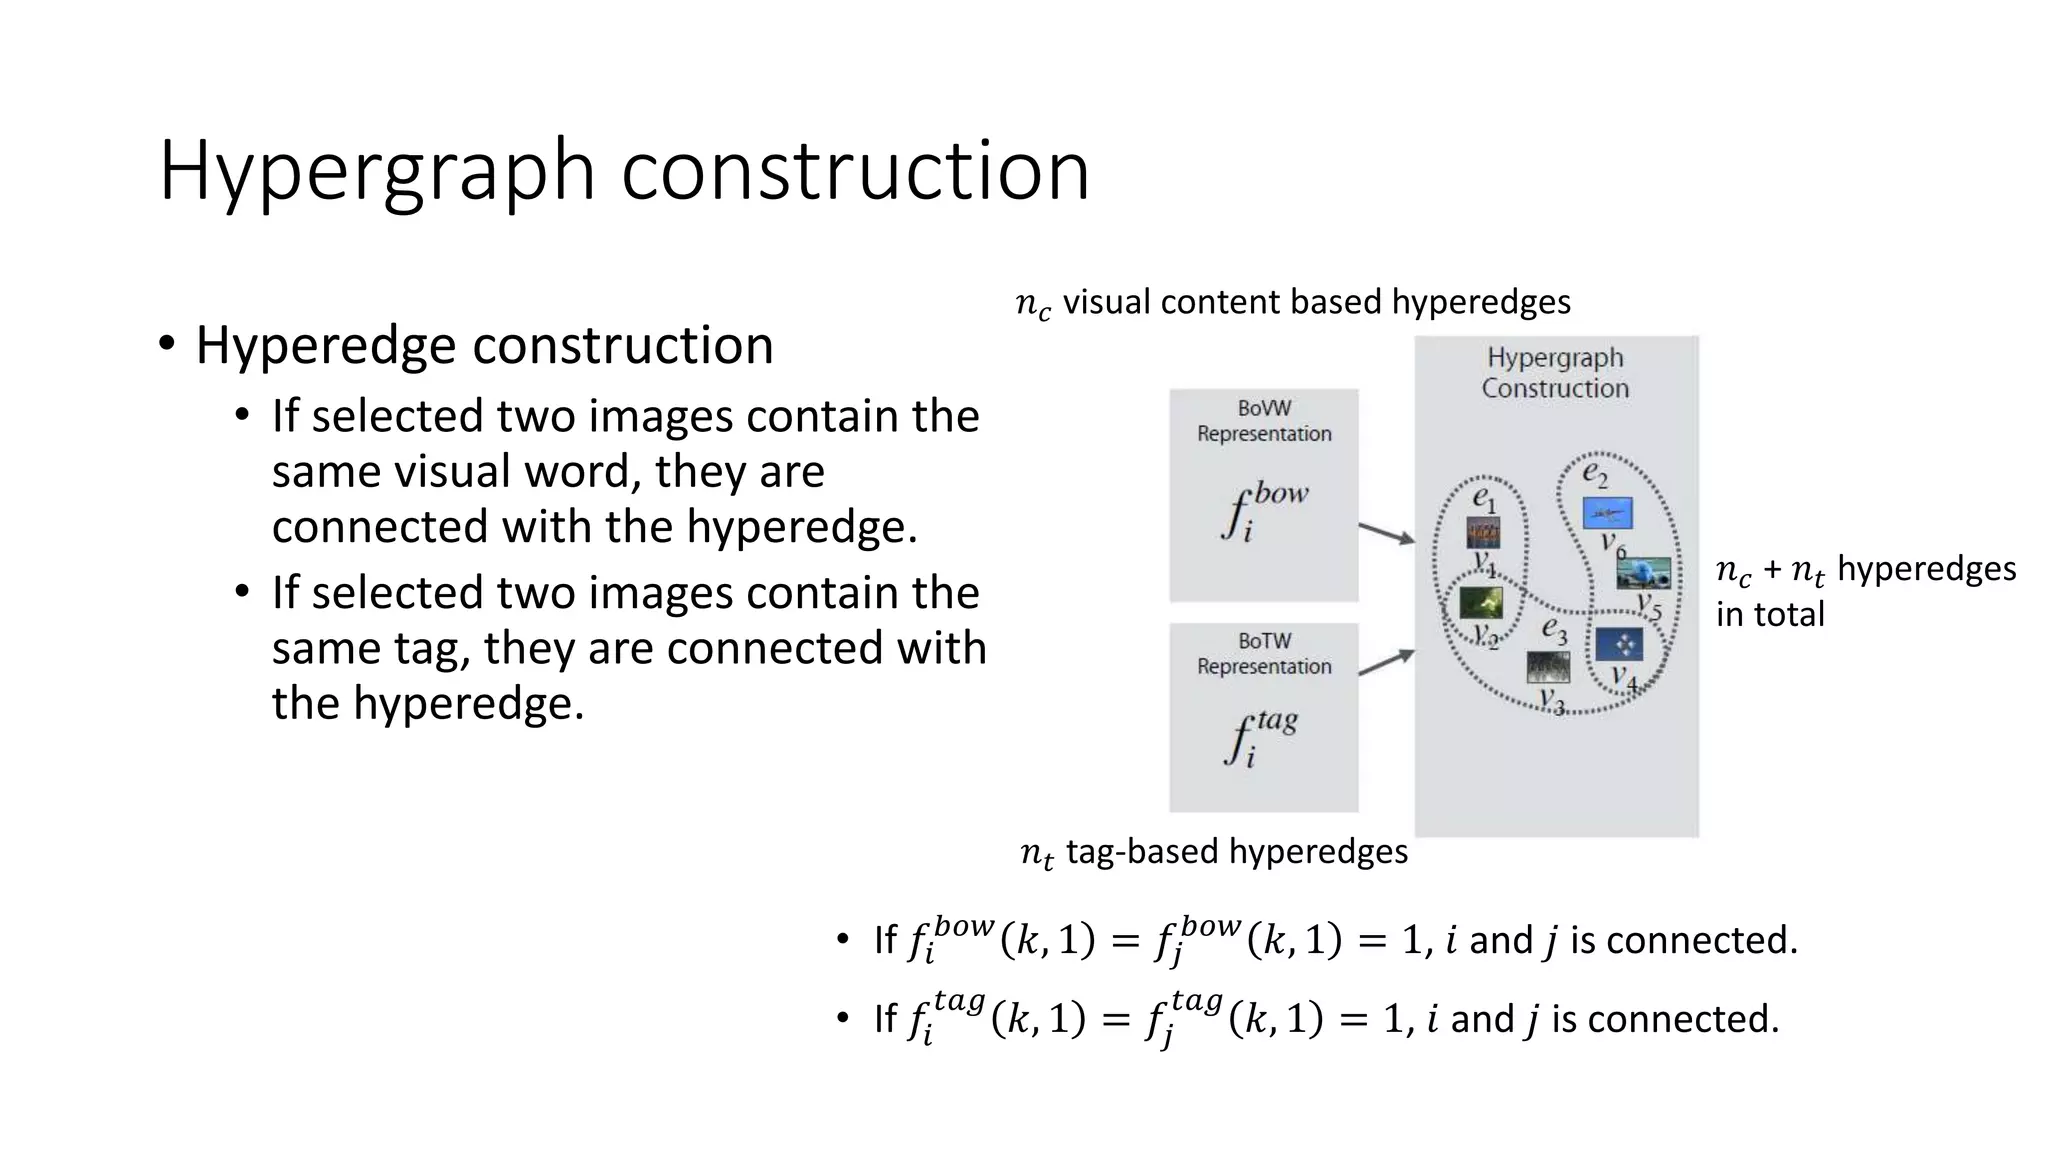
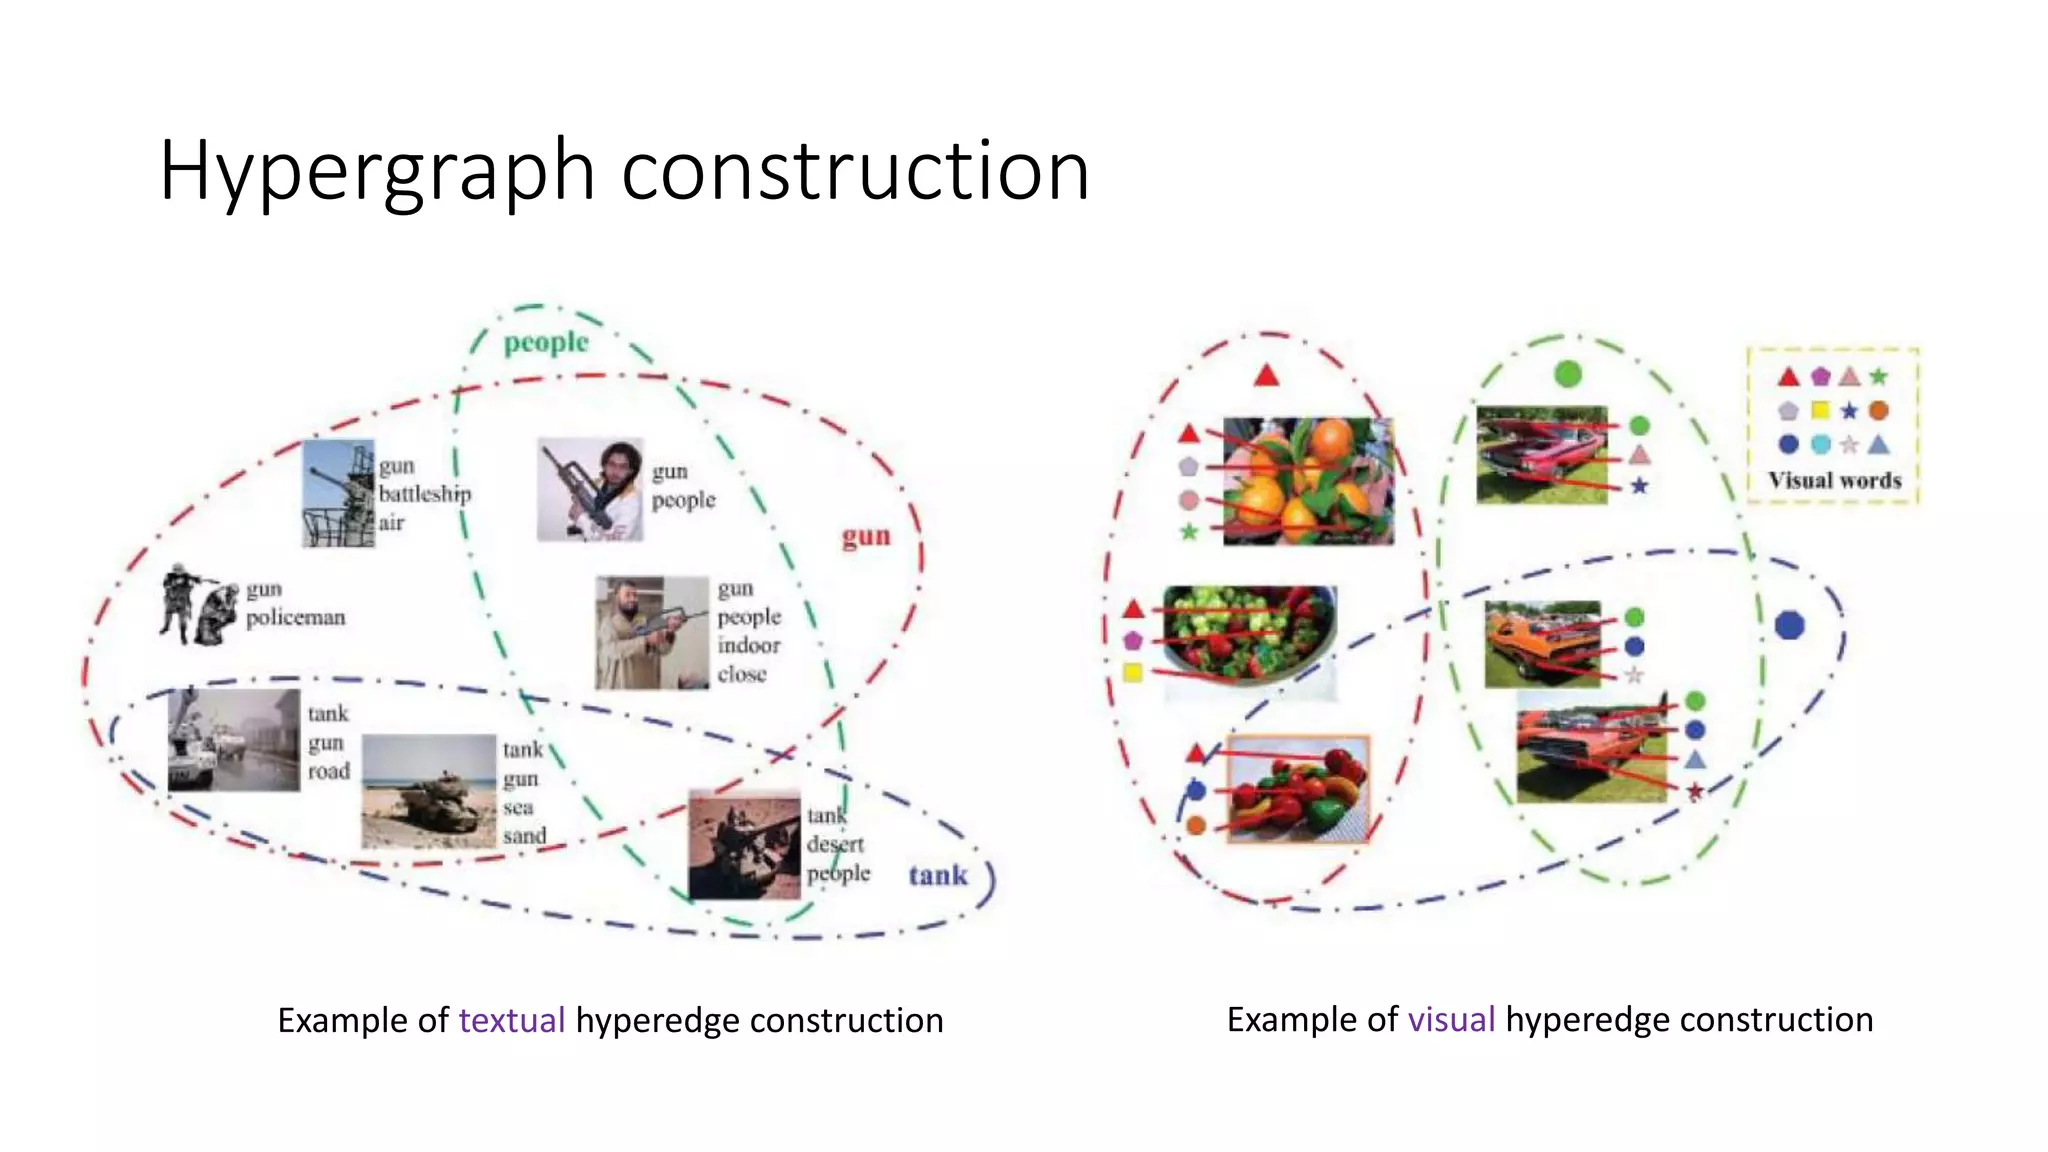
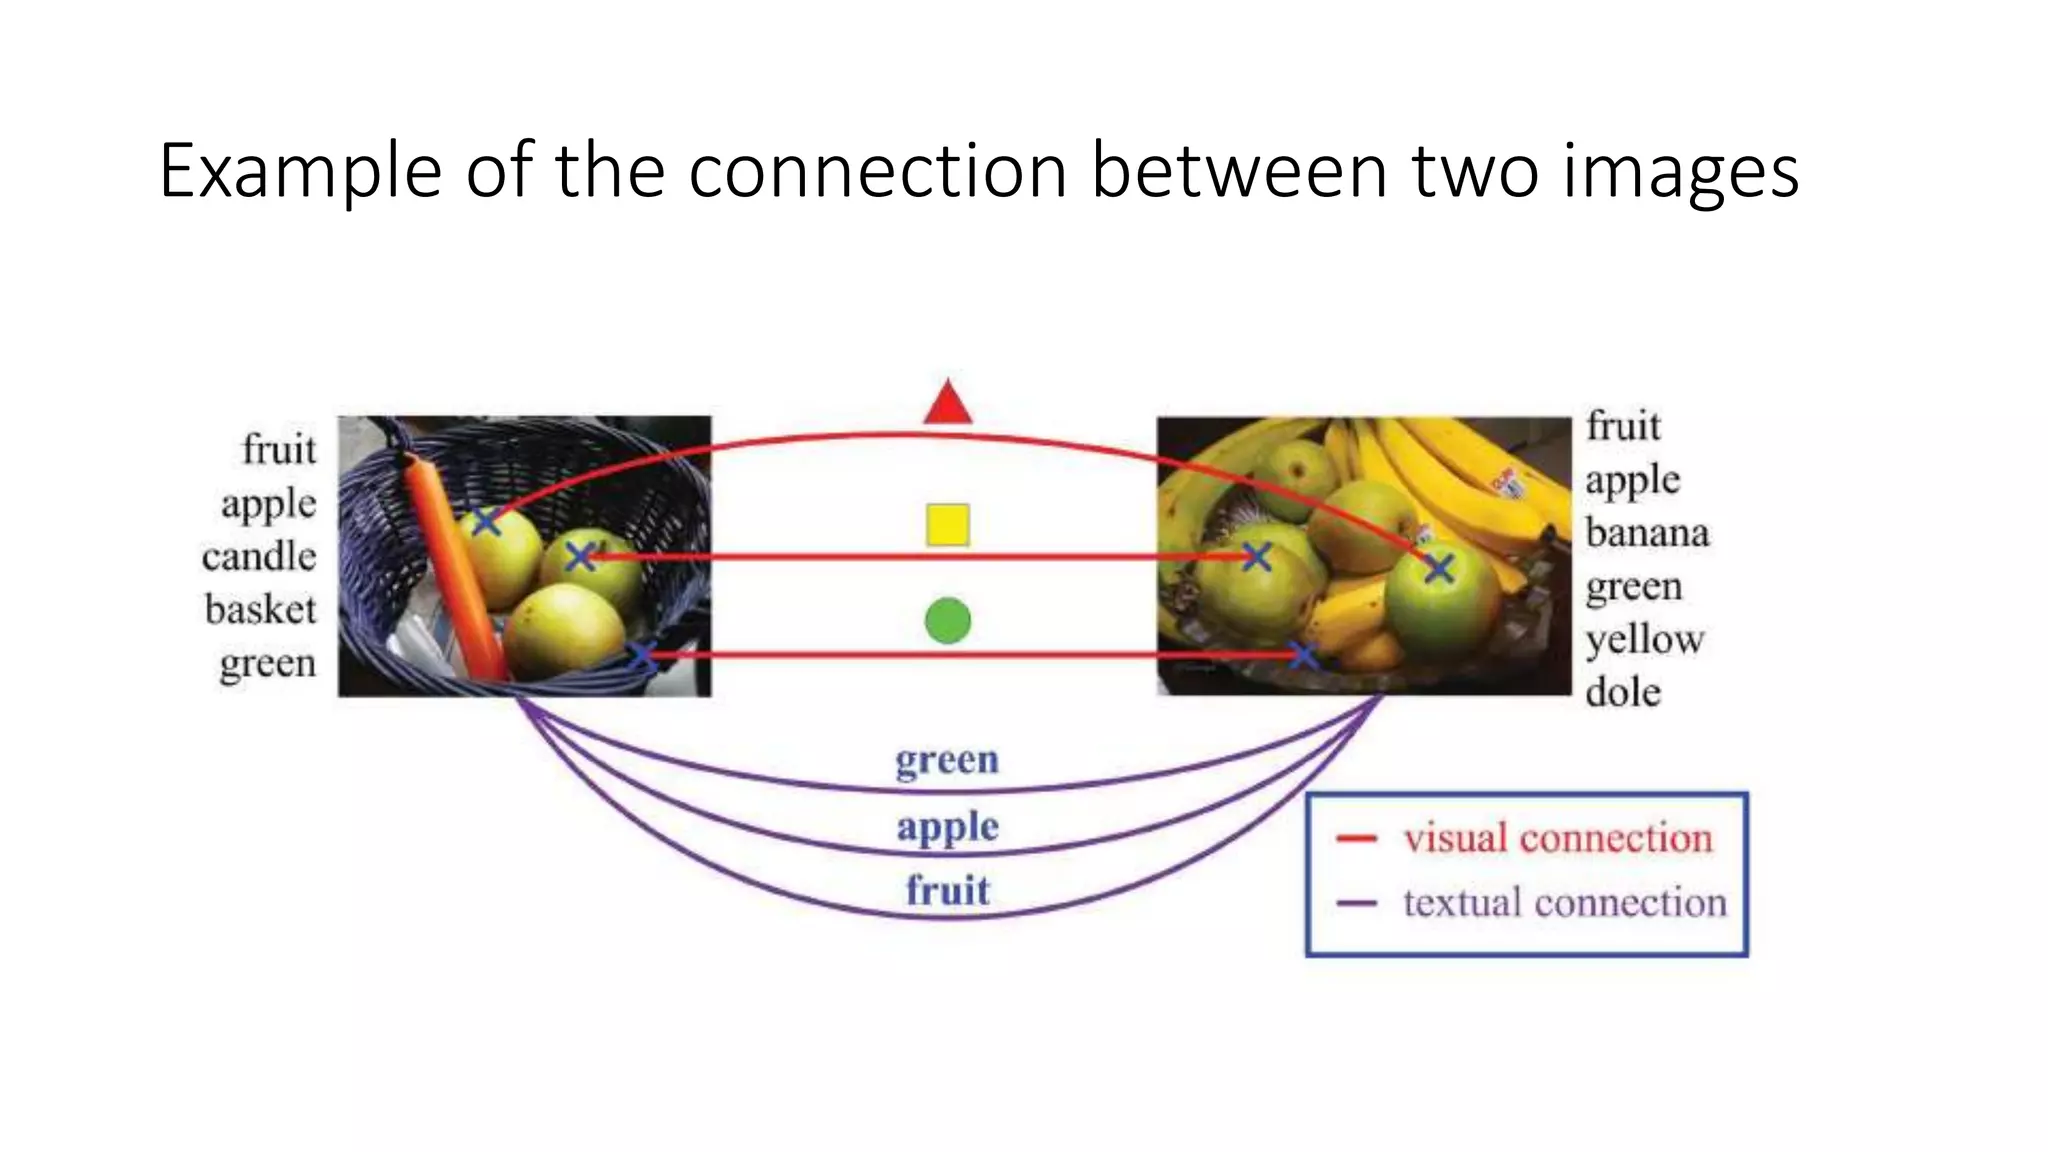
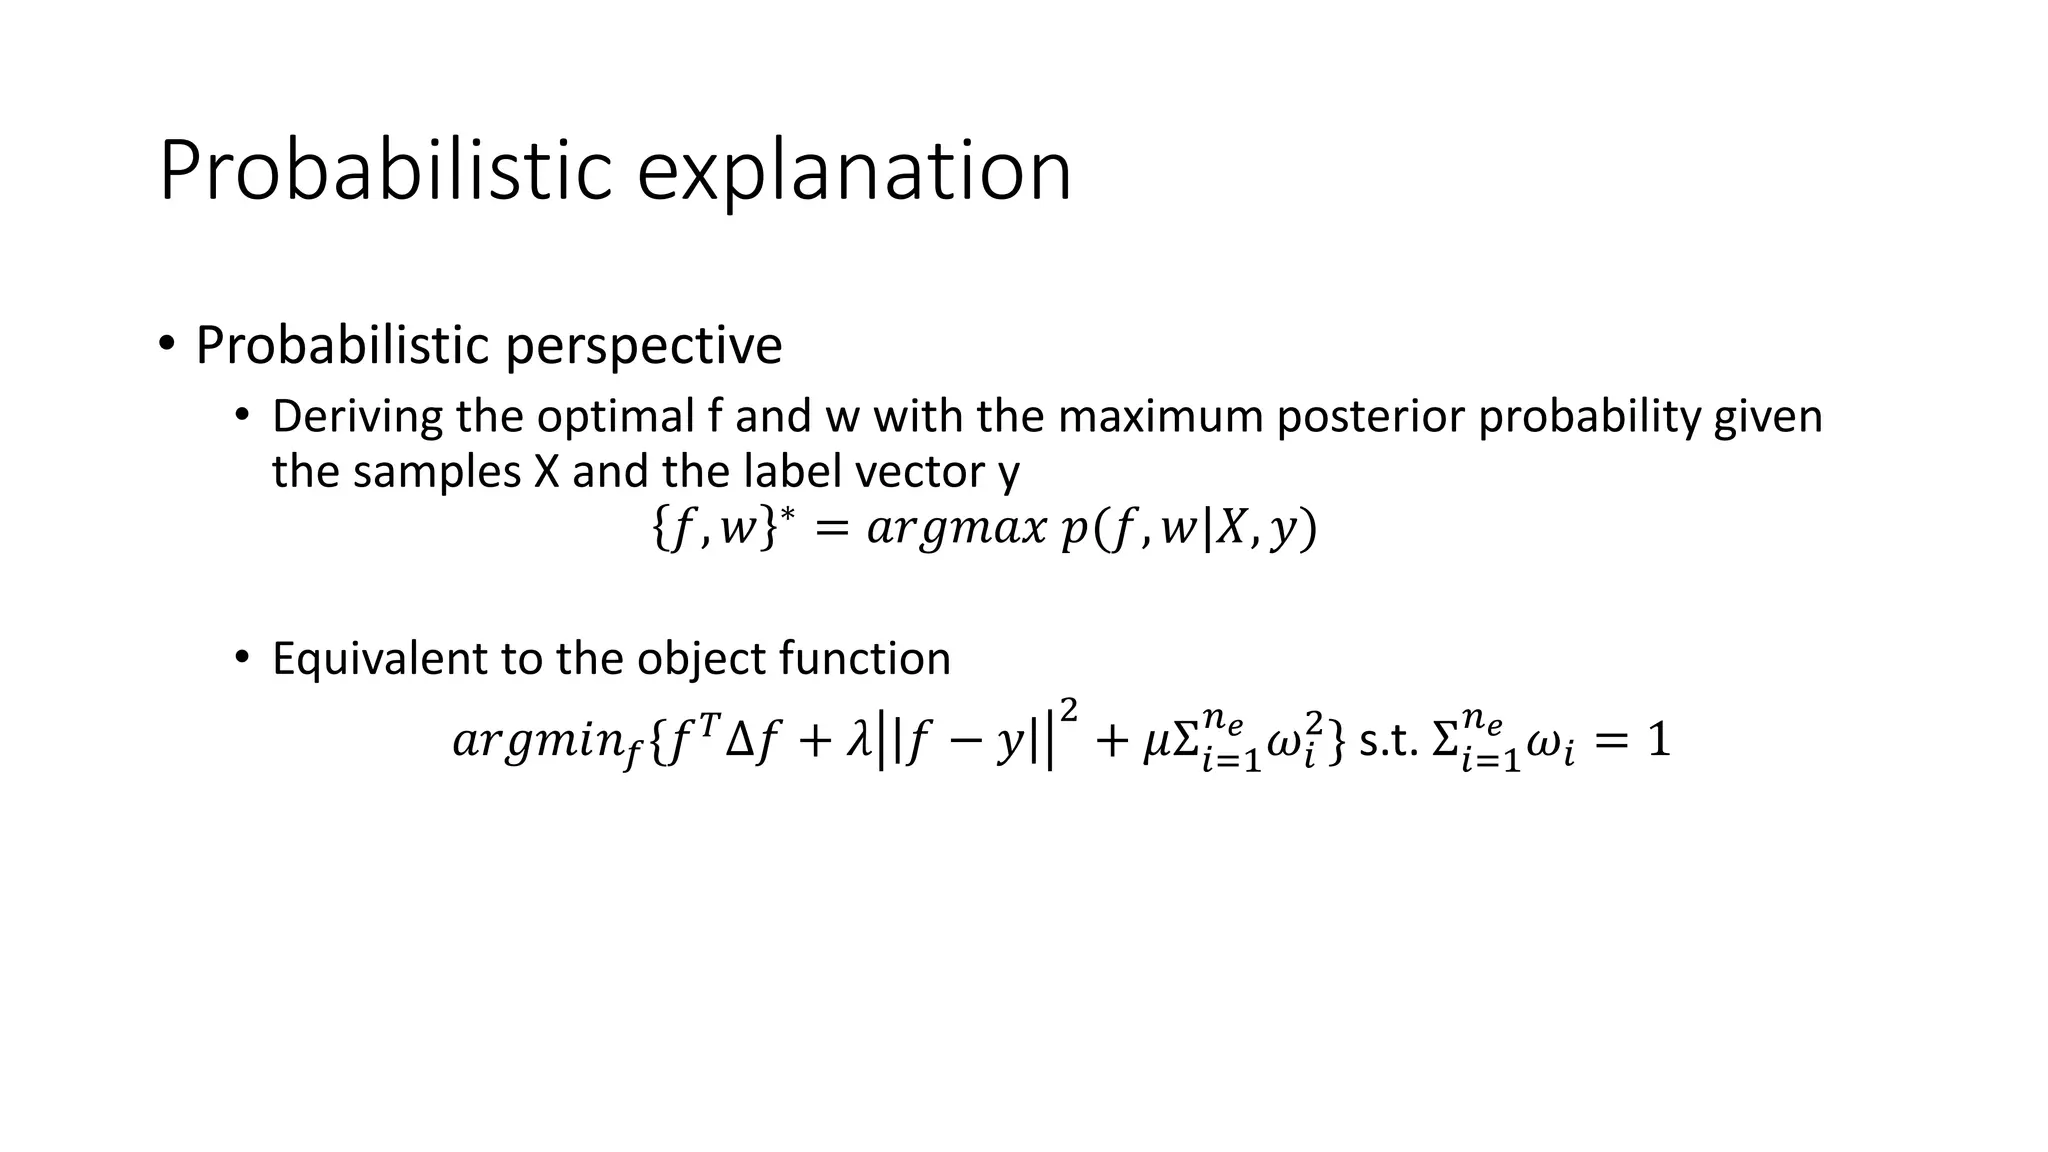
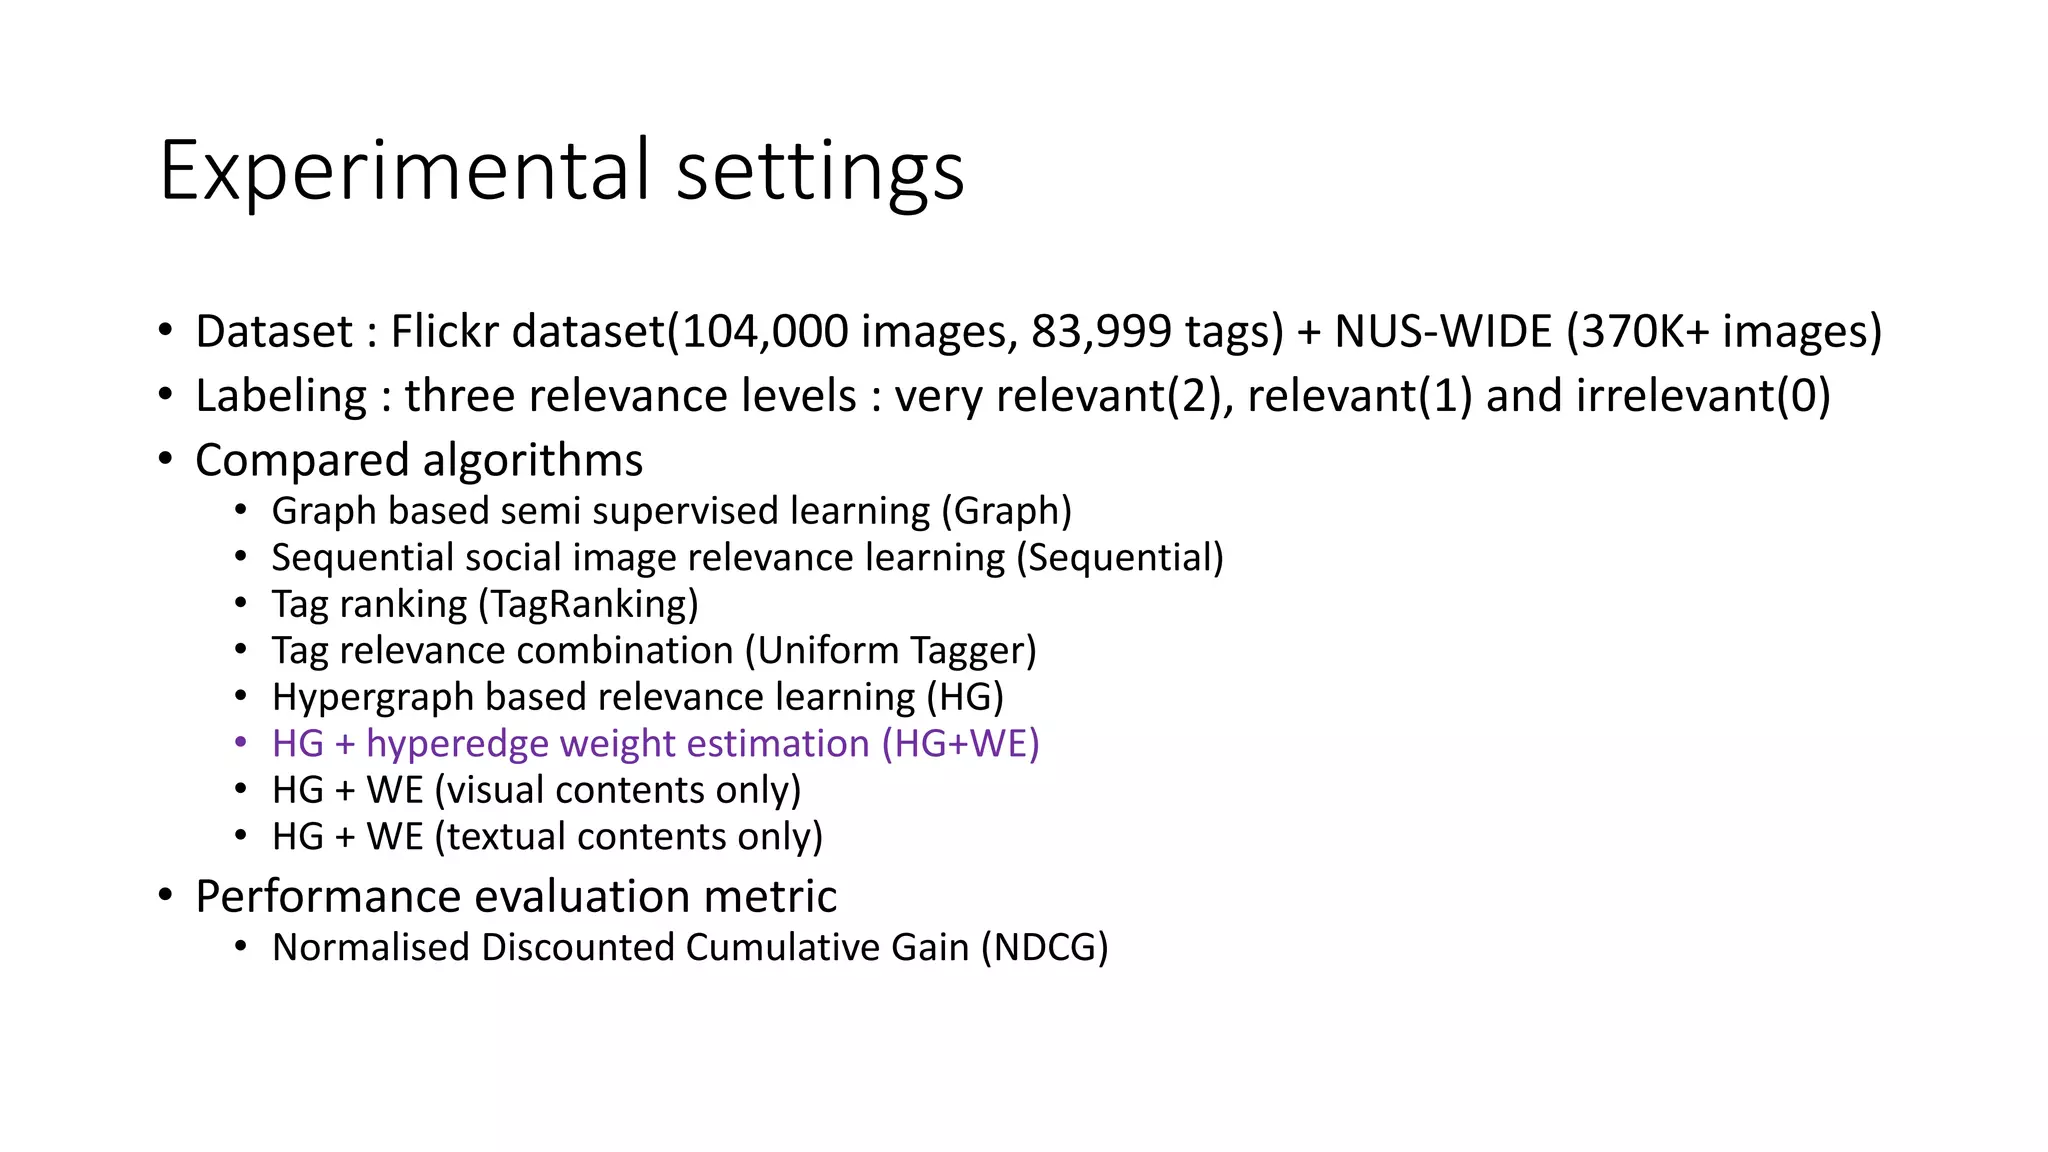
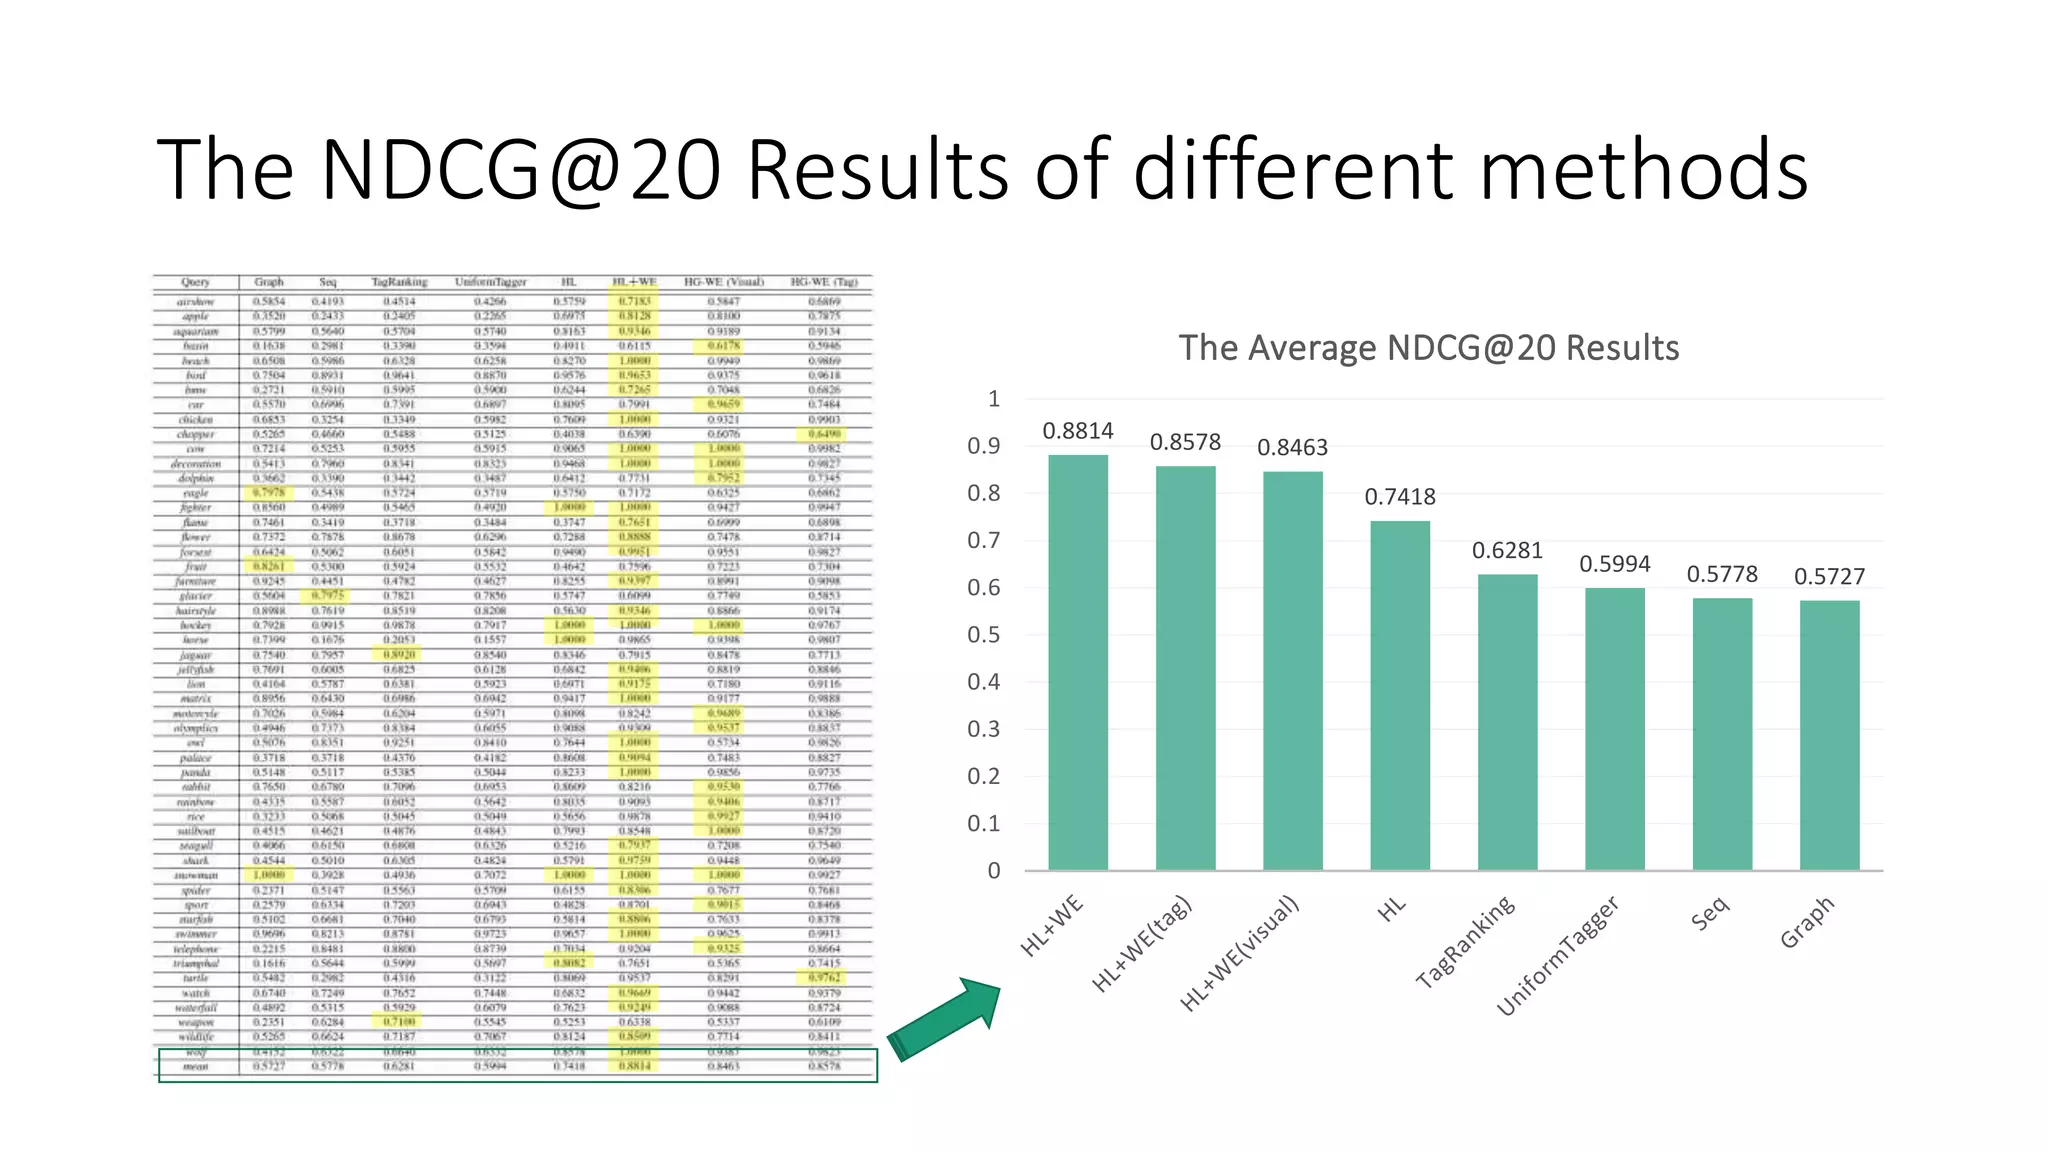
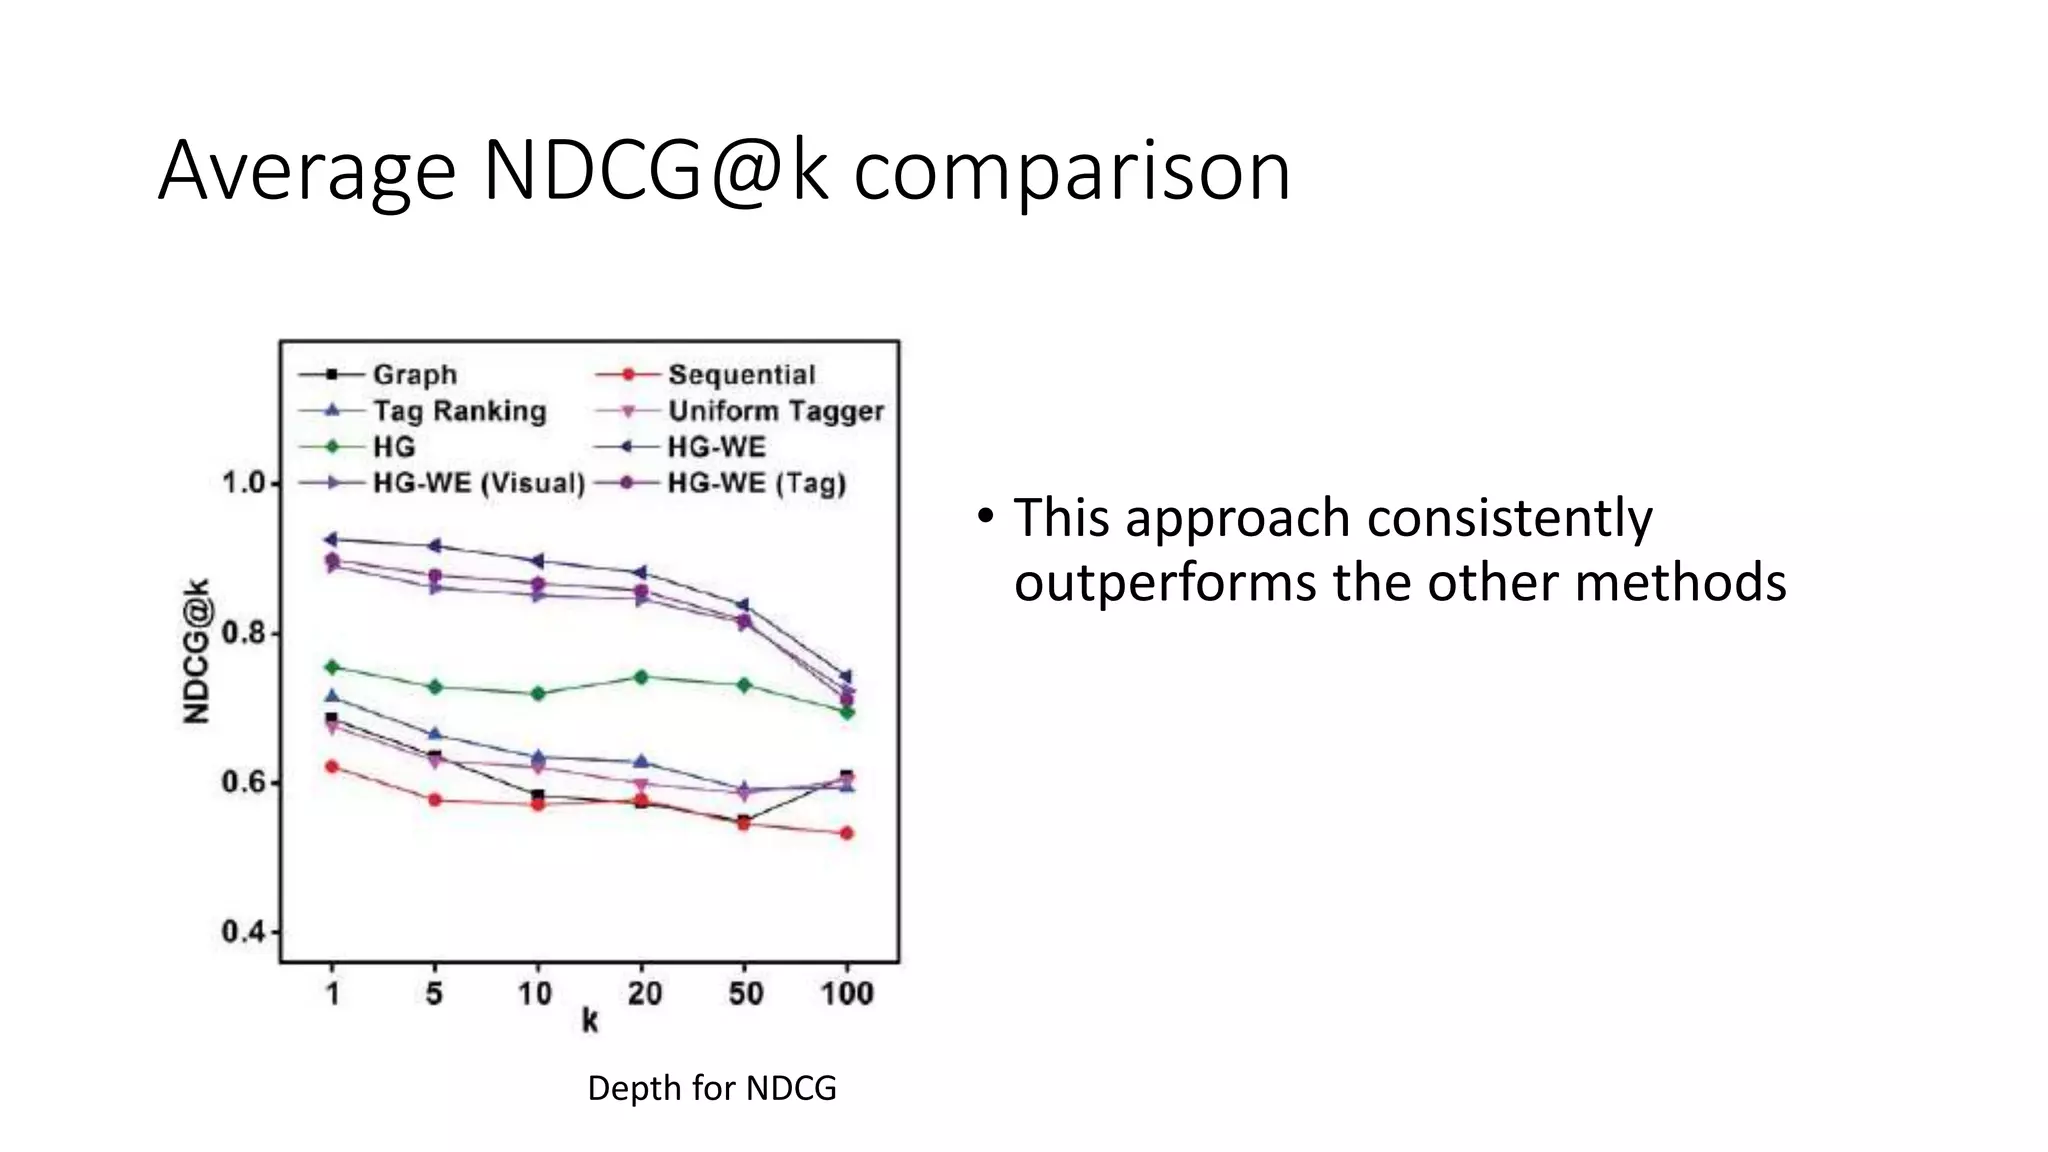
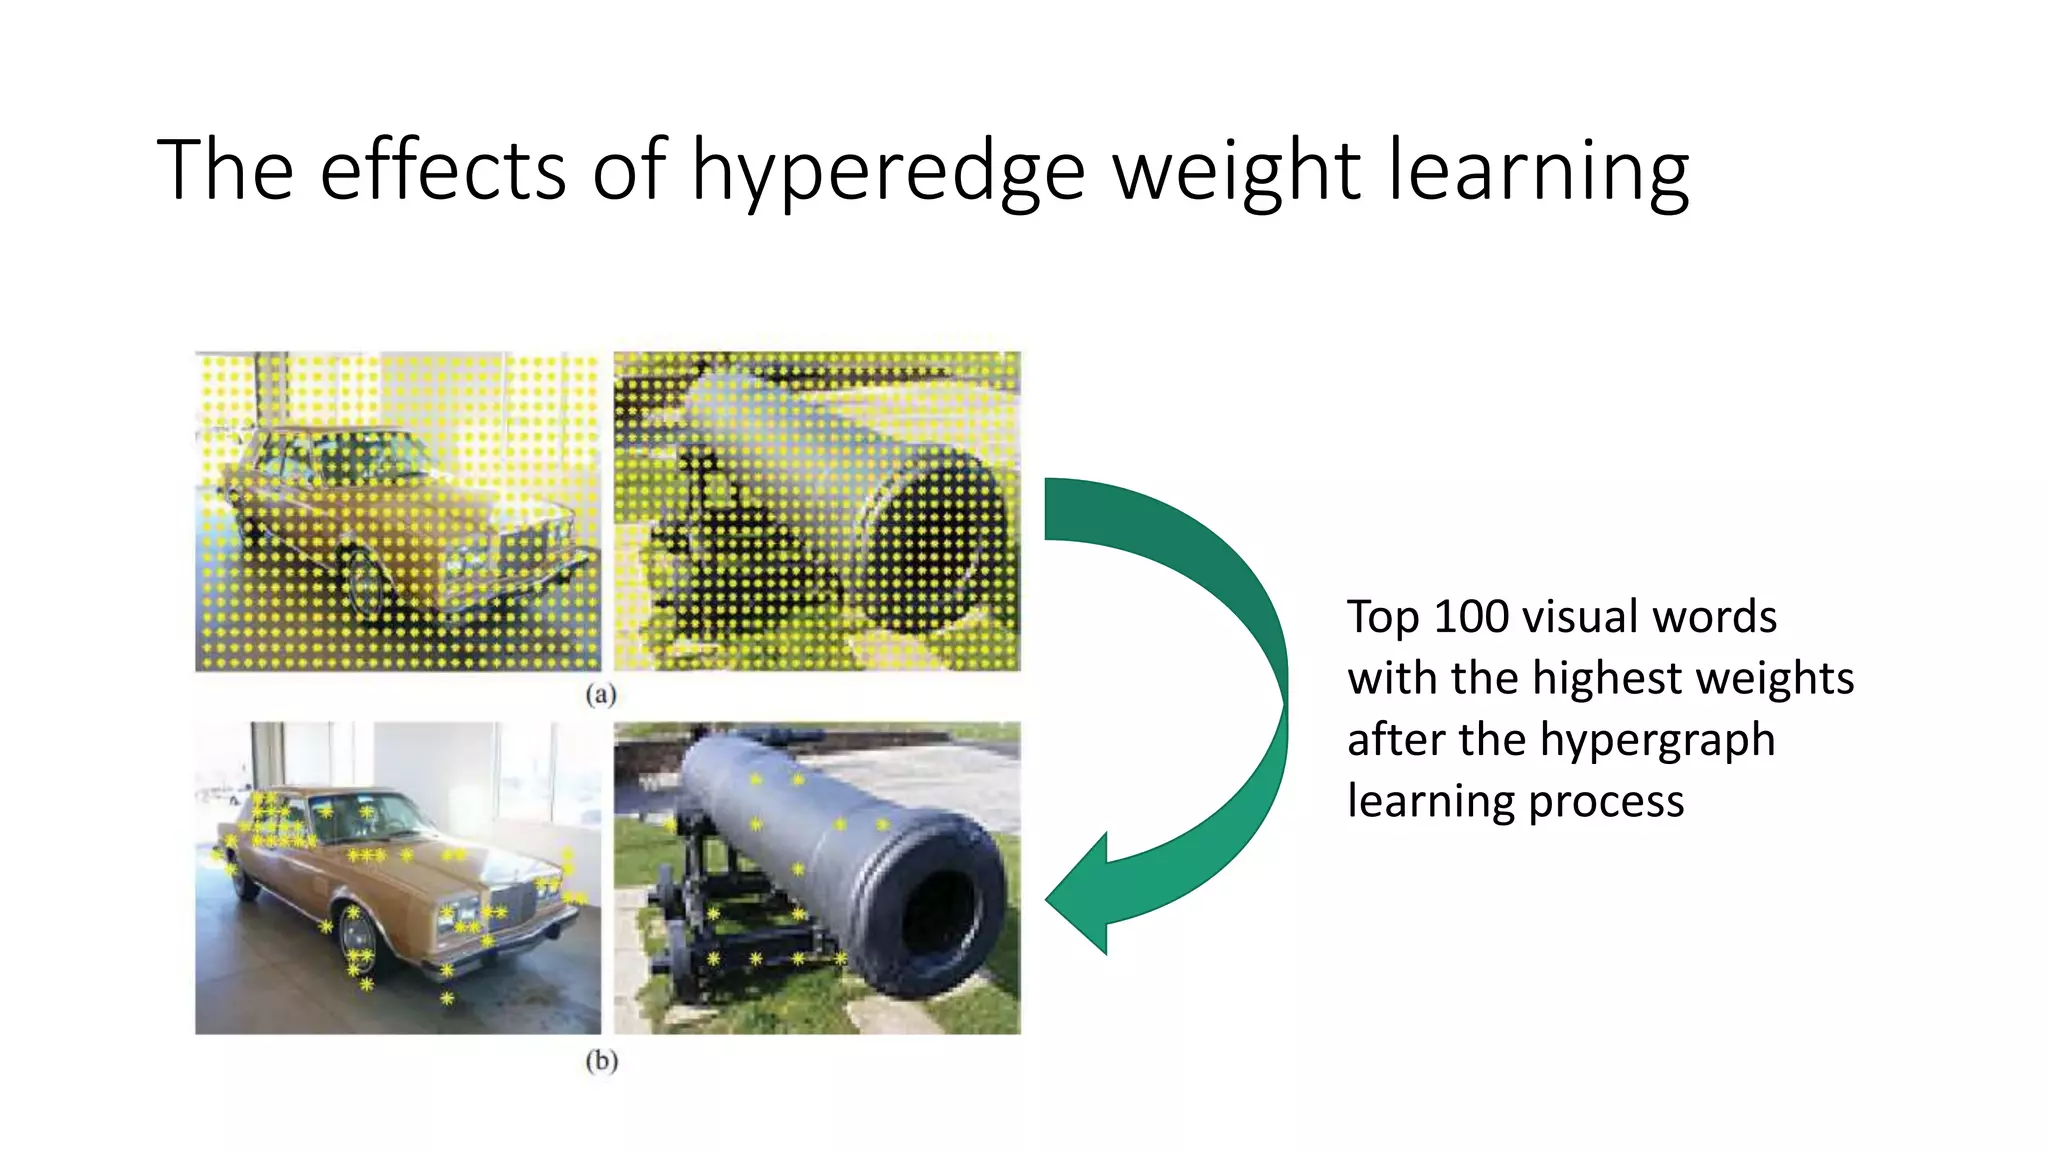
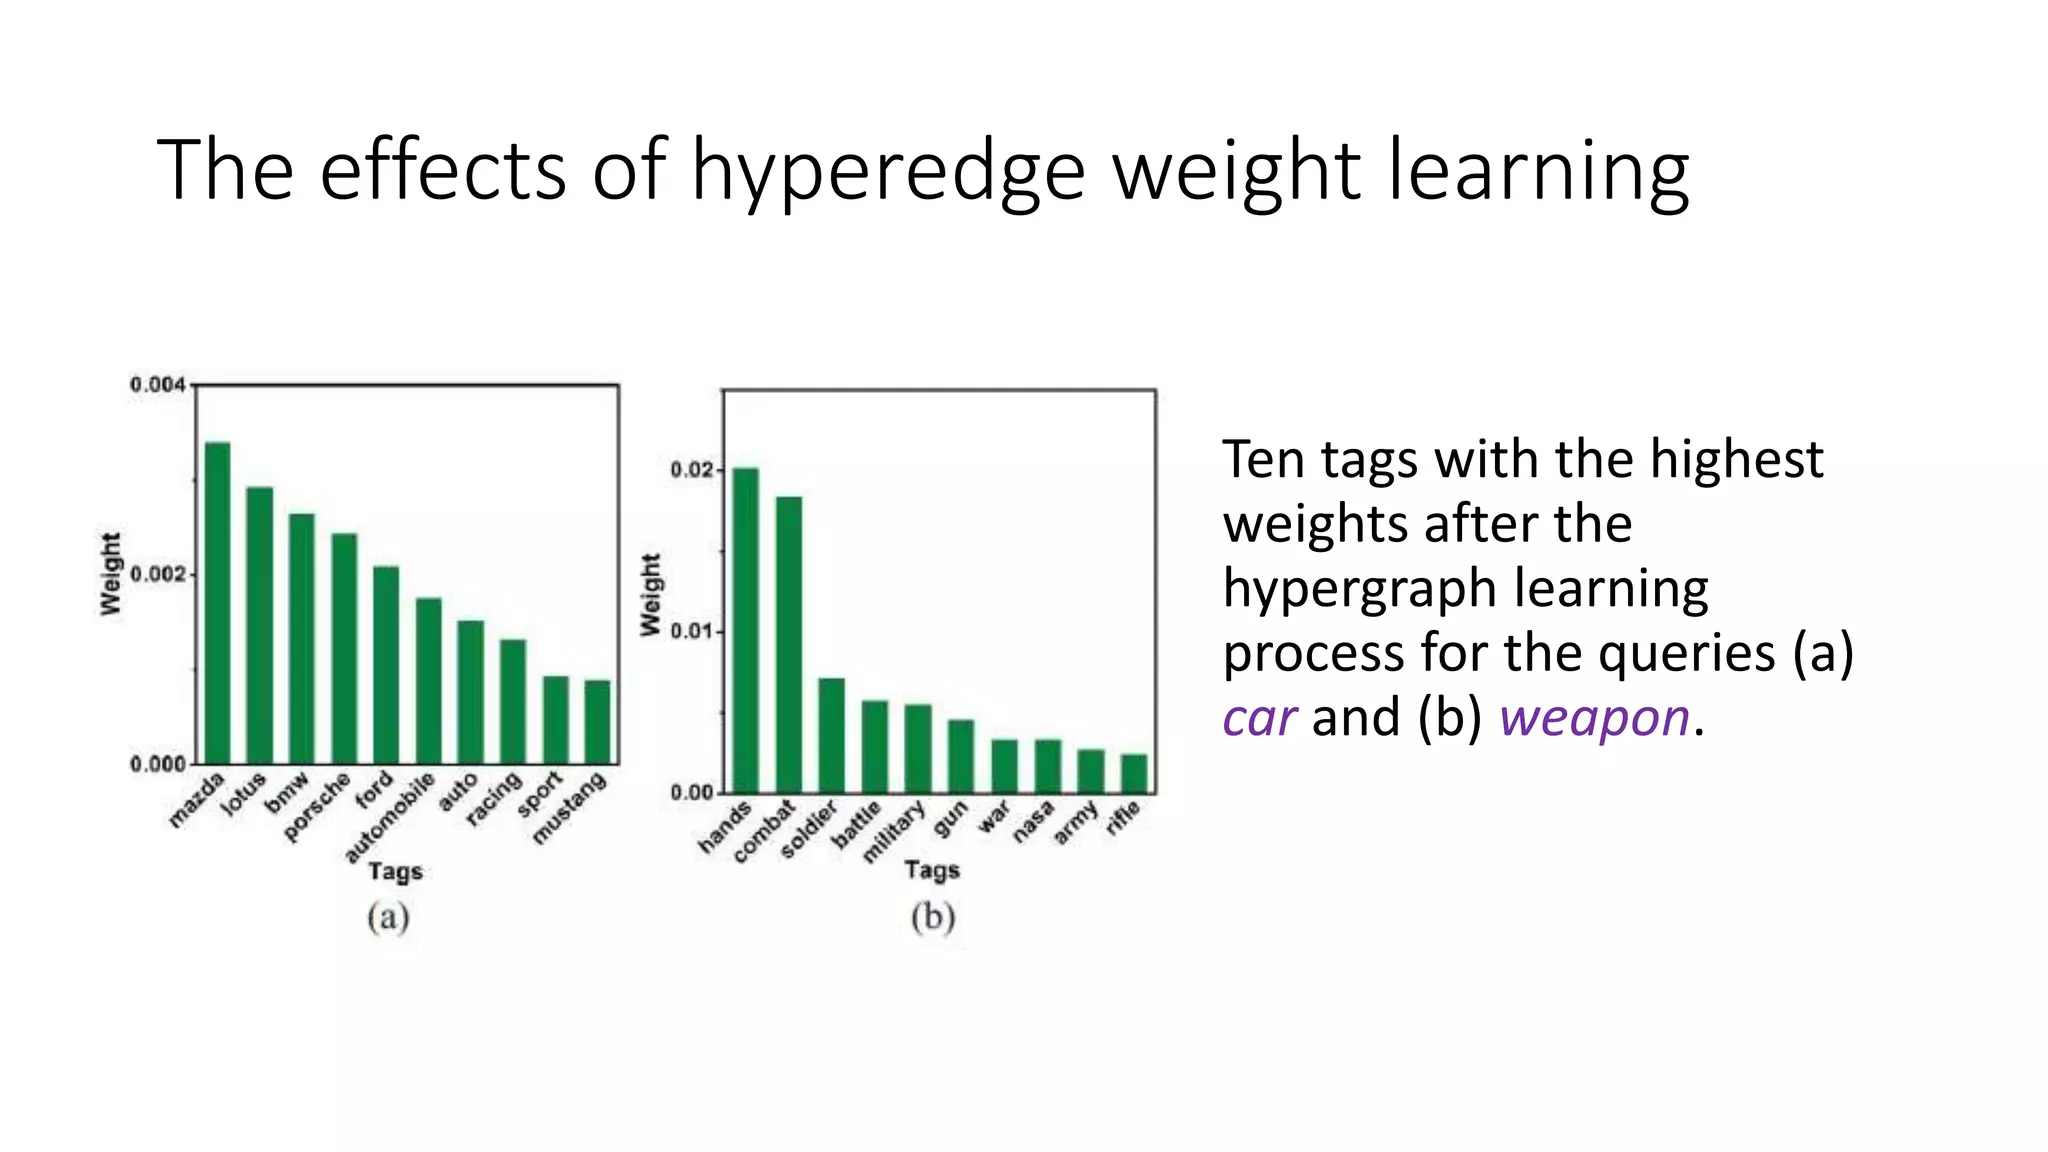
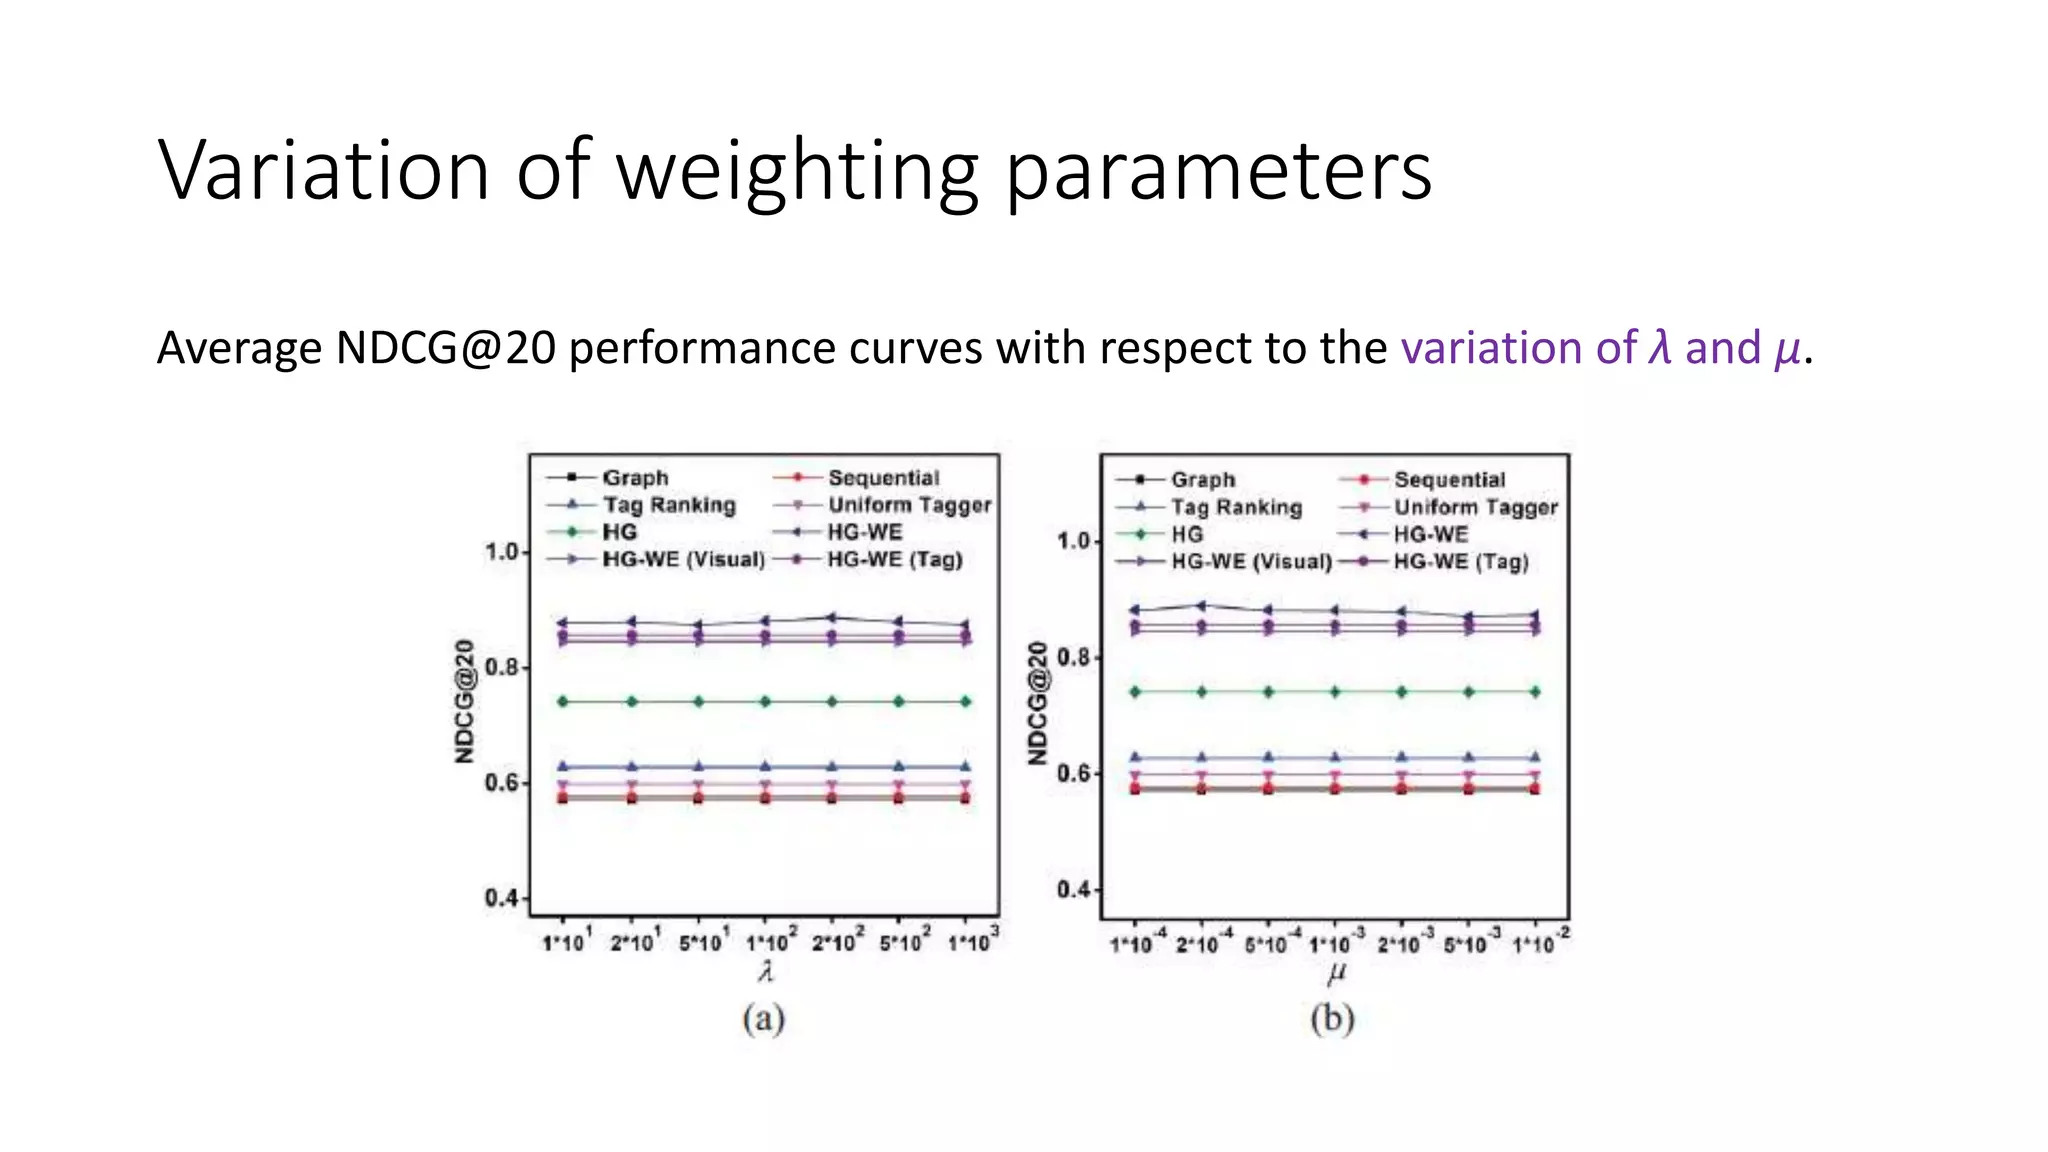
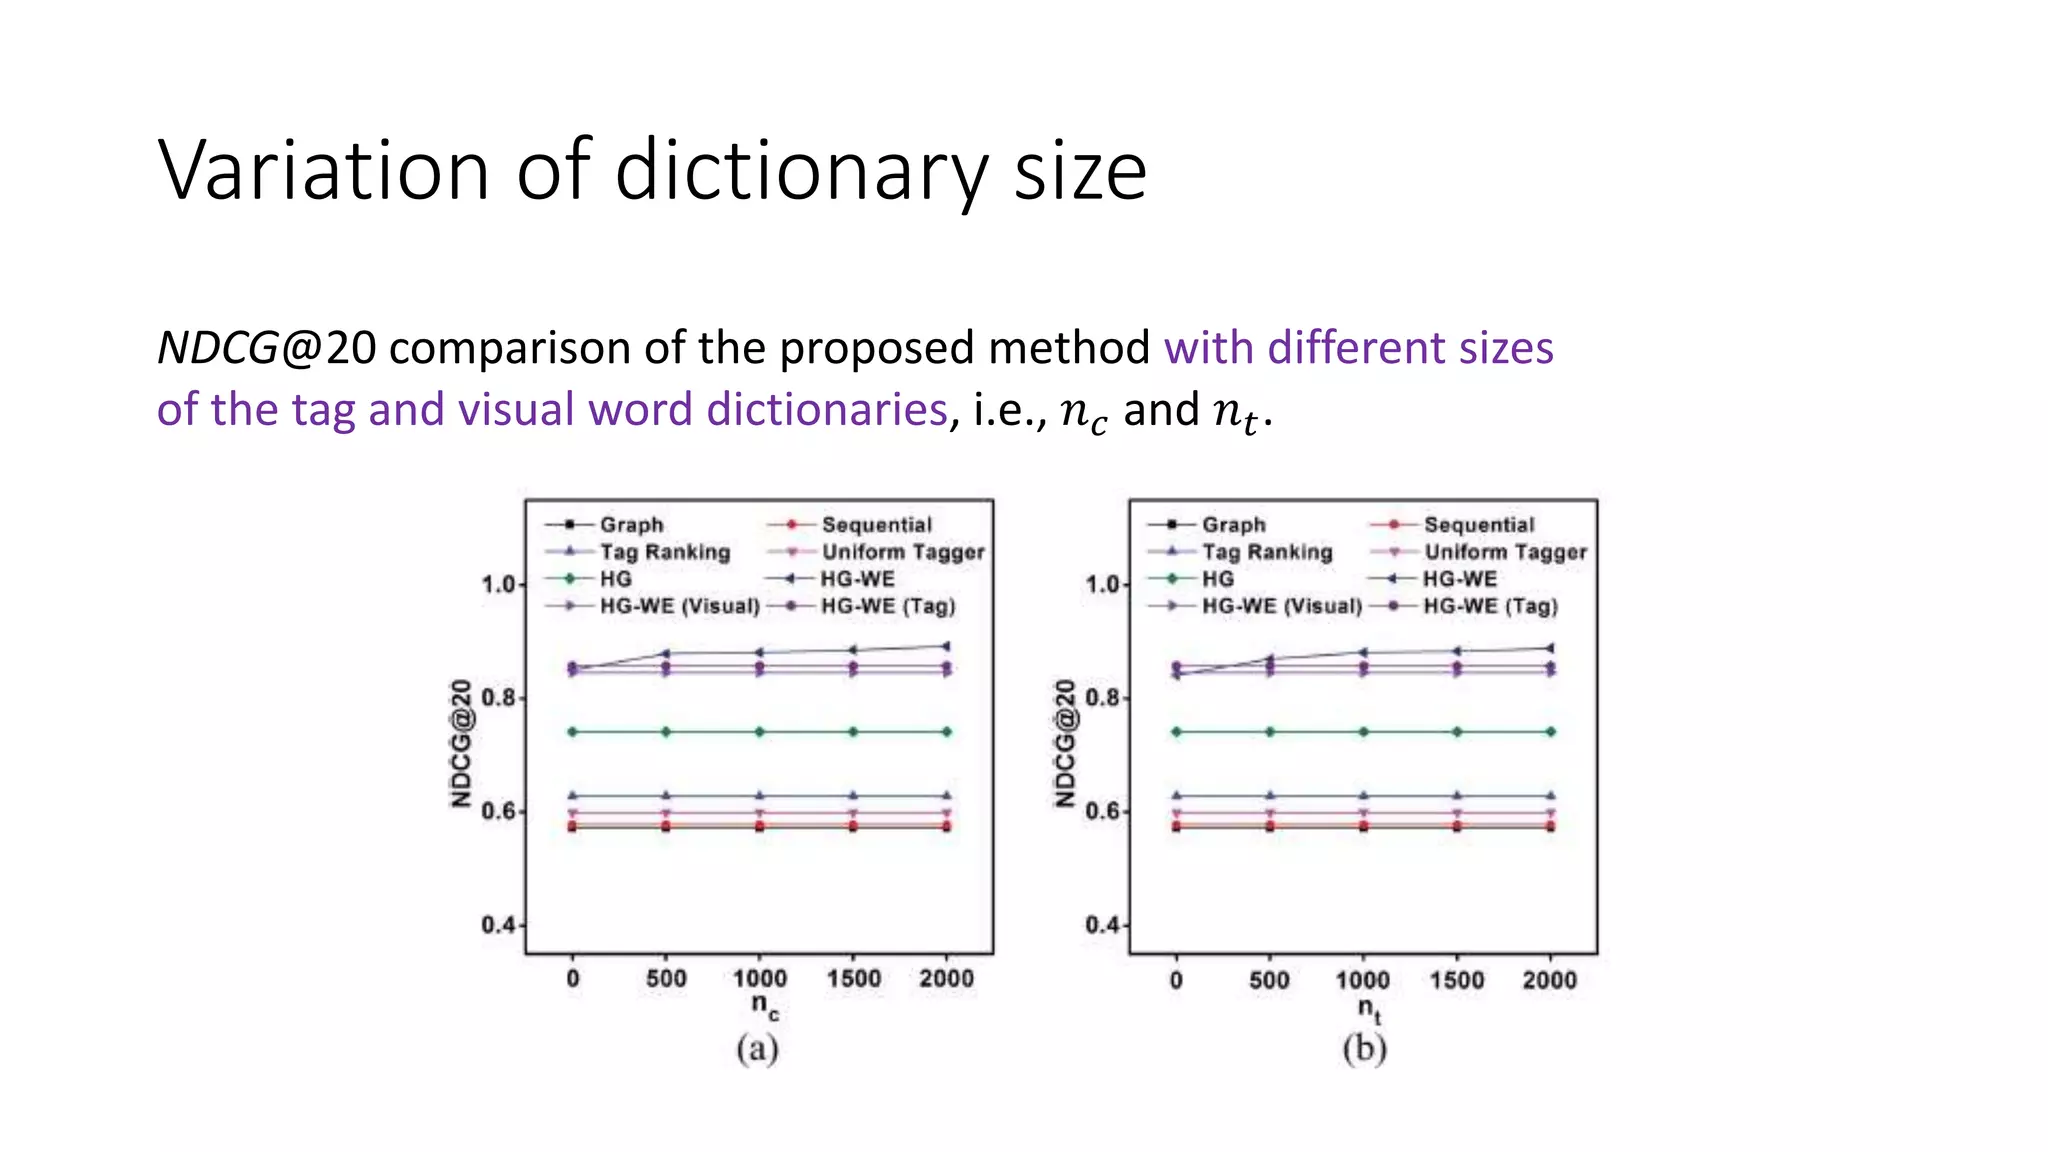
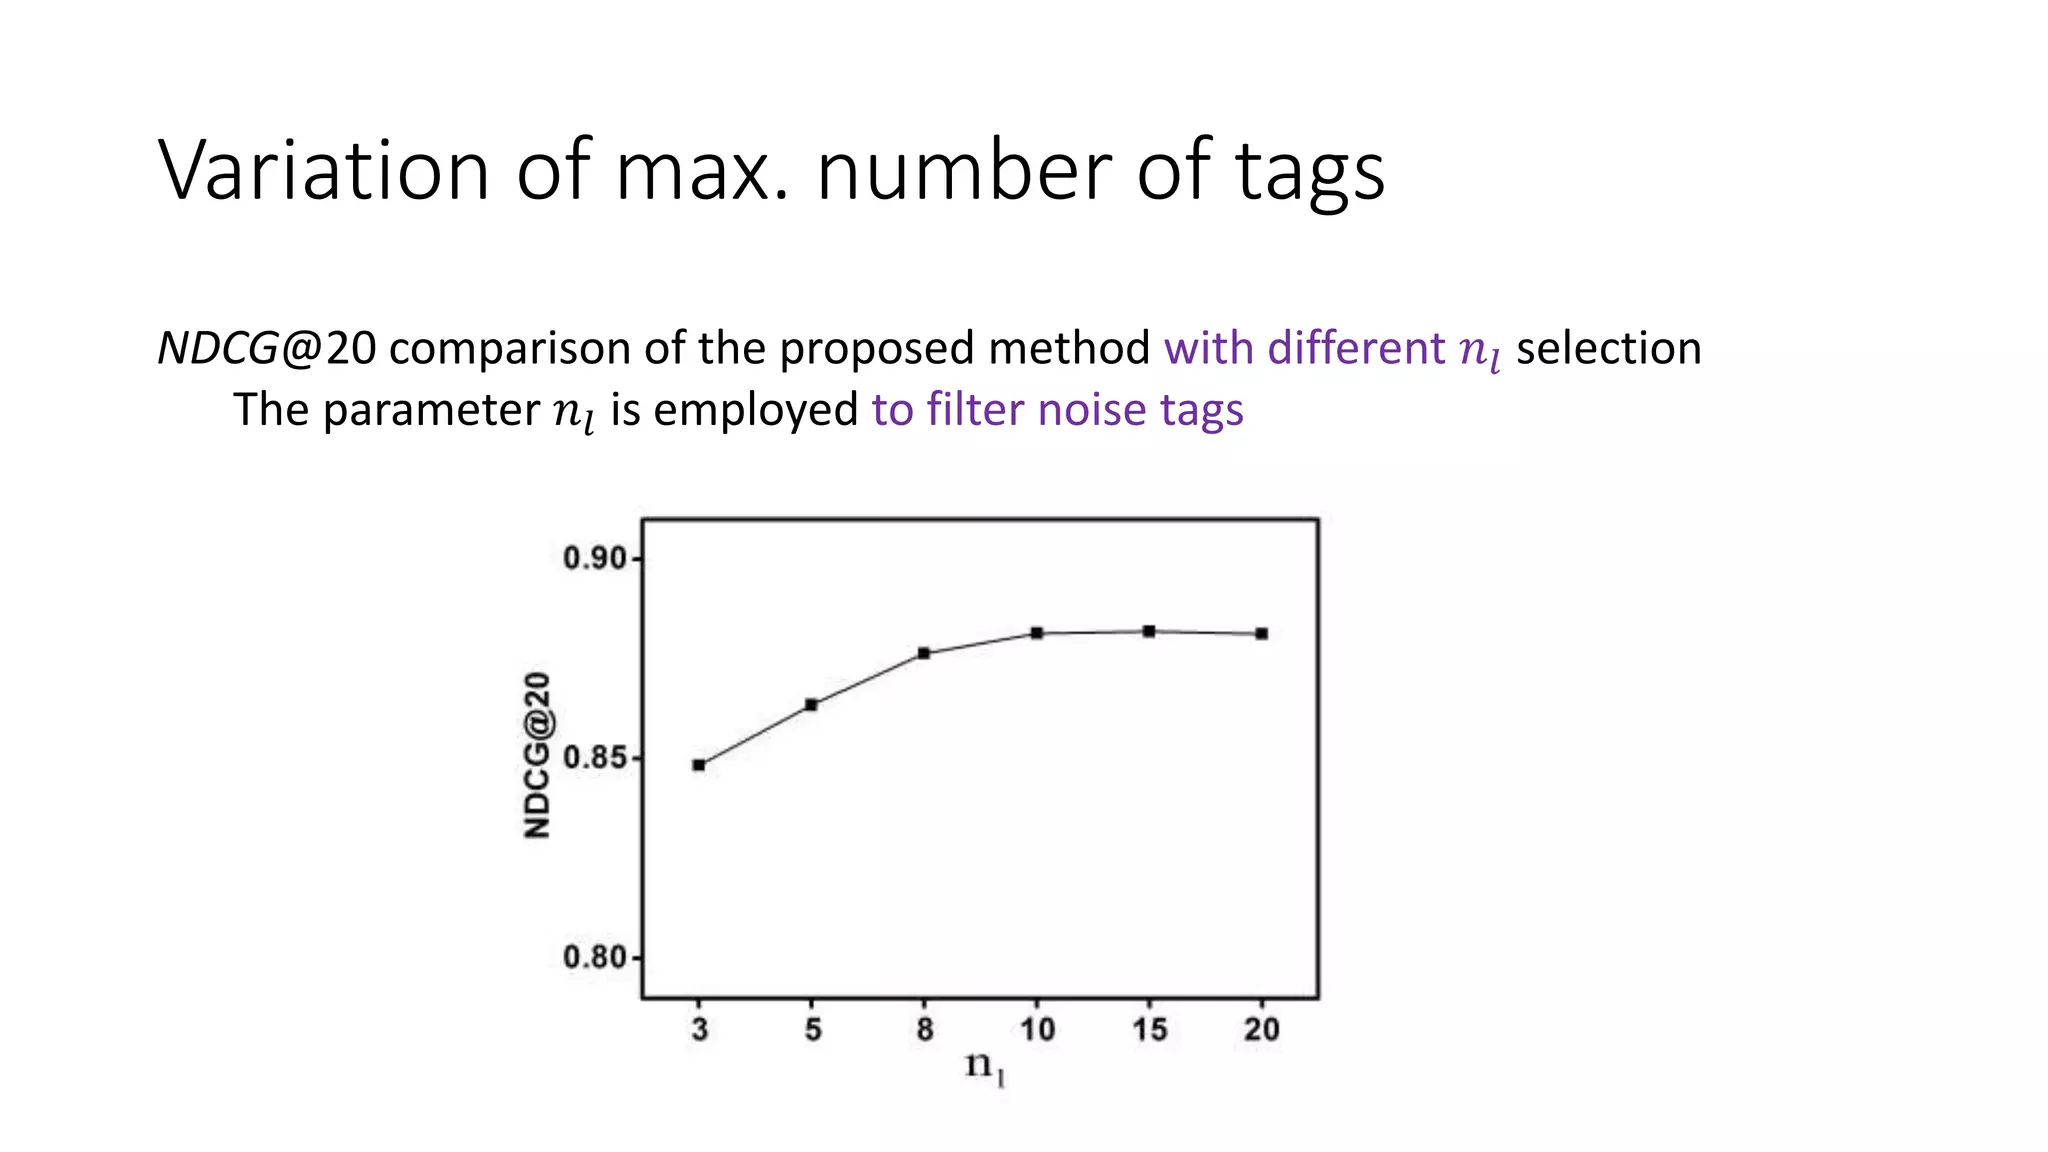
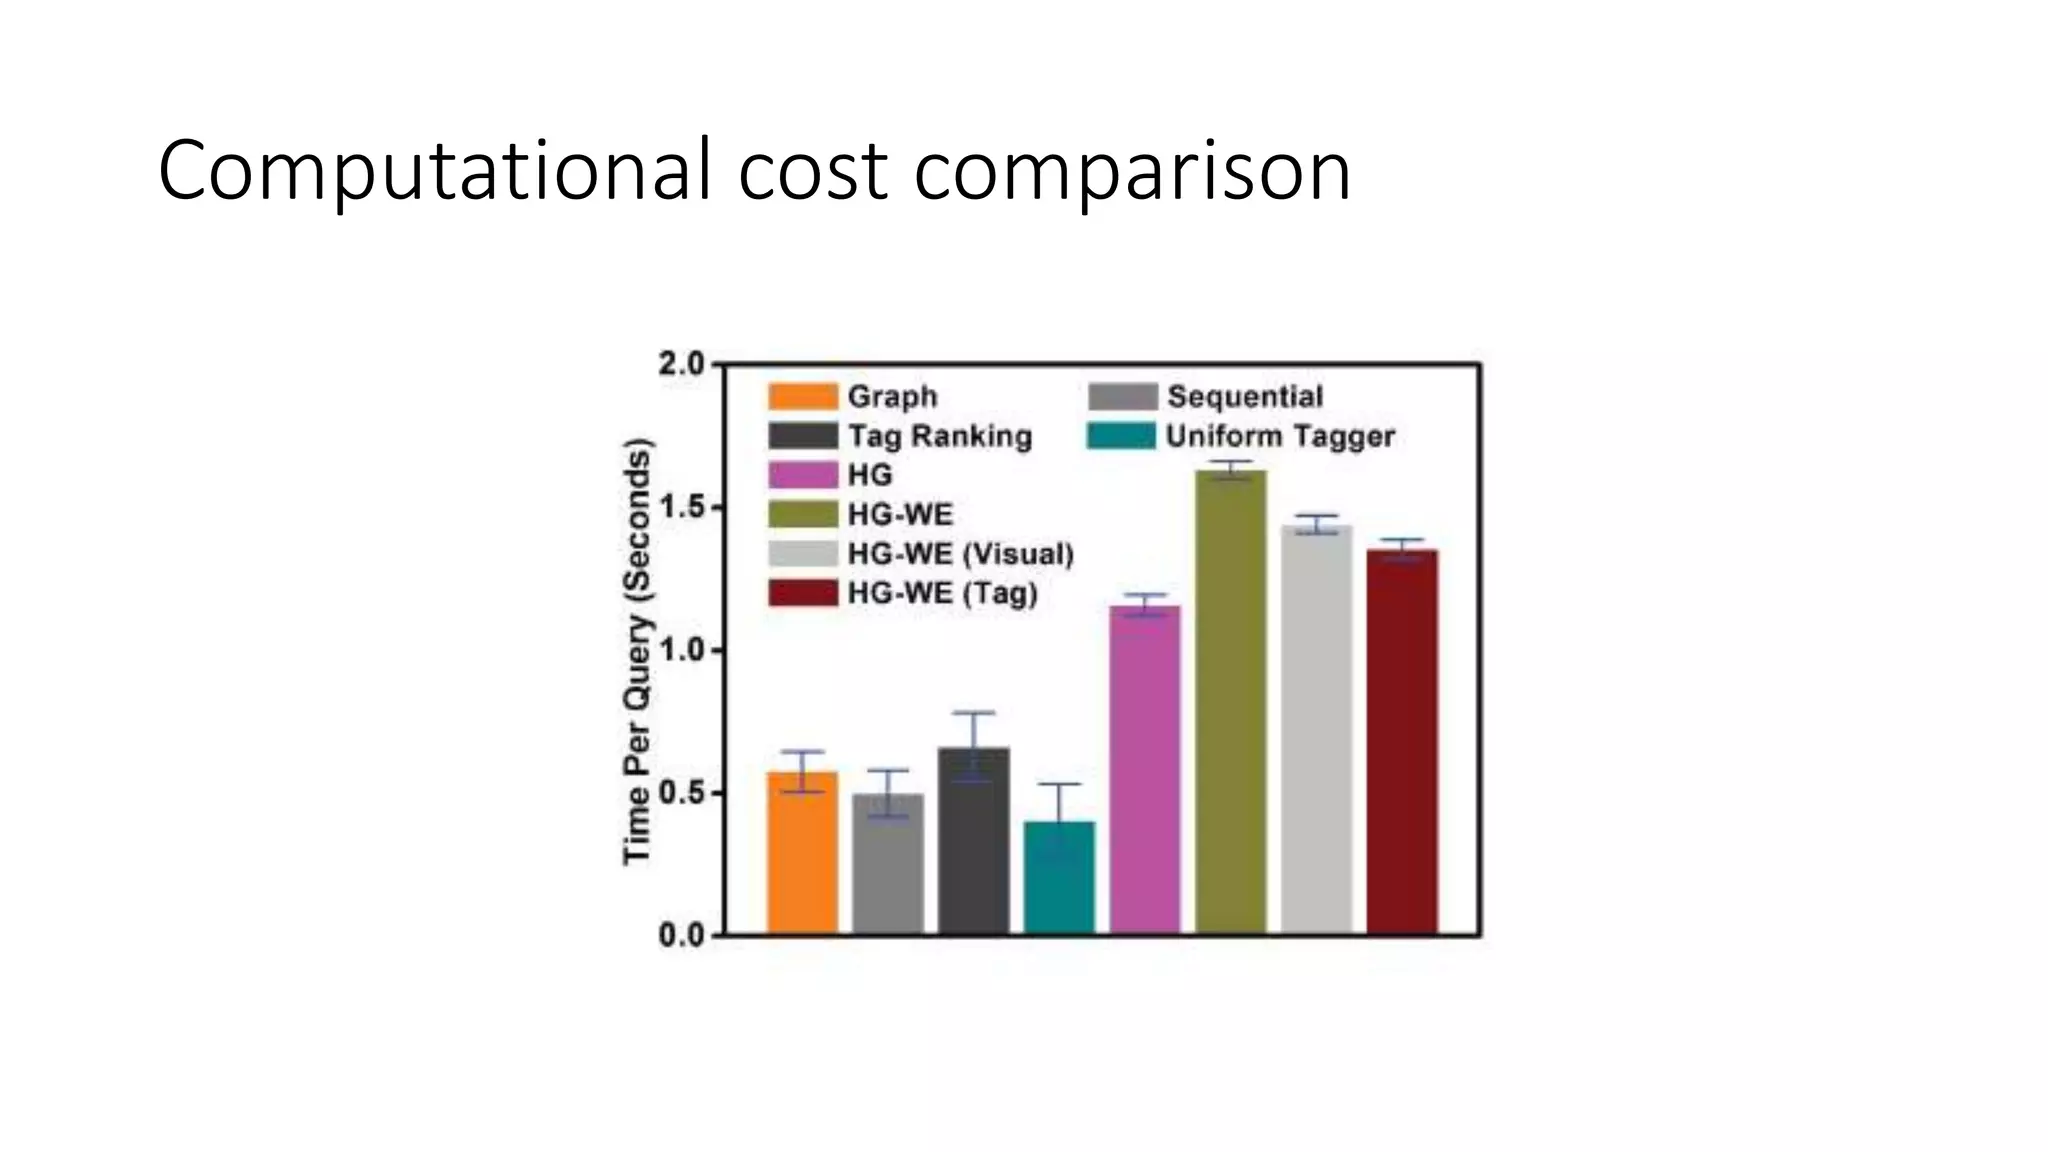
Visual-Textual Joint Relevance Learning
for Tag-Based Social Image Search
Yue Gao, Meng Wang, Zheng-Jun Zha, Jialie Shen, Xuelong Li, Xindong Wu
IEEE TRANSACTIONS ON IMAGE PROCESSING, 2013
Introduction
Tag-based social image search
• Social media data (Flickr, Youtube, etc.)
• Associated with user generated tags, meta information (date, location, etc.)
• Conventional tag-based social image search
• Too much noise in tags
• Lacks an optimal ranking strategy (e.g. Flickr – time-based ranking,
interestingness-based ranking)
• Existing relevance-based ranking method
• explore visual content and tags separately or sequentially
Proposed schema
• a hypergraph-based approach to simultaneously utilize visual information and tags
Vertex: social image
Hyperedge: visual word / tag
Learn the weights(importance of different visual
words and tags)
Relevance scores of images
Related works
Social image search
• Separated Methods
• Only the textual content or the
visual content is employed for
tag analysis
• The useful information is
missing
Social image search
• Sequential Methods
• The visual content and the tags
are sequentially employed for
image search
• The correlation among visual
content and tags are separated
Social image search
Joint method
Hypergraph learning
• Hypergraph is generalization of graph in which an edge can connect
to multiple vertices
• Used for data mining and information retrieval task
• Effective in capturing higher-order relationship
Hypergraph analysis
Definition
Image from Wikipedia
• Vertex set 𝒱 = {𝑣1, 𝑣2, 𝑣3, 𝑣4, 𝑣5, 𝑣6, 𝑣7}
• Hyperedge set ℰ = 𝑒1, 𝑒2, 𝑒3, 𝑒4 =
{ 𝑣1, 𝑣2, 𝑣3 , 𝑣2, 𝑣3 , 𝑣3, 𝑣5, 𝑣6 , 𝑣4 }
• Hyperedge is able to link more than two
vertices.
• Edge weight set 𝓌
Hypergraph 𝒢 = (𝒱, ℰ, 𝓌)
Hypergraph analysis
• Learning with hypergraphs
• Binary classification with hypergraph
• Normalized Laplacian method is formulated as a regularization framework
𝑎𝑟𝑔𝑚𝑖𝑛 𝑓{𝜆𝑅 𝑒𝑚𝑝 𝑓 + Ω(𝑓)}
Regularizer
Empirical loss
Weighting parameter
To-be-learned classification function
Visual-textual
joint relevance learning
Hypergraph construction
• Vertex construction
• Vertices : Social image set
• The number of vertices in
Hypergraph is equals to the
number of images in the image
dataset.
Hypergraph construction
• Hyperedge construction
• Feature 1. visual contents
• Bag of Visual Words
• Extracts local SIFT descriptors for
each images
• Trains visual vocabularies with
descriptors
• 𝑓𝑖
𝑏𝑜𝑤
𝑘, 1 =
1
0
if i-th image has k-th visual word
otherwise
Hypergraph construction
• Hyperedge construction
• Feature 2. Textual information
• Bag of Textual Words
• Tags in each image are ranked by
TagRanking
• For further processing, top 𝑛𝑙 tags
for each image are left
• For further hyperedge construction,
the total number of tags with the
highest TF-IDF are left in the
database
• 𝑓𝑖
𝑡𝑎𝑔
𝑘, 1 =
1
0
if i-th image has k-th tag
otherwise
Hypergraph construction
• Hyperedge construction
• If selected two images contain the
same visual word, they are
connected with the hyperedge.
• If selected two images contain the
same tag, they are connected with
the hyperedge.
• If 𝑓𝑖
𝑏𝑜𝑤
𝑘, 1 = 𝑓𝑗
𝑏𝑜𝑤
𝑘, 1 = 1, 𝑖 and 𝑗 is connected.
• If 𝑓𝑖
𝑡𝑎𝑔
𝑘, 1 = 𝑓𝑗
𝑡𝑎𝑔
𝑘, 1 = 1, 𝑖 and 𝑗 is connected.
𝑛 𝑐 visual content based hyperedges
𝑛 𝑡 tag-based hyperedges
𝑛 𝑐 + 𝑛 𝑡 hyperedges
in total
Hypergraph construction
Example of textual hyperedge construction Example of visual hyperedge construction
Example of the connection between two images
Social image relevance learning
• Social image search task
• Binary classification problem
• Measure the relevance score among all vertices in hypergraph
• Transductivie inference is also formulated as a regularization framework
• Object Function
• 𝑎𝑟𝑔𝑚𝑖𝑛 𝑓,𝜔{Ω 𝑓 + 𝜆𝑅 𝑒𝑚𝑝 𝑓 + 𝜇Ψ(𝜔)}
• Regularizer term indicates that highly related vertices should have close label results
Weight regularizer term
Empirical loss term
Regularizer term
Weight vector
To-be-learned relevance score vector
Social image relevance learning
• Object Function
• 𝑎𝑟𝑔𝑚𝑖𝑛 𝑓,𝜔{Ω 𝑓 + 𝜆𝑅 𝑒𝑚𝑝 𝑓 + 𝜇Ψ(𝜔)}
• Ω 𝑓 = 𝑓 𝑇
Δ𝑓
• 𝑅 𝑒𝑚𝑝 𝑓 = 𝑓 − 𝑦
2
= Σ 𝑢∈𝑉 𝑓 𝑢 − 𝑦 𝑢
2
• guarantees that the new generated labeling results are not far away from the initial label
information
• Ψ 𝜔 = Σ𝑖=1
𝑛 𝑒
𝜔𝑖
2
s.t. Σ𝑖=1
𝑛 𝑒
𝜔𝑖 = 1
• 𝑎𝑟𝑔𝑚𝑖𝑛 𝑓,𝜔Φ 𝑓 = 𝑎𝑟𝑔𝑚𝑖𝑛 𝑓{𝑓 𝑇Δ𝑓+ 𝜆 𝑓 − 𝑦
2
+ 𝜇Σ𝑖=1
𝑛 𝑒
𝜔𝑖
2
} s.t. Σ𝑖=1
𝑛 𝑒
𝜔𝑖 = 1
(Δ: the normalized hypergraph Laplacian)
(y : n × 1 initial label vector)
Optimization
• Alternating optimization strategy
• to-be-learned two variable w and f
we fix one and optimize the other
one each time
• Using the iterative optimization
method, w and f are obtained.
Probabilistic explanation
• Probabilistic perspective
• Deriving the optimal f and w with the maximum posterior probability given
the samples X and the label vector y
𝑓, 𝑤 ∗
= 𝑎𝑟𝑔𝑚𝑎𝑥 𝑝(𝑓, 𝑤|𝑋, 𝑦)
• Equivalent to the object function
𝑎𝑟𝑔𝑚𝑖𝑛 𝑓{𝑓 𝑇
Δ𝑓 + 𝜆 𝑓 − 𝑦
2
+ 𝜇Σ𝑖=1
𝑛 𝑒
𝜔𝑖
2
} s.t. Σ𝑖=1
𝑛 𝑒
𝜔𝑖 = 1
Pseudo-relevant sample selection
• Pseudo-relevant samples
• Associated with the query tag
• Have high relevance probabilities
• They are not far away from result
• Used for noise reduction
Pseudo-relevant sample selection
• Semantic Relevance Measuring
• All the social images that are
associated with the tag are ranked
in descending order
• The top K results are selected as
the pseudo-relevant images
• Semantic similarity
• Flickr Distance between two tags
• Based on a latent topic based
visual language model
𝑠 𝑥𝑖, 𝑡 𝑞 =
1
𝑛𝑖
Σ 𝑡∈𝑇 𝑖
𝑠𝑡𝑎𝑔(𝑡 𝑞, 𝑡) 𝑠𝑡𝑎𝑔 𝑡1, 𝑡2 = exp(−𝐹𝐷(𝑡1, 𝑡2))
Experiments
Experimental settings
• Dataset : Flickr dataset(104,000 images, 83,999 tags) + NUS-WIDE (370K+ images)
• Labeling : three relevance levels : very relevant(2), relevant(1) and irrelevant(0)
• Compared algorithms
• Graph based semi supervised learning (Graph)
• Sequential social image relevance learning (Sequential)
• Tag ranking (TagRanking)
• Tag relevance combination (Uniform Tagger)
• Hypergraph based relevance learning (HG)
• HG + hyperedge weight estimation (HG+WE)
• HG + WE (visual contents only)
• HG + WE (textual contents only)
• Performance evaluation metric
• Normalised Discounted Cumulative Gain (NDCG)
The NDCG@20 Results of different methods
0.8814 0.8578 0.8463
0.7418
0.6281
0.5994 0.5778 0.5727
0
0.1
0.2
0.3
0.4
0.5
0.6
0.7
0.8
0.9
1
The Average NDCG@20 Results
Average NDCG@k comparison
• This approach consistently
outperforms the other methods
Depth for NDCG
• Top results obtained by different
methods for the query weapon.
• the final ranking list can preserve
images from all different
meanings
• Top results obtained by different
methods for the query apple.
• the proposed method can return
relevant results with different
meanings
The effects of hyperedge weight learning
Top 100 visual words
with the highest weights
after the hypergraph
learning process
The effects of hyperedge weight learning
Ten tags with the highest
weights after the
hypergraph learning
process for the queries (a)
car and (b) weapon.
Variation of weighting parameters
Average NDCG@20 performance curves with respect to the variation of λ and μ.
Variation of dictionary size
NDCG@20 comparison of the proposed method with different sizes
of the tag and visual word dictionaries, i.e., 𝑛 𝑐 and 𝑛 𝑡.
Variation of max. number of tags
NDCG@20 comparison of the proposed method with different 𝑛𝑙 selection
The parameter 𝑛𝑙 is employed to filter noise tags
Computational cost comparison
Conclusion
Conclusion
• Proposal : joint utilization of both visual contents and tags by
hypergraph and relevance learning procedure for social image search.
• Consideration of weights of hyperedges
• Differ from previous hypergraph learning algorithms
• Minimizes the effects of uninformative features
• Future work
• Diversity of search results : Next issue
Thank you !
Q&A

Visual-Textual Joint Relevance Learning for Tag-Based Social Image Search

  • 1.
    Visual-Textual Joint RelevanceLearning for Tag-Based Social Image Search Yue Gao, Meng Wang, Zheng-Jun Zha, Jialie Shen, Xuelong Li, Xindong Wu IEEE TRANSACTIONS ON IMAGE PROCESSING, 2013
  • 2.
  • 3.
    Tag-based social imagesearch • Social media data (Flickr, Youtube, etc.) • Associated with user generated tags, meta information (date, location, etc.) • Conventional tag-based social image search • Too much noise in tags • Lacks an optimal ranking strategy (e.g. Flickr – time-based ranking, interestingness-based ranking) • Existing relevance-based ranking method • explore visual content and tags separately or sequentially
  • 4.
    Proposed schema • ahypergraph-based approach to simultaneously utilize visual information and tags Vertex: social image Hyperedge: visual word / tag Learn the weights(importance of different visual words and tags) Relevance scores of images
  • 5.
  • 6.
    Social image search •Separated Methods • Only the textual content or the visual content is employed for tag analysis • The useful information is missing
  • 7.
    Social image search •Sequential Methods • The visual content and the tags are sequentially employed for image search • The correlation among visual content and tags are separated
  • 8.
  • 9.
    Hypergraph learning • Hypergraphis generalization of graph in which an edge can connect to multiple vertices • Used for data mining and information retrieval task • Effective in capturing higher-order relationship
  • 10.
  • 11.
    Definition Image from Wikipedia •Vertex set 𝒱 = {𝑣1, 𝑣2, 𝑣3, 𝑣4, 𝑣5, 𝑣6, 𝑣7} • Hyperedge set ℰ = 𝑒1, 𝑒2, 𝑒3, 𝑒4 = { 𝑣1, 𝑣2, 𝑣3 , 𝑣2, 𝑣3 , 𝑣3, 𝑣5, 𝑣6 , 𝑣4 } • Hyperedge is able to link more than two vertices. • Edge weight set 𝓌 Hypergraph 𝒢 = (𝒱, ℰ, 𝓌)
  • 12.
    Hypergraph analysis • Learningwith hypergraphs • Binary classification with hypergraph • Normalized Laplacian method is formulated as a regularization framework 𝑎𝑟𝑔𝑚𝑖𝑛 𝑓{𝜆𝑅 𝑒𝑚𝑝 𝑓 + Ω(𝑓)} Regularizer Empirical loss Weighting parameter To-be-learned classification function
  • 13.
  • 14.
    Hypergraph construction • Vertexconstruction • Vertices : Social image set • The number of vertices in Hypergraph is equals to the number of images in the image dataset.
  • 15.
    Hypergraph construction • Hyperedgeconstruction • Feature 1. visual contents • Bag of Visual Words • Extracts local SIFT descriptors for each images • Trains visual vocabularies with descriptors • 𝑓𝑖 𝑏𝑜𝑤 𝑘, 1 = 1 0 if i-th image has k-th visual word otherwise
  • 16.
    Hypergraph construction • Hyperedgeconstruction • Feature 2. Textual information • Bag of Textual Words • Tags in each image are ranked by TagRanking • For further processing, top 𝑛𝑙 tags for each image are left • For further hyperedge construction, the total number of tags with the highest TF-IDF are left in the database • 𝑓𝑖 𝑡𝑎𝑔 𝑘, 1 = 1 0 if i-th image has k-th tag otherwise
  • 17.
    Hypergraph construction • Hyperedgeconstruction • If selected two images contain the same visual word, they are connected with the hyperedge. • If selected two images contain the same tag, they are connected with the hyperedge. • If 𝑓𝑖 𝑏𝑜𝑤 𝑘, 1 = 𝑓𝑗 𝑏𝑜𝑤 𝑘, 1 = 1, 𝑖 and 𝑗 is connected. • If 𝑓𝑖 𝑡𝑎𝑔 𝑘, 1 = 𝑓𝑗 𝑡𝑎𝑔 𝑘, 1 = 1, 𝑖 and 𝑗 is connected. 𝑛 𝑐 visual content based hyperedges 𝑛 𝑡 tag-based hyperedges 𝑛 𝑐 + 𝑛 𝑡 hyperedges in total
  • 18.
    Hypergraph construction Example oftextual hyperedge construction Example of visual hyperedge construction
  • 19.
    Example of theconnection between two images
  • 20.
    Social image relevancelearning • Social image search task • Binary classification problem • Measure the relevance score among all vertices in hypergraph • Transductivie inference is also formulated as a regularization framework • Object Function • 𝑎𝑟𝑔𝑚𝑖𝑛 𝑓,𝜔{Ω 𝑓 + 𝜆𝑅 𝑒𝑚𝑝 𝑓 + 𝜇Ψ(𝜔)} • Regularizer term indicates that highly related vertices should have close label results Weight regularizer term Empirical loss term Regularizer term Weight vector To-be-learned relevance score vector
  • 21.
    Social image relevancelearning • Object Function • 𝑎𝑟𝑔𝑚𝑖𝑛 𝑓,𝜔{Ω 𝑓 + 𝜆𝑅 𝑒𝑚𝑝 𝑓 + 𝜇Ψ(𝜔)} • Ω 𝑓 = 𝑓 𝑇 Δ𝑓 • 𝑅 𝑒𝑚𝑝 𝑓 = 𝑓 − 𝑦 2 = Σ 𝑢∈𝑉 𝑓 𝑢 − 𝑦 𝑢 2 • guarantees that the new generated labeling results are not far away from the initial label information • Ψ 𝜔 = Σ𝑖=1 𝑛 𝑒 𝜔𝑖 2 s.t. Σ𝑖=1 𝑛 𝑒 𝜔𝑖 = 1 • 𝑎𝑟𝑔𝑚𝑖𝑛 𝑓,𝜔Φ 𝑓 = 𝑎𝑟𝑔𝑚𝑖𝑛 𝑓{𝑓 𝑇Δ𝑓+ 𝜆 𝑓 − 𝑦 2 + 𝜇Σ𝑖=1 𝑛 𝑒 𝜔𝑖 2 } s.t. Σ𝑖=1 𝑛 𝑒 𝜔𝑖 = 1 (Δ: the normalized hypergraph Laplacian) (y : n × 1 initial label vector)
  • 22.
    Optimization • Alternating optimizationstrategy • to-be-learned two variable w and f we fix one and optimize the other one each time • Using the iterative optimization method, w and f are obtained.
  • 23.
    Probabilistic explanation • Probabilisticperspective • Deriving the optimal f and w with the maximum posterior probability given the samples X and the label vector y 𝑓, 𝑤 ∗ = 𝑎𝑟𝑔𝑚𝑎𝑥 𝑝(𝑓, 𝑤|𝑋, 𝑦) • Equivalent to the object function 𝑎𝑟𝑔𝑚𝑖𝑛 𝑓{𝑓 𝑇 Δ𝑓 + 𝜆 𝑓 − 𝑦 2 + 𝜇Σ𝑖=1 𝑛 𝑒 𝜔𝑖 2 } s.t. Σ𝑖=1 𝑛 𝑒 𝜔𝑖 = 1
  • 24.
    Pseudo-relevant sample selection •Pseudo-relevant samples • Associated with the query tag • Have high relevance probabilities • They are not far away from result • Used for noise reduction
  • 25.
    Pseudo-relevant sample selection •Semantic Relevance Measuring • All the social images that are associated with the tag are ranked in descending order • The top K results are selected as the pseudo-relevant images • Semantic similarity • Flickr Distance between two tags • Based on a latent topic based visual language model 𝑠 𝑥𝑖, 𝑡 𝑞 = 1 𝑛𝑖 Σ 𝑡∈𝑇 𝑖 𝑠𝑡𝑎𝑔(𝑡 𝑞, 𝑡) 𝑠𝑡𝑎𝑔 𝑡1, 𝑡2 = exp(−𝐹𝐷(𝑡1, 𝑡2))
  • 26.
  • 27.
    Experimental settings • Dataset: Flickr dataset(104,000 images, 83,999 tags) + NUS-WIDE (370K+ images) • Labeling : three relevance levels : very relevant(2), relevant(1) and irrelevant(0) • Compared algorithms • Graph based semi supervised learning (Graph) • Sequential social image relevance learning (Sequential) • Tag ranking (TagRanking) • Tag relevance combination (Uniform Tagger) • Hypergraph based relevance learning (HG) • HG + hyperedge weight estimation (HG+WE) • HG + WE (visual contents only) • HG + WE (textual contents only) • Performance evaluation metric • Normalised Discounted Cumulative Gain (NDCG)
  • 28.
    The NDCG@20 Resultsof different methods 0.8814 0.8578 0.8463 0.7418 0.6281 0.5994 0.5778 0.5727 0 0.1 0.2 0.3 0.4 0.5 0.6 0.7 0.8 0.9 1 The Average NDCG@20 Results
  • 29.
    Average NDCG@k comparison •This approach consistently outperforms the other methods Depth for NDCG
  • 30.
    • Top resultsobtained by different methods for the query weapon. • the final ranking list can preserve images from all different meanings
  • 31.
    • Top resultsobtained by different methods for the query apple. • the proposed method can return relevant results with different meanings
  • 32.
    The effects ofhyperedge weight learning Top 100 visual words with the highest weights after the hypergraph learning process
  • 33.
    The effects ofhyperedge weight learning Ten tags with the highest weights after the hypergraph learning process for the queries (a) car and (b) weapon.
  • 34.
    Variation of weightingparameters Average NDCG@20 performance curves with respect to the variation of λ and μ.
  • 35.
    Variation of dictionarysize NDCG@20 comparison of the proposed method with different sizes of the tag and visual word dictionaries, i.e., 𝑛 𝑐 and 𝑛 𝑡.
  • 36.
    Variation of max.number of tags NDCG@20 comparison of the proposed method with different 𝑛𝑙 selection The parameter 𝑛𝑙 is employed to filter noise tags
  • 37.
  • 38.
  • 39.
    Conclusion • Proposal :joint utilization of both visual contents and tags by hypergraph and relevance learning procedure for social image search. • Consideration of weights of hyperedges • Differ from previous hypergraph learning algorithms • Minimizes the effects of uninformative features • Future work • Diversity of search results : Next issue
  • 40.

Editor's Notes

  • #5 we first identify a set of pseudo relevant samples based on tags. Then, we calculate the relevance scores of images by iteratively updating them and the weights of hyperedges.
  • #8 the tag information is first employed to generate initial relevance scores, and then the visual contents of images are used to refine the scores
  • #9 Different from these two types of methods, we propose a joint method which integrates both the visual content and the tags
  • #13 many machine learning tasks can be performed, i.e. clustering, classification, and ranking
  • #16 Construct hyperedges by using fi bow, where the images i sharing the same visual words are connected by one hyper- edge.
  • #17 Construct hyperedges by using f tag, where the images sharing the same textual words are connected by one hyperedge
  • #20 two social images tend to be connected with more hyperedges if they share a lot of tags or visual words
  • #22 In the constructed hypergraph, all the hyperedges are initialized with an identical weight. performing a weighting or selection on the hyperedges will be helpful 2-norm regularizer on w and then simultaneously optimize w and f . aim to seek optimal results which can minimize the cost function including the loss cost, the hypergraph regularizer and the hypergraph weight regularizer.
  • #23 With the hypergraph edge weight w, the hypergraph structure is optimized for the query. Under this hypergraph structure, f is the optimal to-be-learned relevance score vector for social image search
  • #25 To generate y, we usually need a set of relevant samples. straightforward approach : regard all the images that have the query tag as relevant To reduce the noise, a set of samples are selected which are not associated with the query tag but also have high relevance probabilities pseudo-relevant, The corresponding elements of these images are set to 1, and other elements are 0.
  • #26 In Flickr distance, a group of images are first obtained from Flickr for each tag, and a latent topic based visual language model is built to model the visual characteristic of the tag. The Flickr distance is calculated by using Jensen-Shannon divergence between the two visual language models.
  • #28 Each image is labeled with three relevance levels with respect to the corresponding query: very relevant, relevant and irrelevant For the tags with more than one meaning, the images corresponding to different meanings are all regarded as relevant. (Apple could refer to fruit, mobile phone or computer,) Sequential - initial relevance scores are estimated based on tags, and the scores are then refined with a graph-based learning based on images’ visual content. Tag ranking - initial relevance scores of the tags are estimated, and a random walk process on a tag graph is conducted to refine the relevance scores of tags in each image Tag relevance combination - tag relevance estimates are combined based on the largest entropy assumption. HG - all hyperedge weights are equally treated
  • #29 hypergraph learning is effective in social image modeling. hyperedge weighting method can greatly improve the performance of hypergraph learning. Show the effectiveness of combining visual and tag information
  • #33 enhance the descriptive visual words for a given query
  • #34 also see that they are closely related to the queries
  • #35 its value determines the closeness of f and y our approach is able to outperform the other methods when the two parameters vary in a wide range
  • #36 determine the number of hyperedges When nt increases from 0 to 2000, the image search performance in terms of NDCG@20 becomes better, while the growth speed is slower when nt is larger.
  • #37 When nl is larger than 10, the image search performance is relatively steady which can employ more meaningful tags for further processing and improve the image search performance.
  • #38 we have not taken the visual feature extraction step into consideration HG-WE requires the highest computational cost and also achieves the best retrieval performance.
  • #40 learns not only the relevance scores among images but also the weights of hyperedges. By using the learning of hyperedge weights, the effects of uninformative the proposed method that simultaneously utilizes both the visual content and the textual information achieves better results than that of using them individually.