Download to read offline


![Dataset
• TCGA breast cancer data from Broad Institute GDAC Firehose
– Gene expression data from RNA sequencing - 17,673 genes
– DNA methylation data obtained as a gene-level feature – 17,037 genes
• 465 samples are divided into 218 good group and 247 poor group
– poor group : survival days <= 3 years & vital status = 0
– good group : survival days > 3 years
• Directed pathway graph is given [Liu, et al, 2013]
– Interactions between genes defined from KEGG pathway
– Totally 4,113 genes for each gene profile and 88,440 directed edges in 279
KEGG pathways](https://image.slidesharecdn.com/tbc2017final-180615051937/75/Integrative-Pathway-based-Survival-Prediction-utilizing-the-Interaction-between-Gene-Expression-and-DNA-Methylation-in-Breast-Cancer-19-2048.jpg)
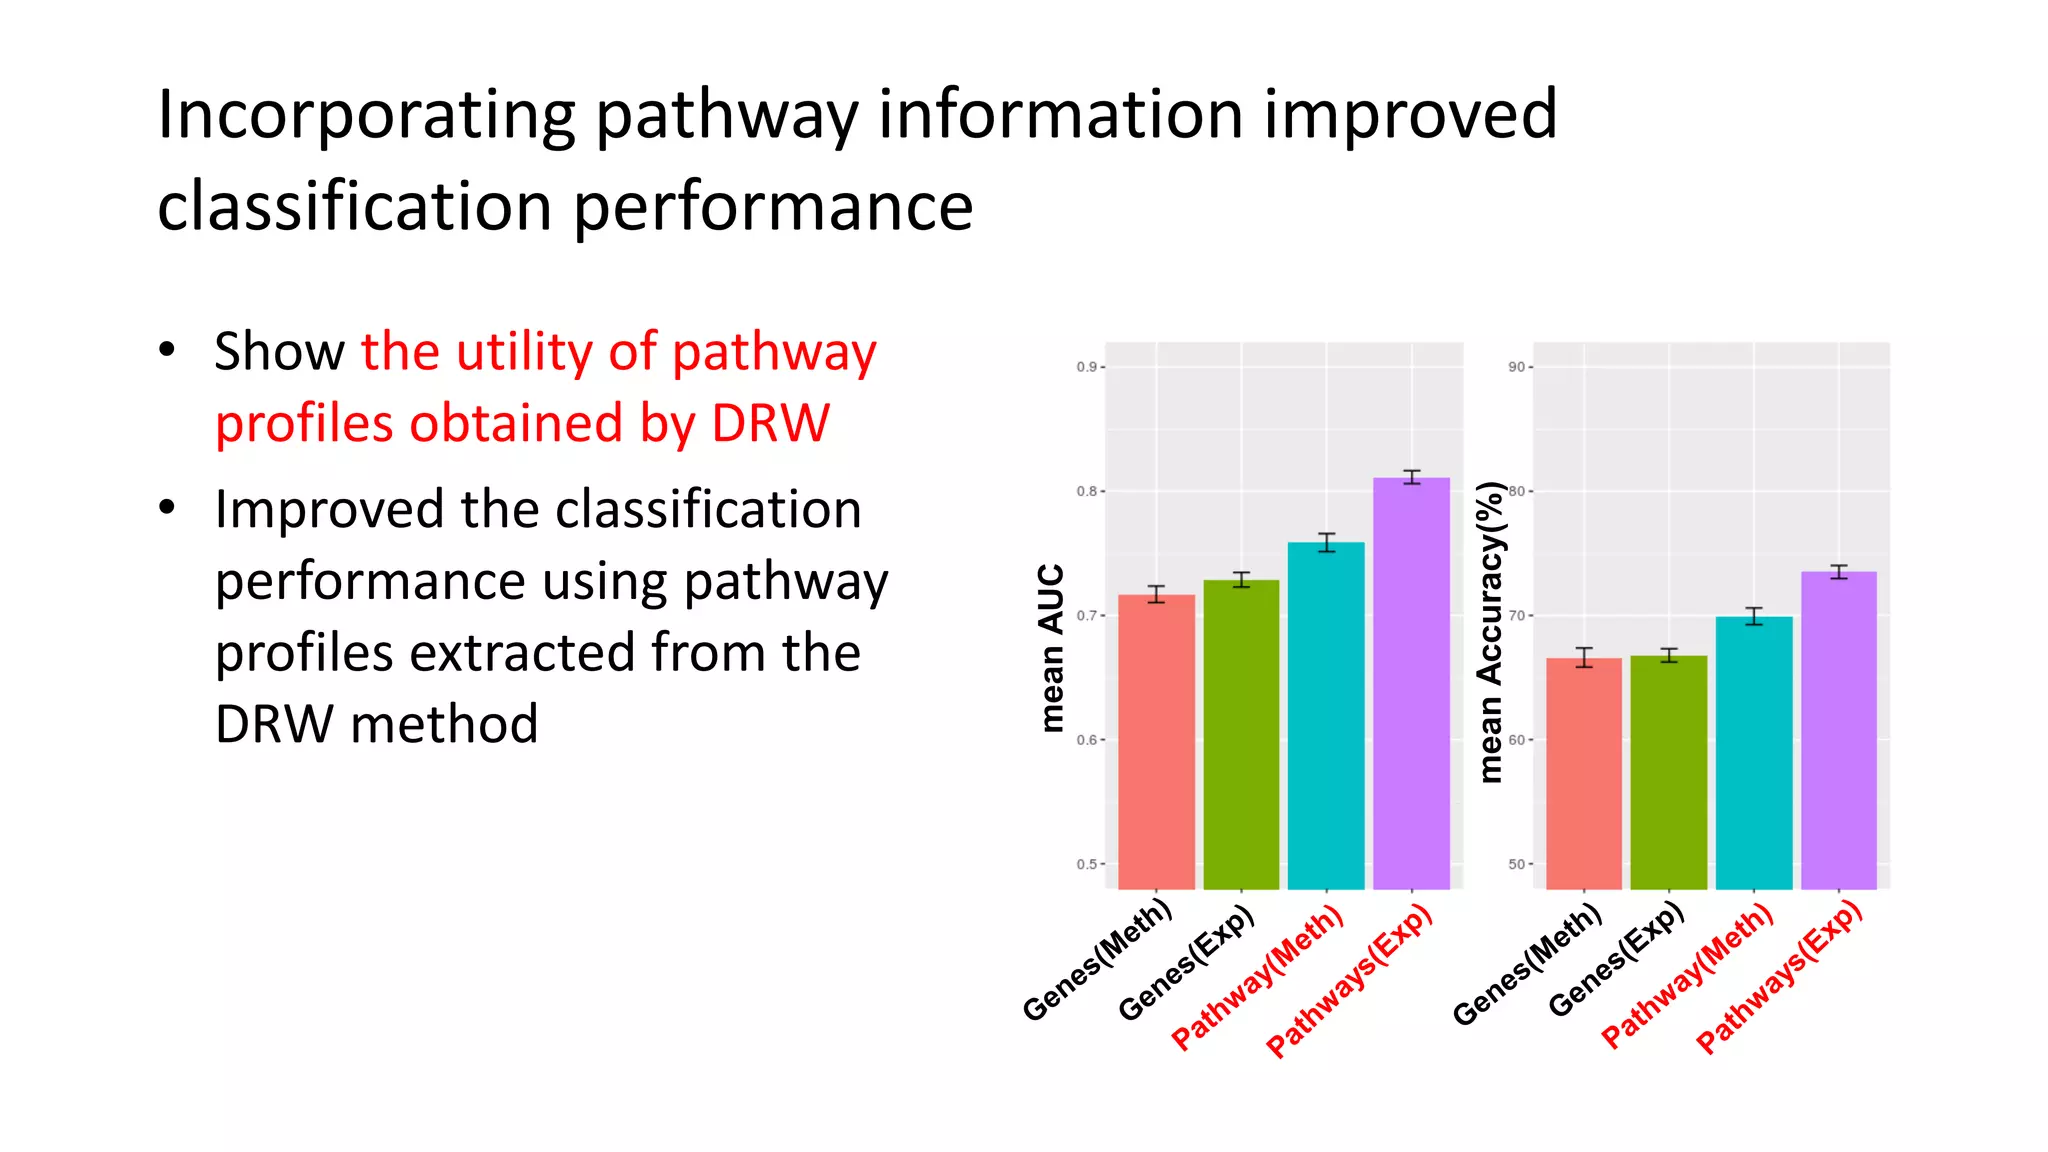
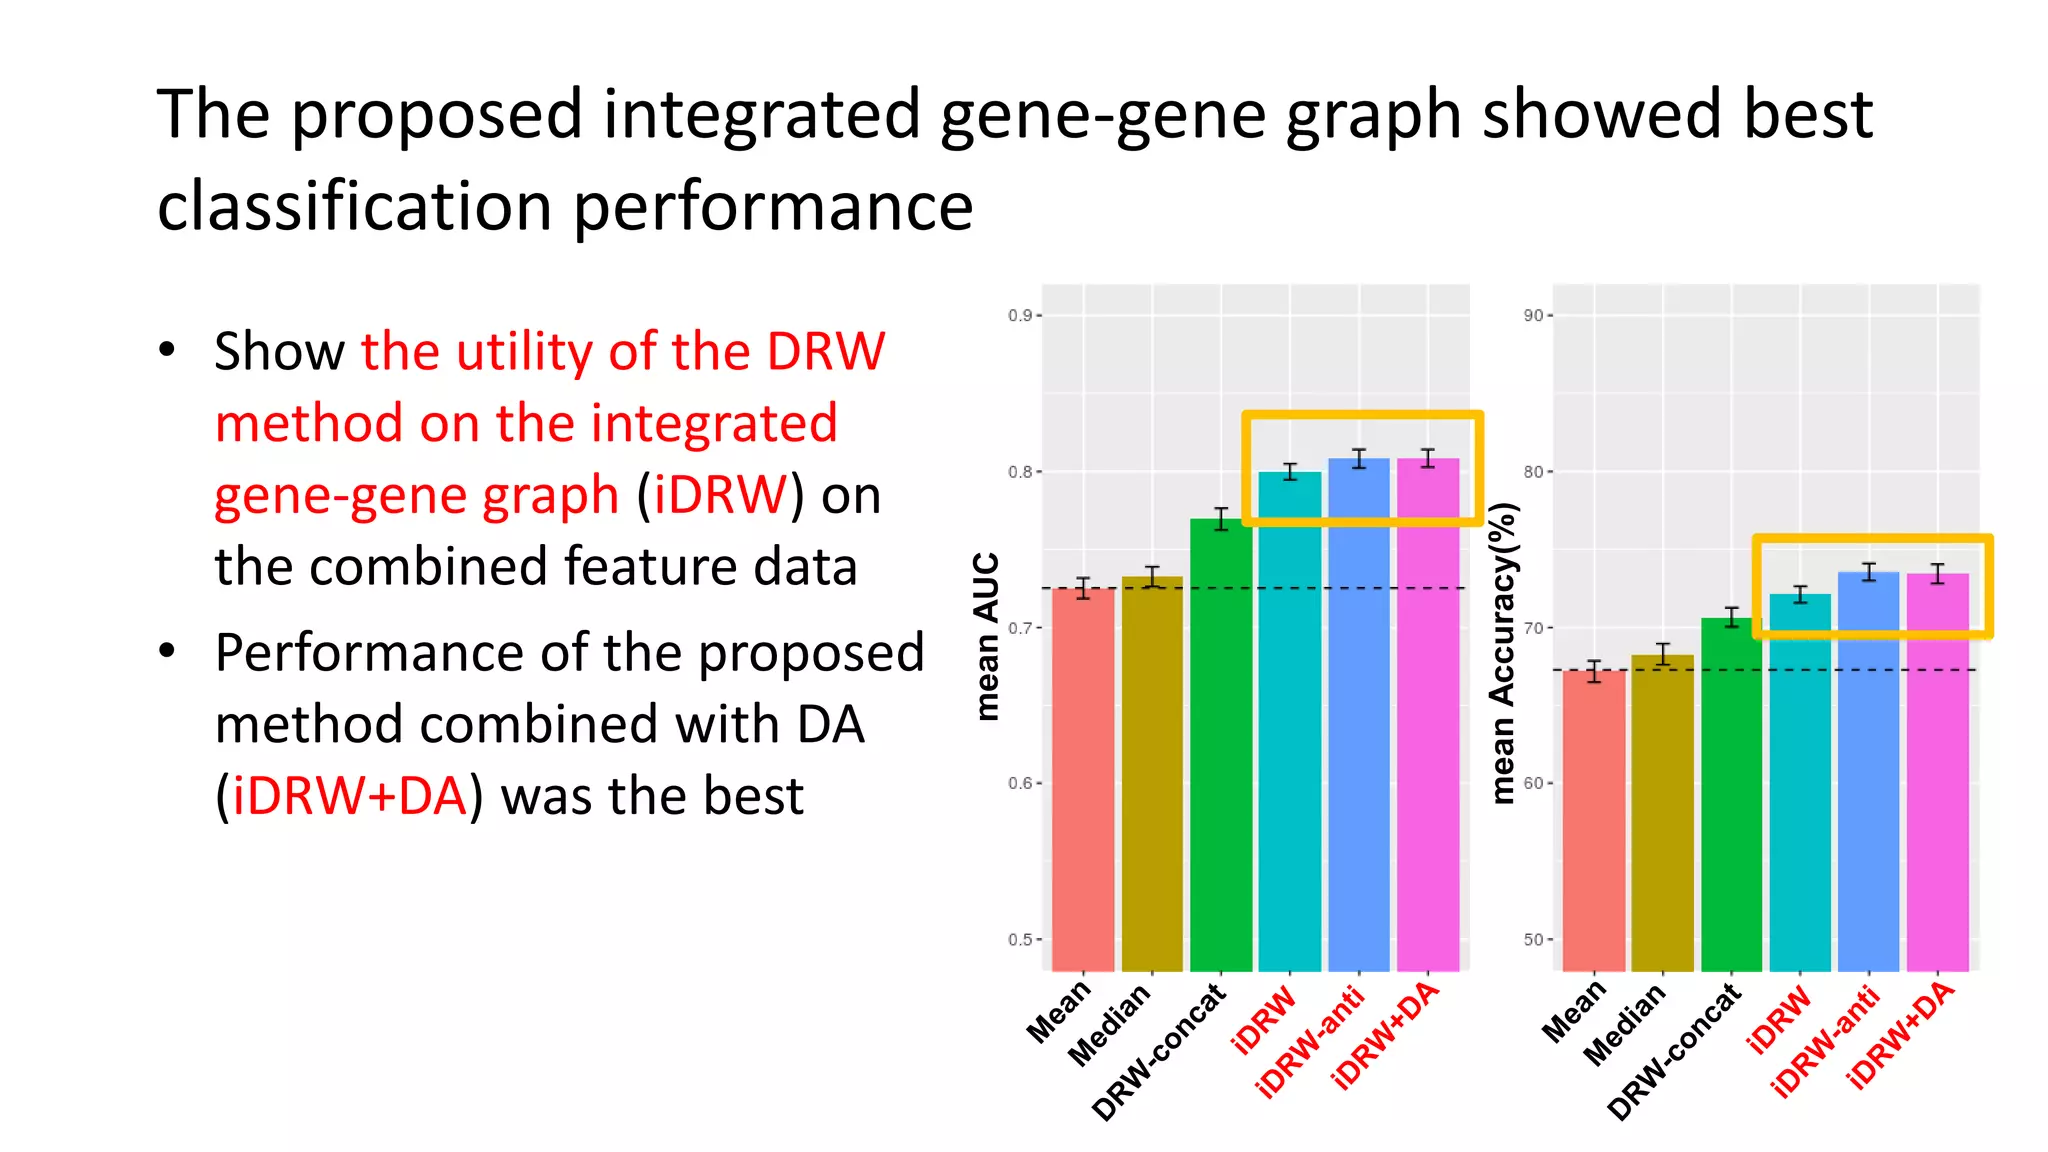
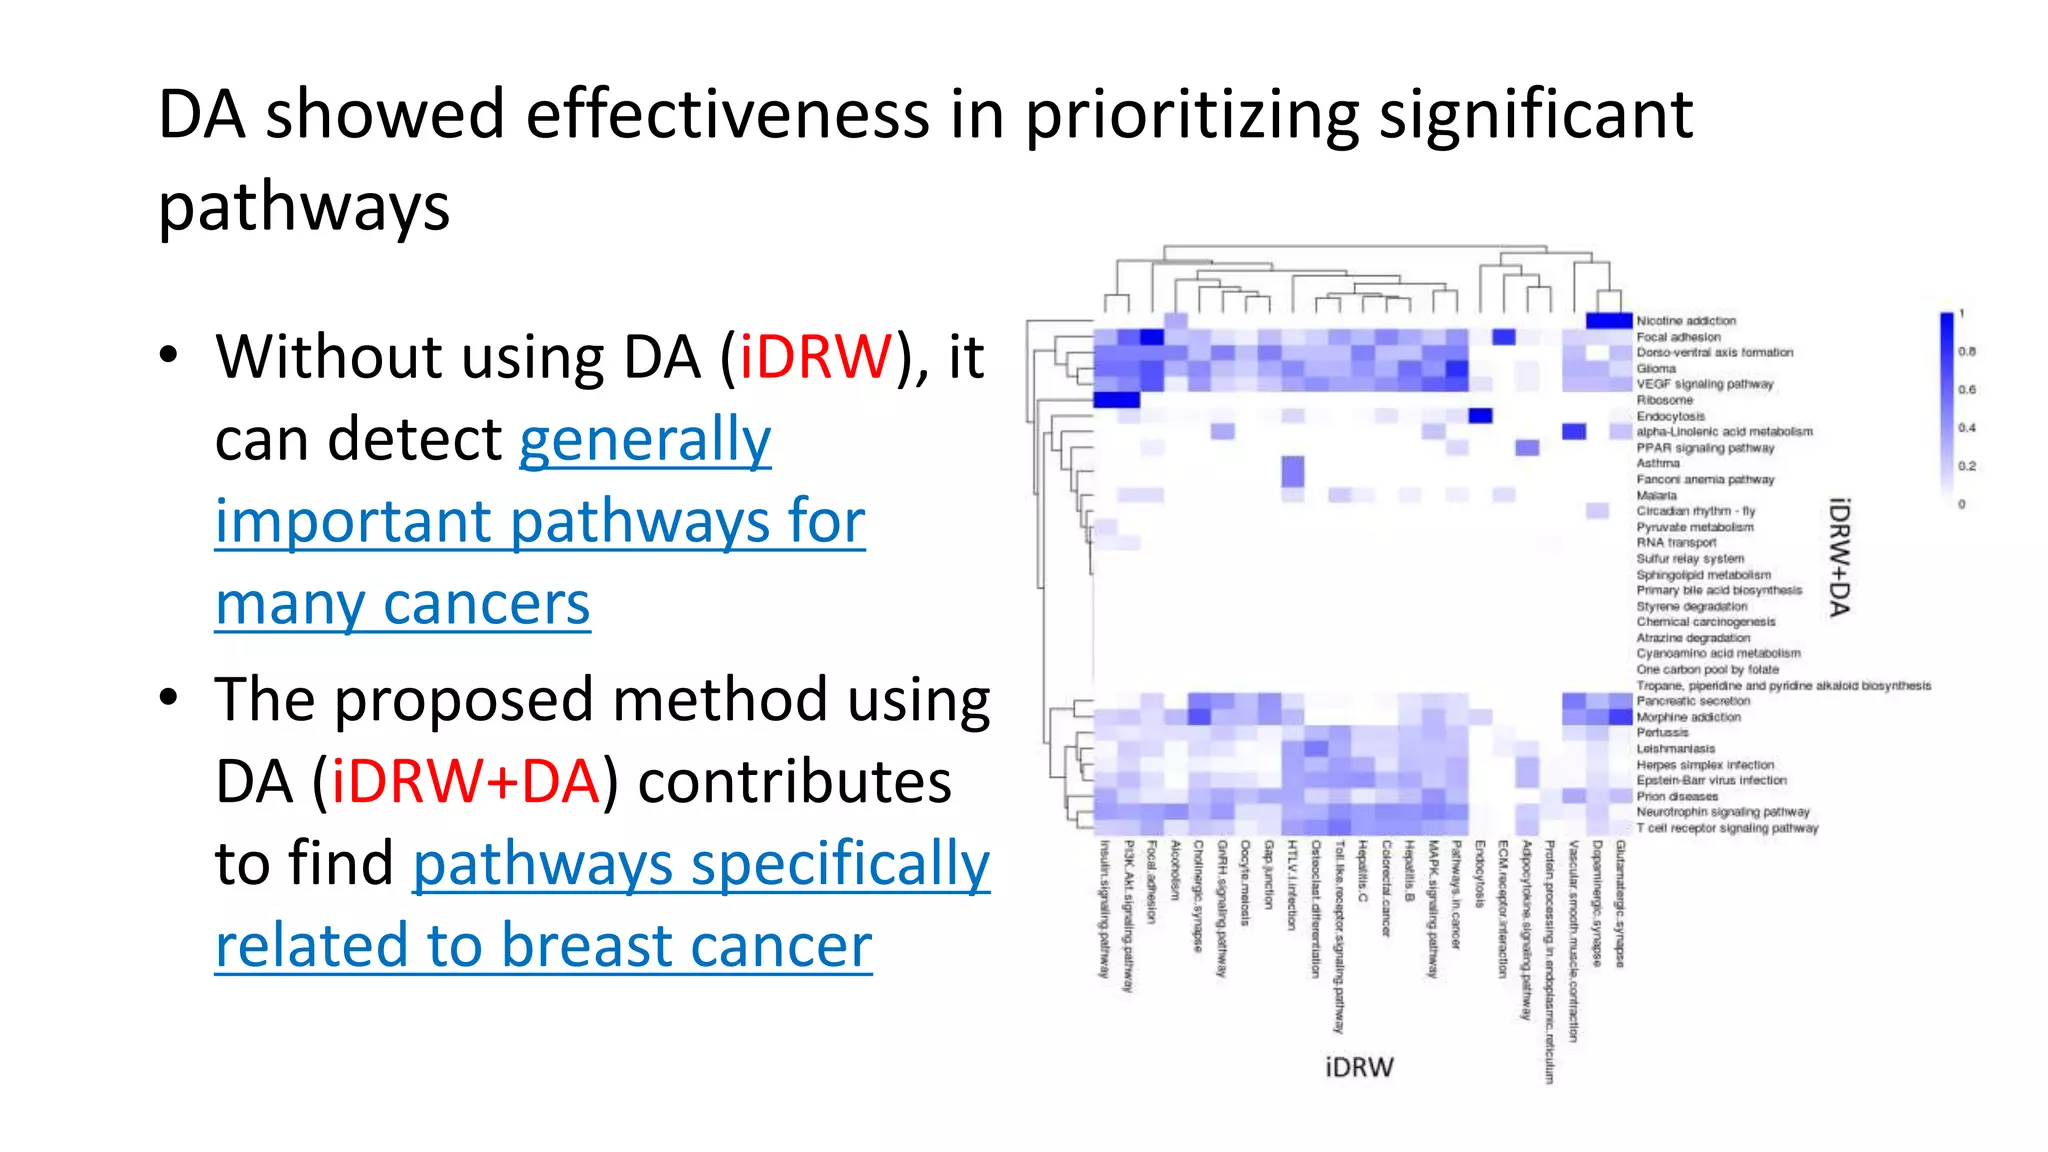

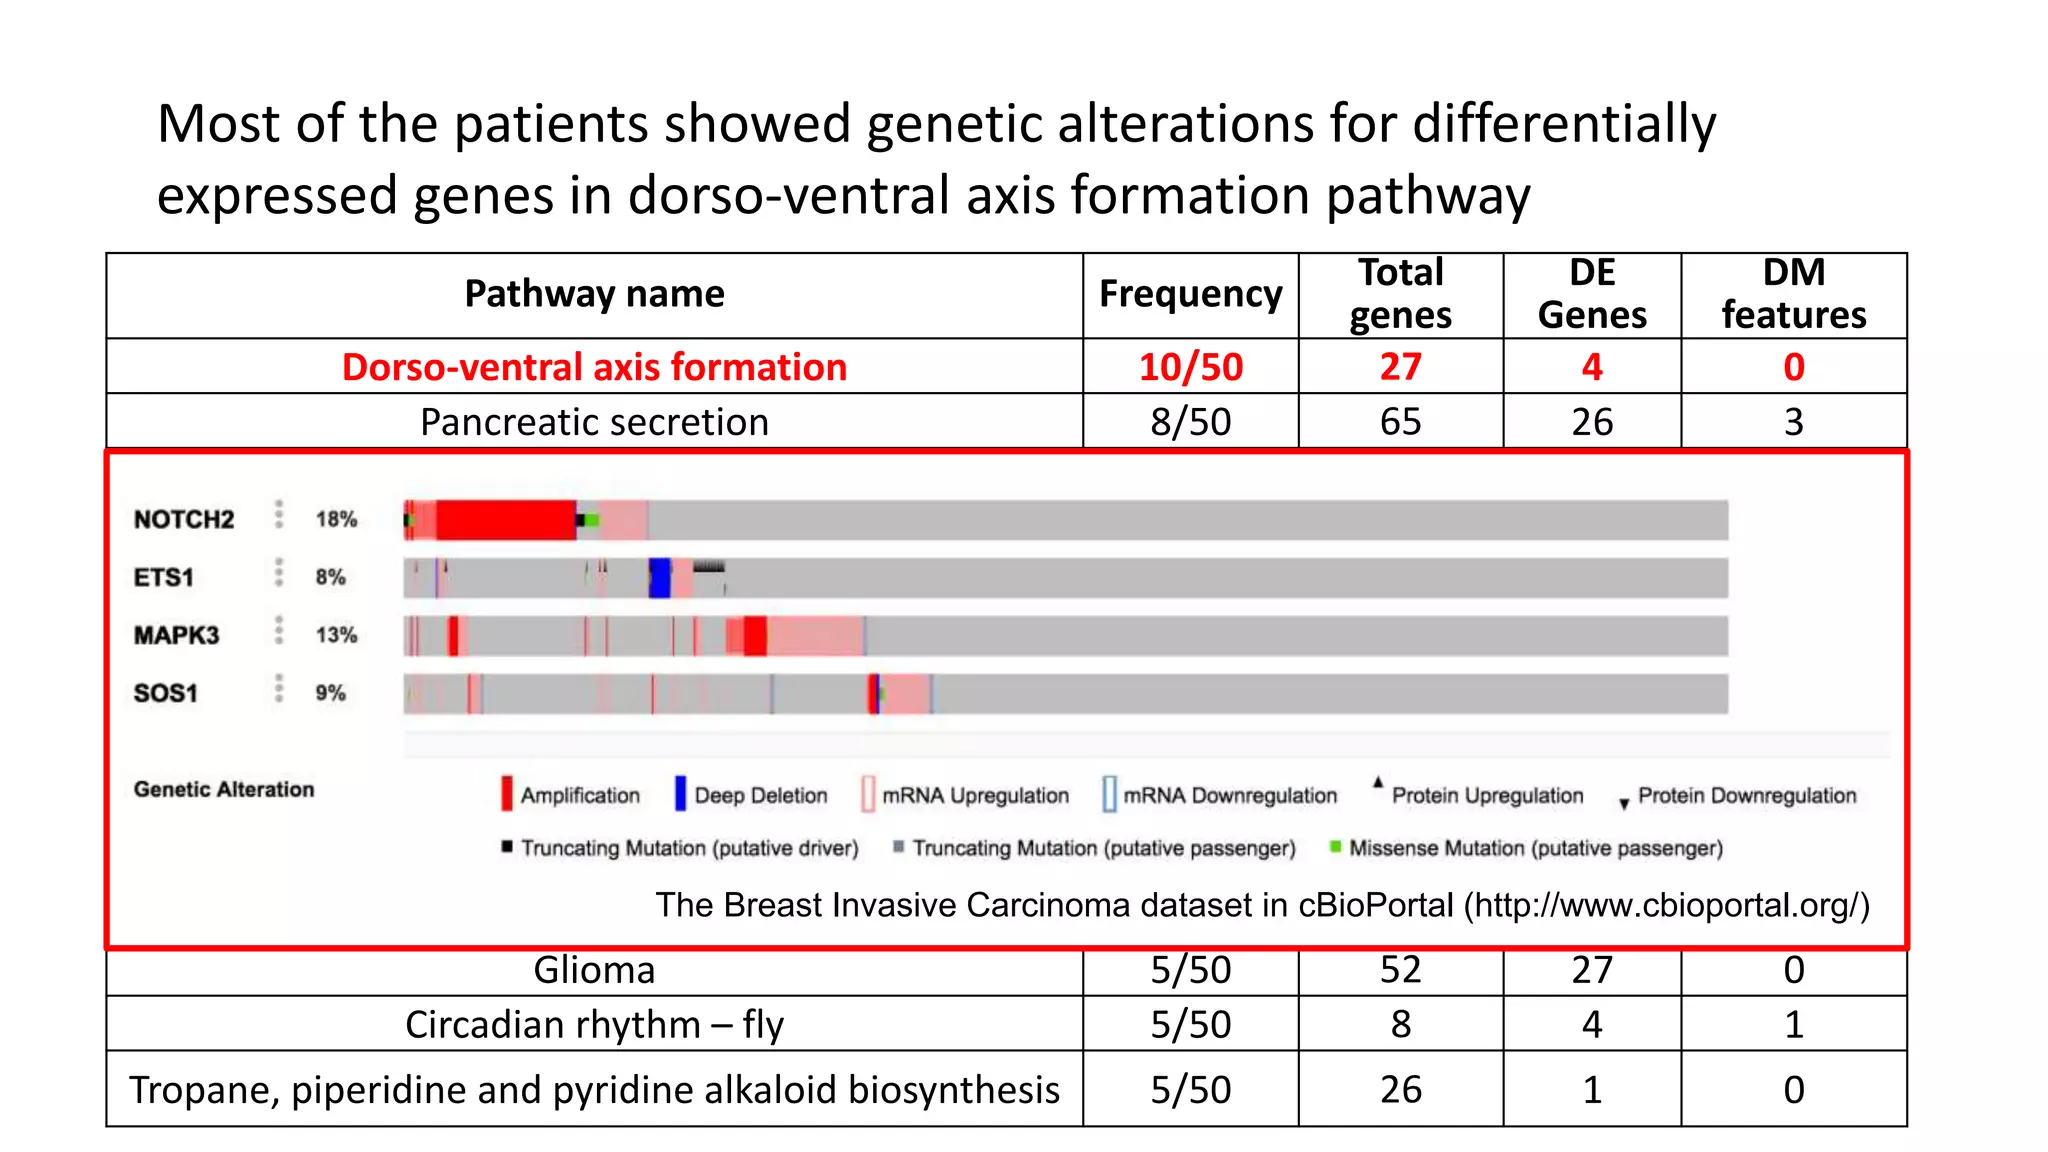
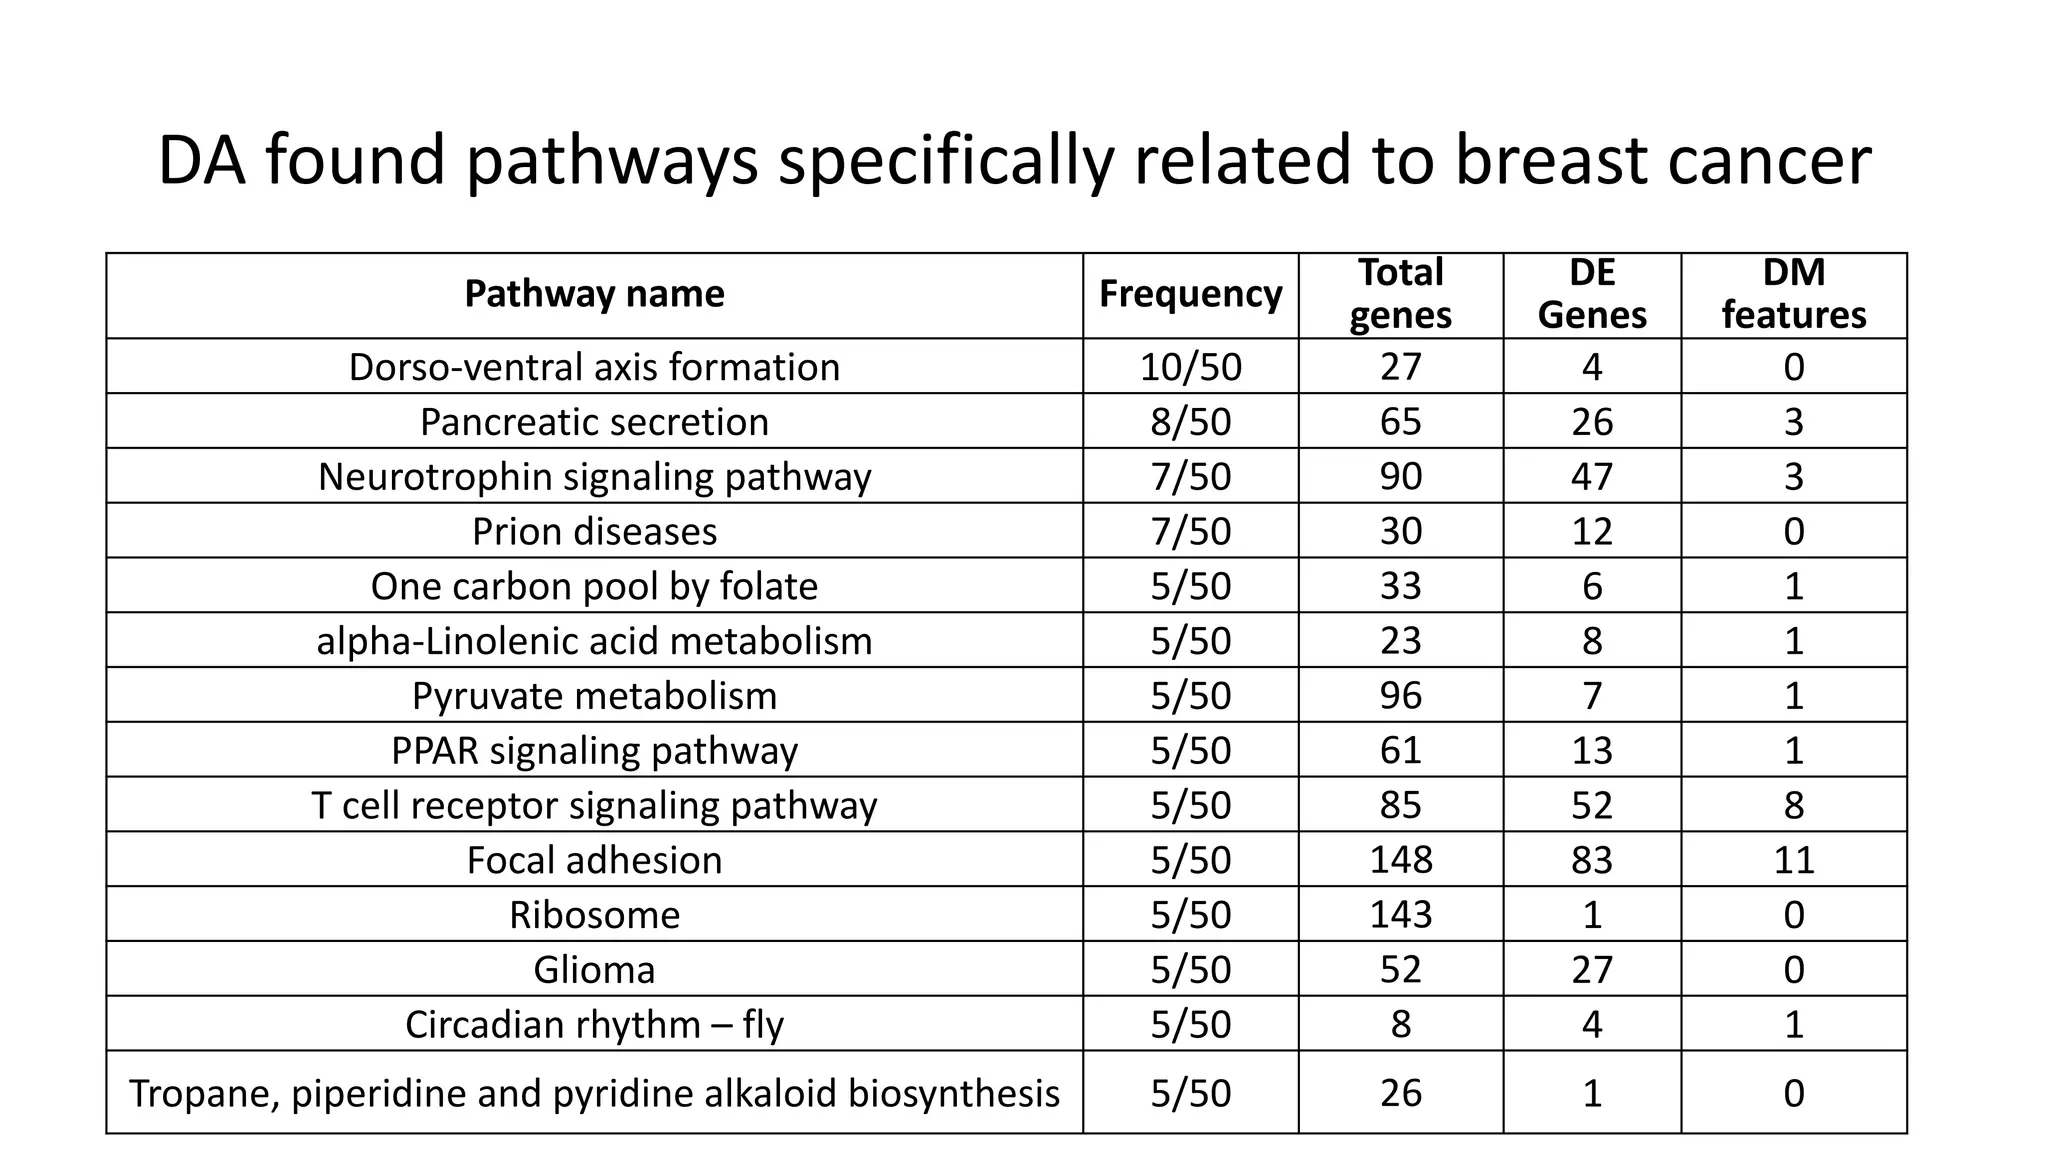
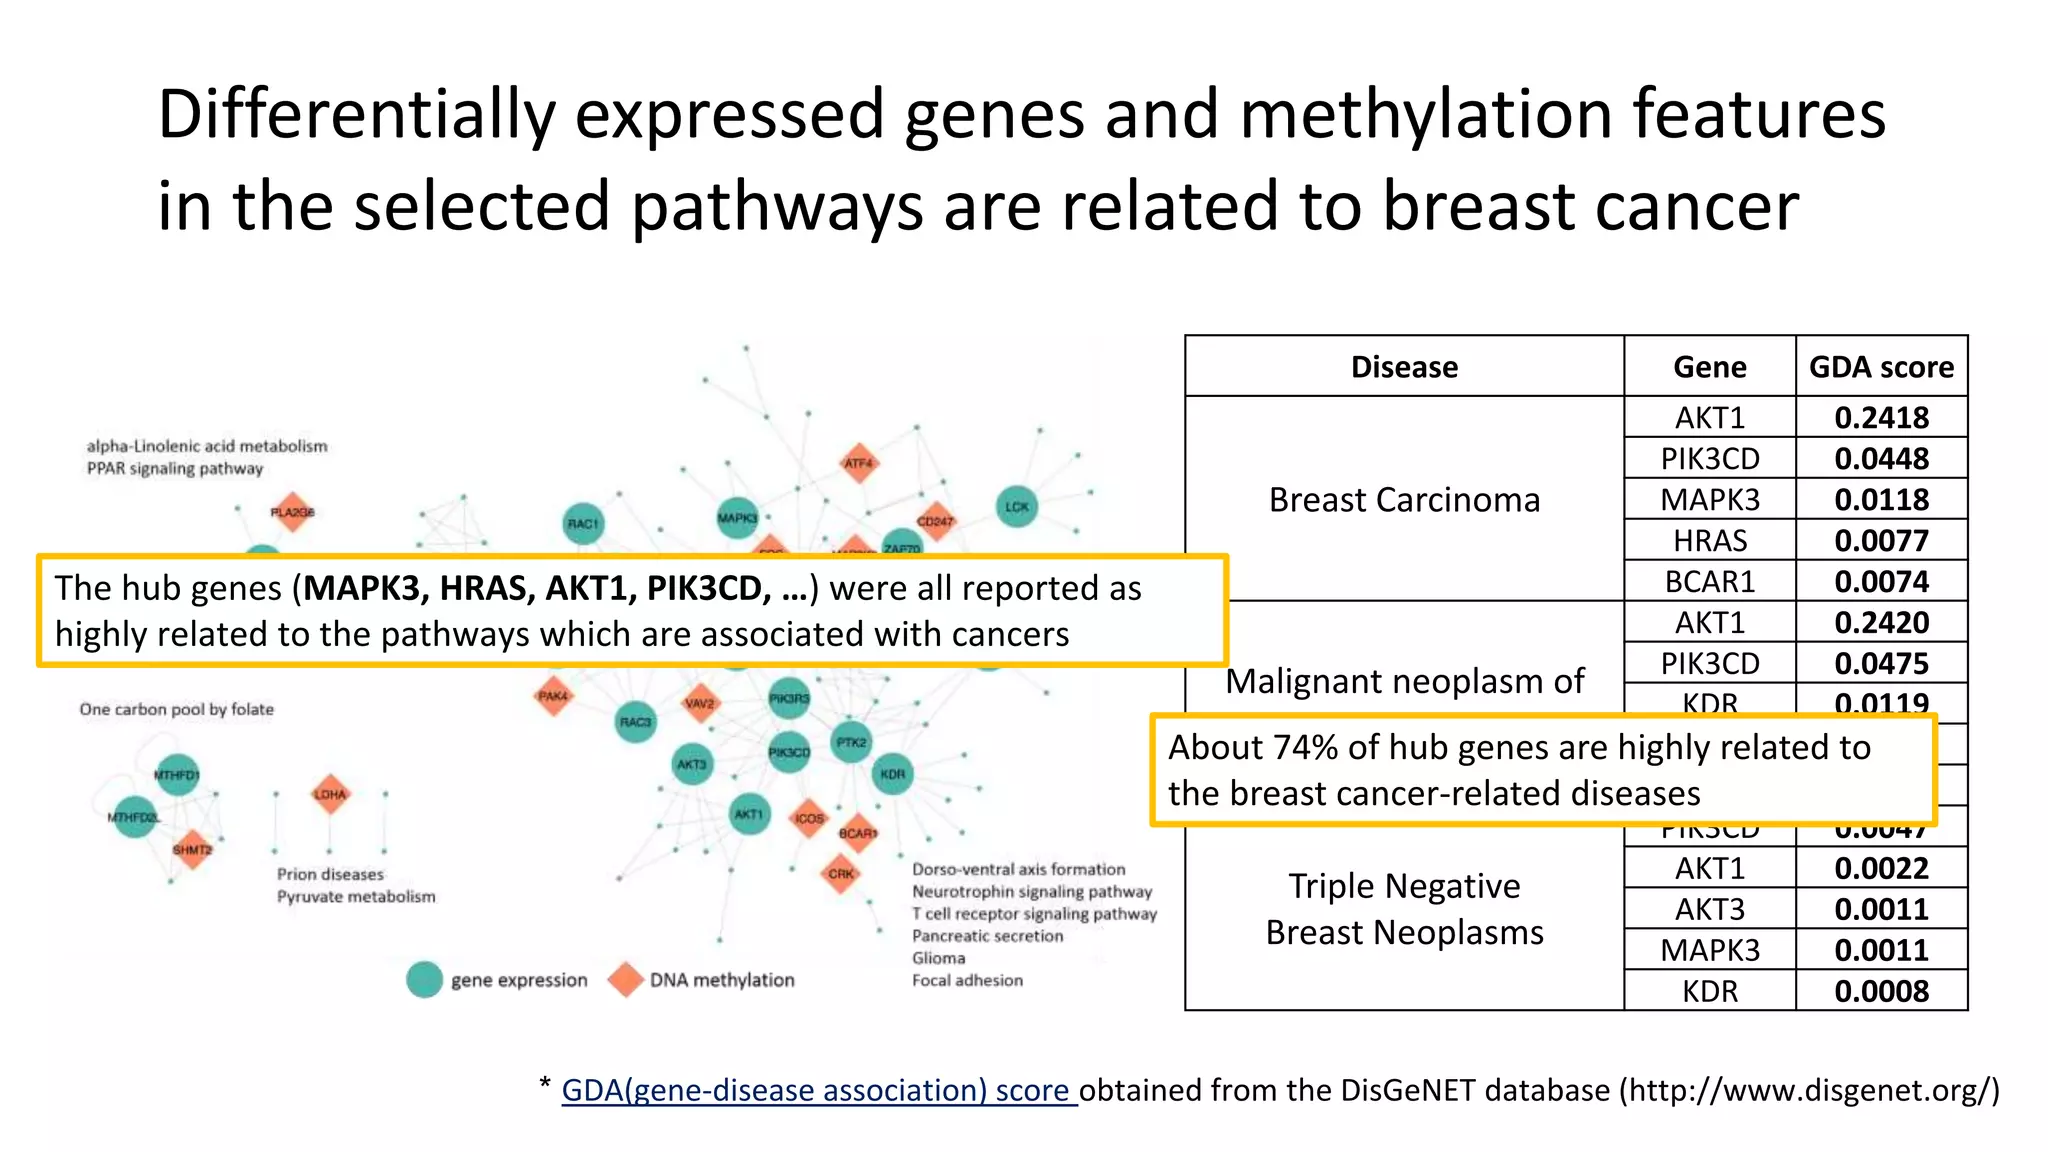
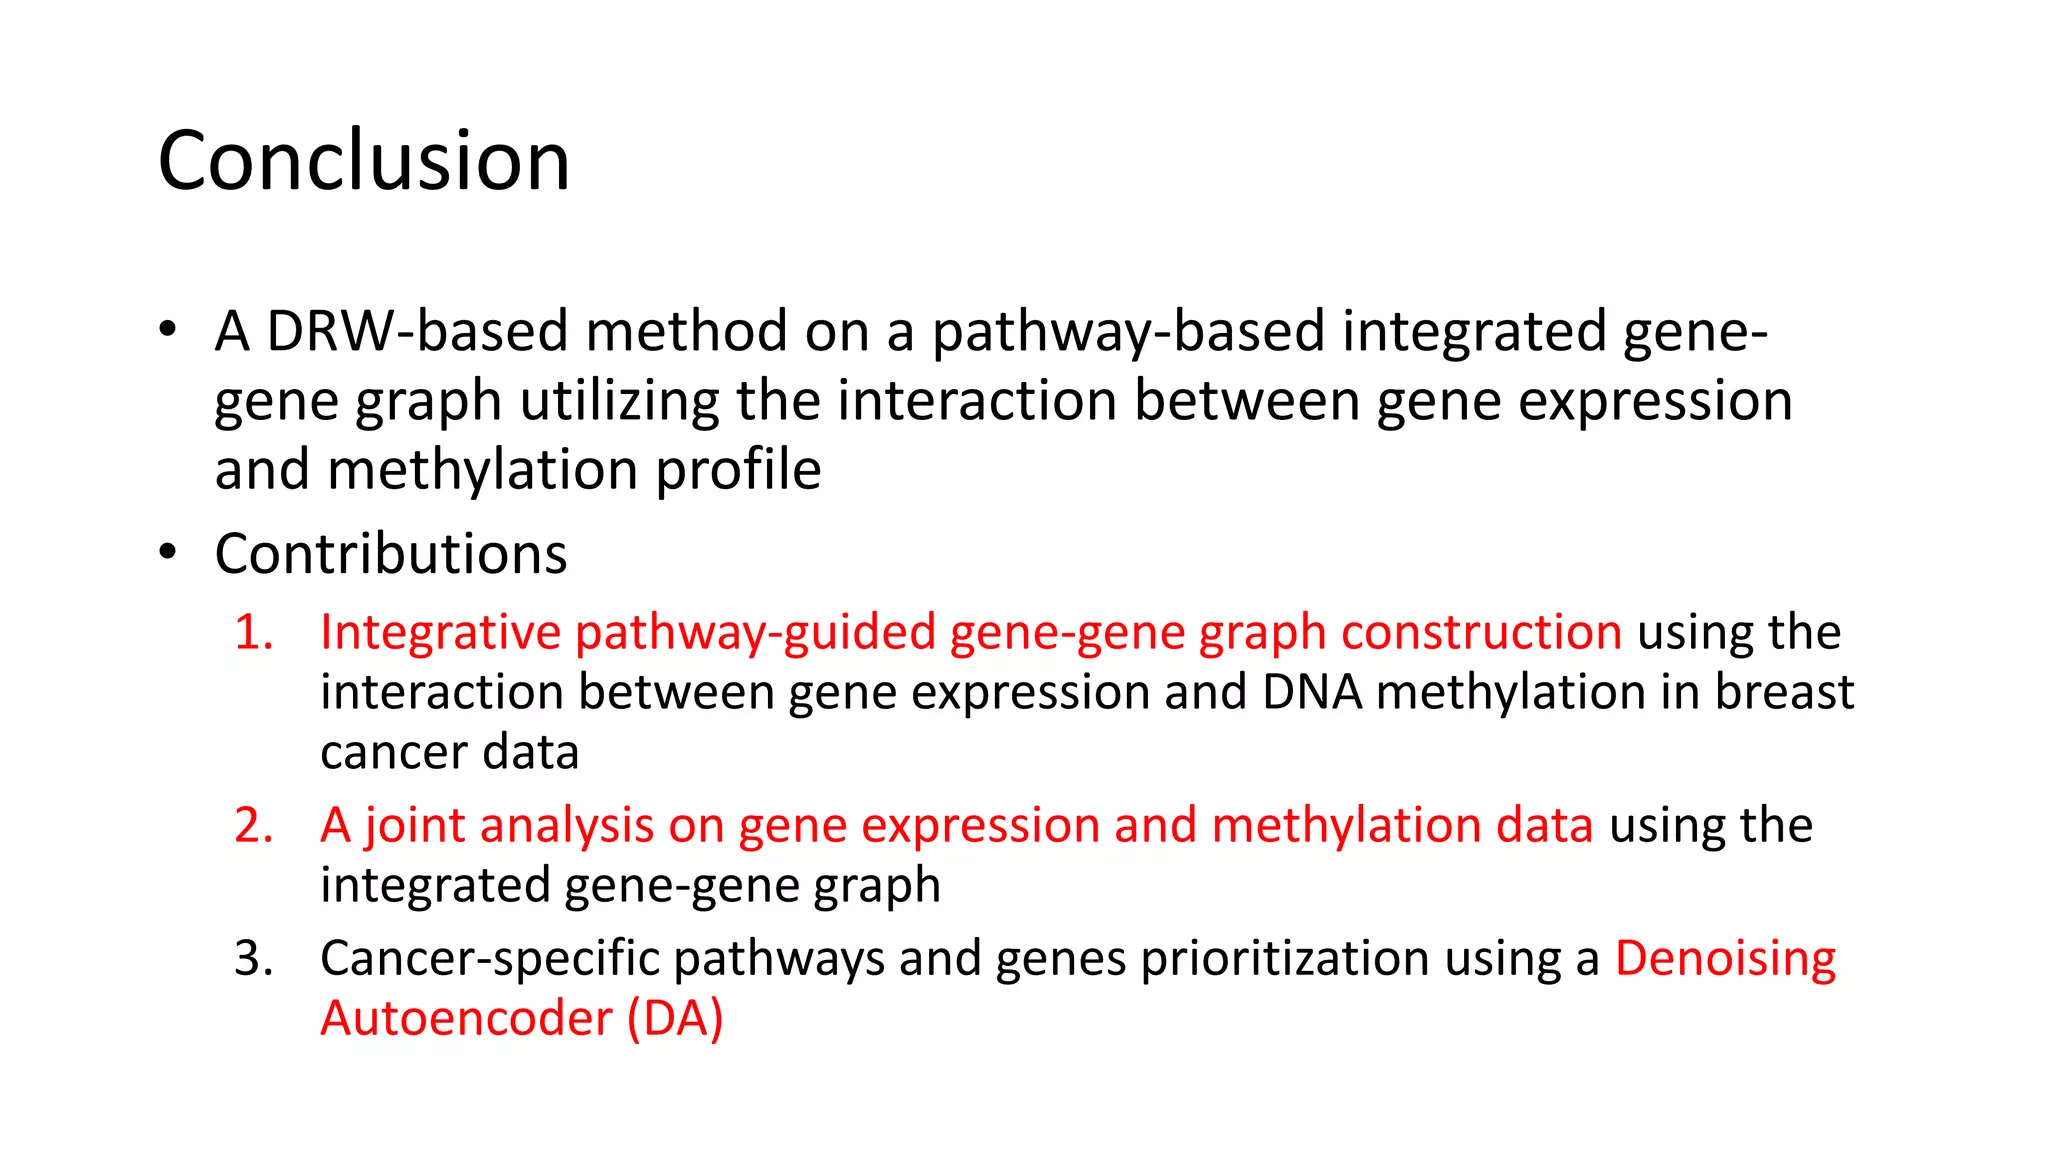


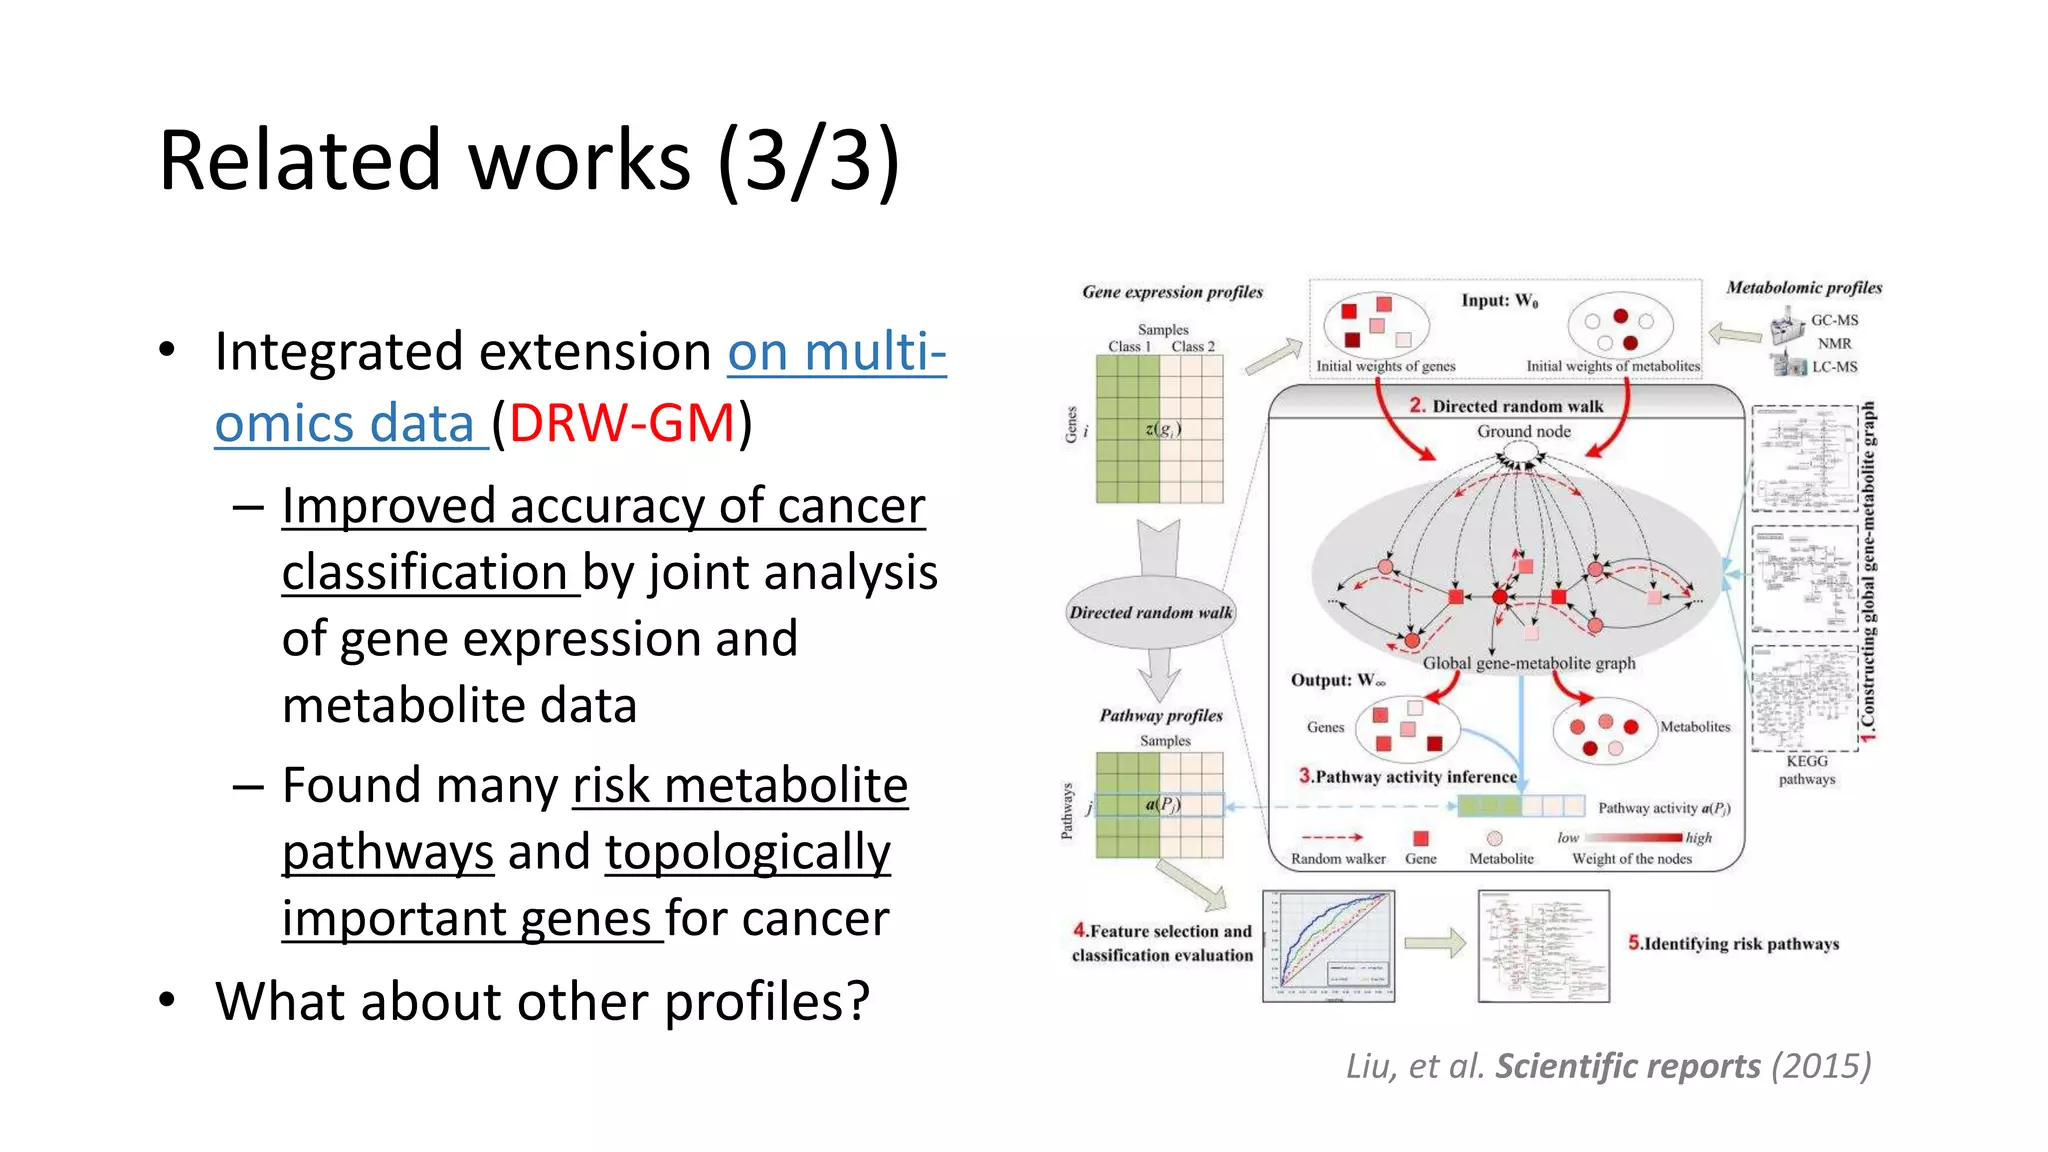
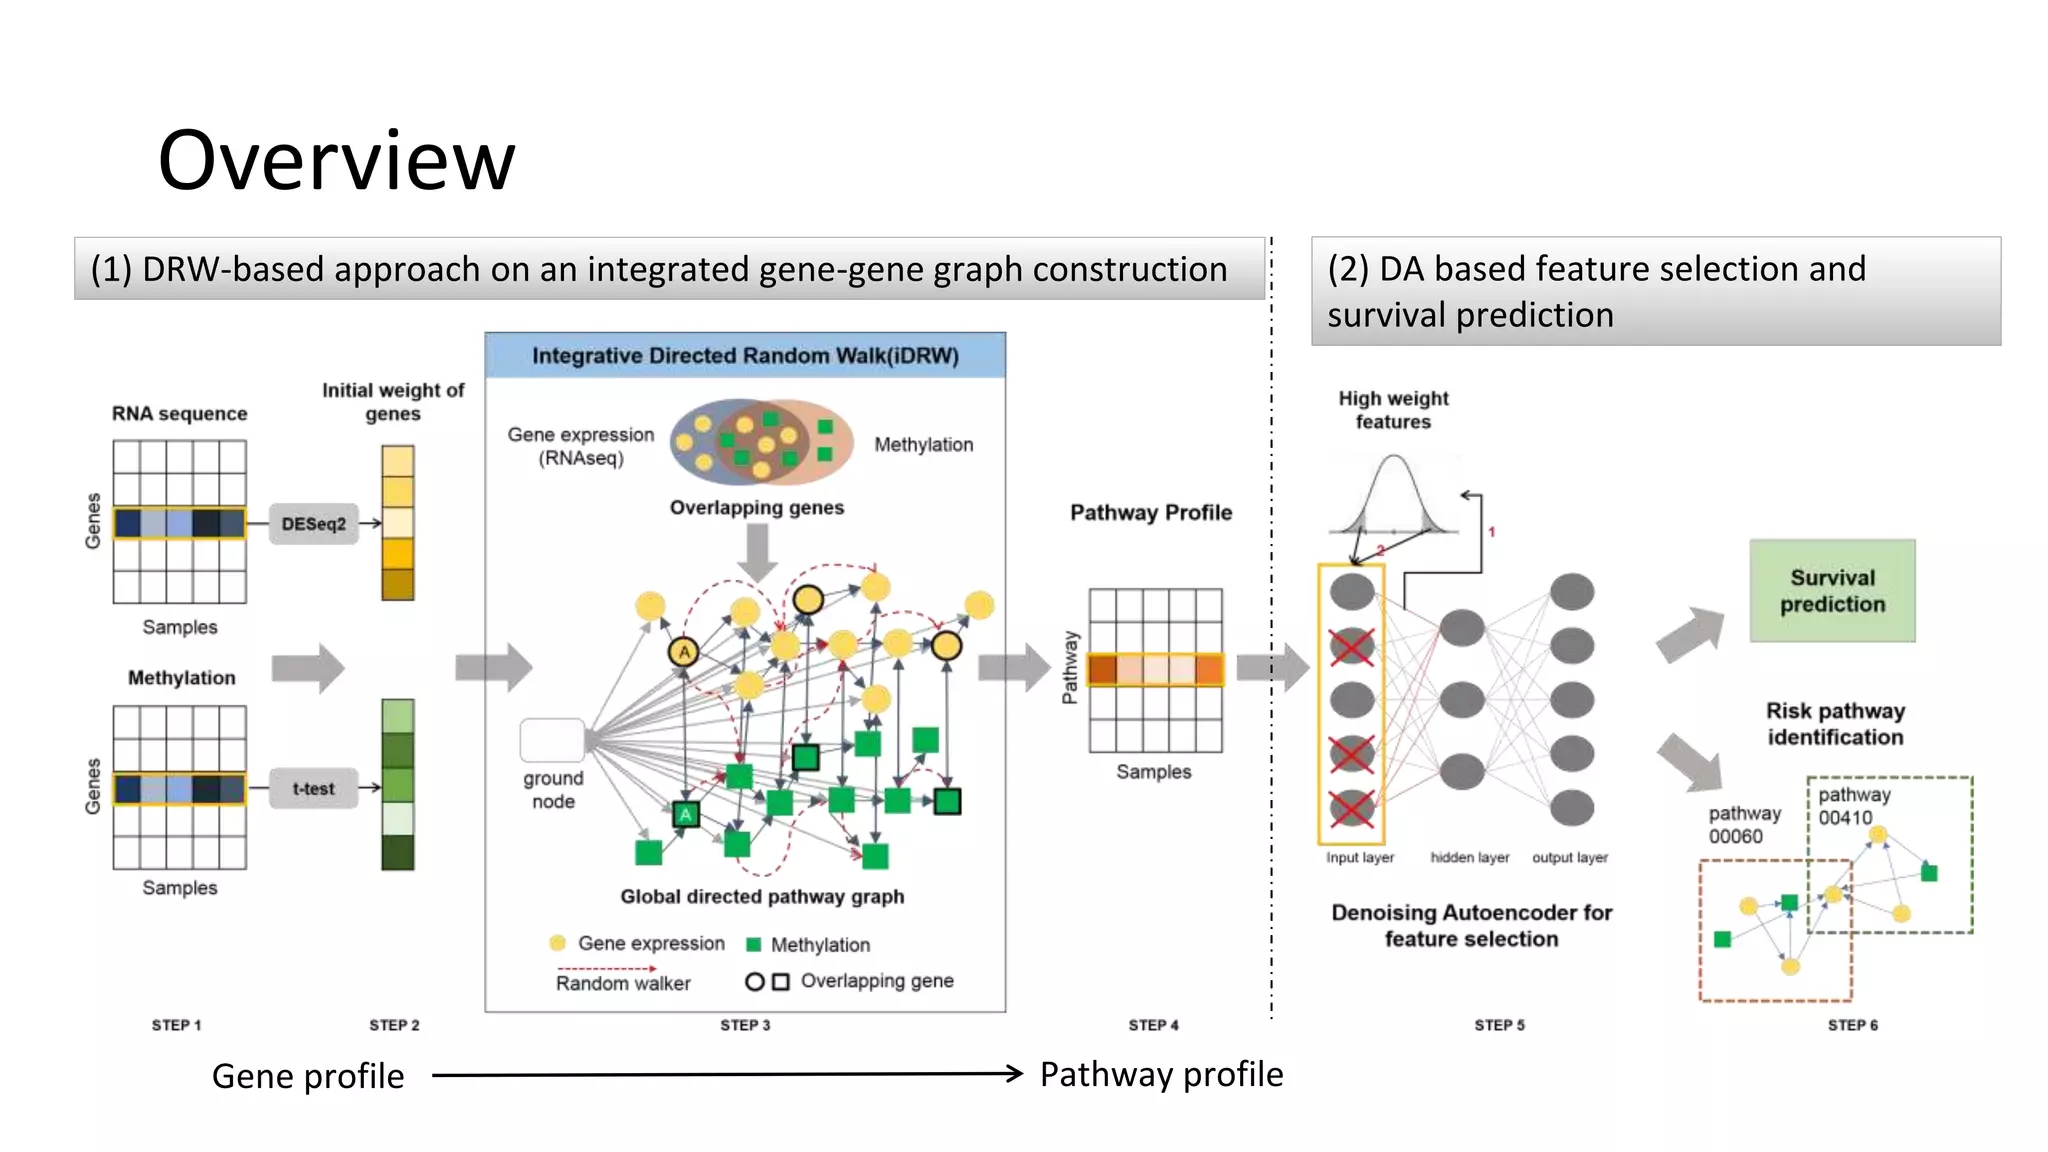
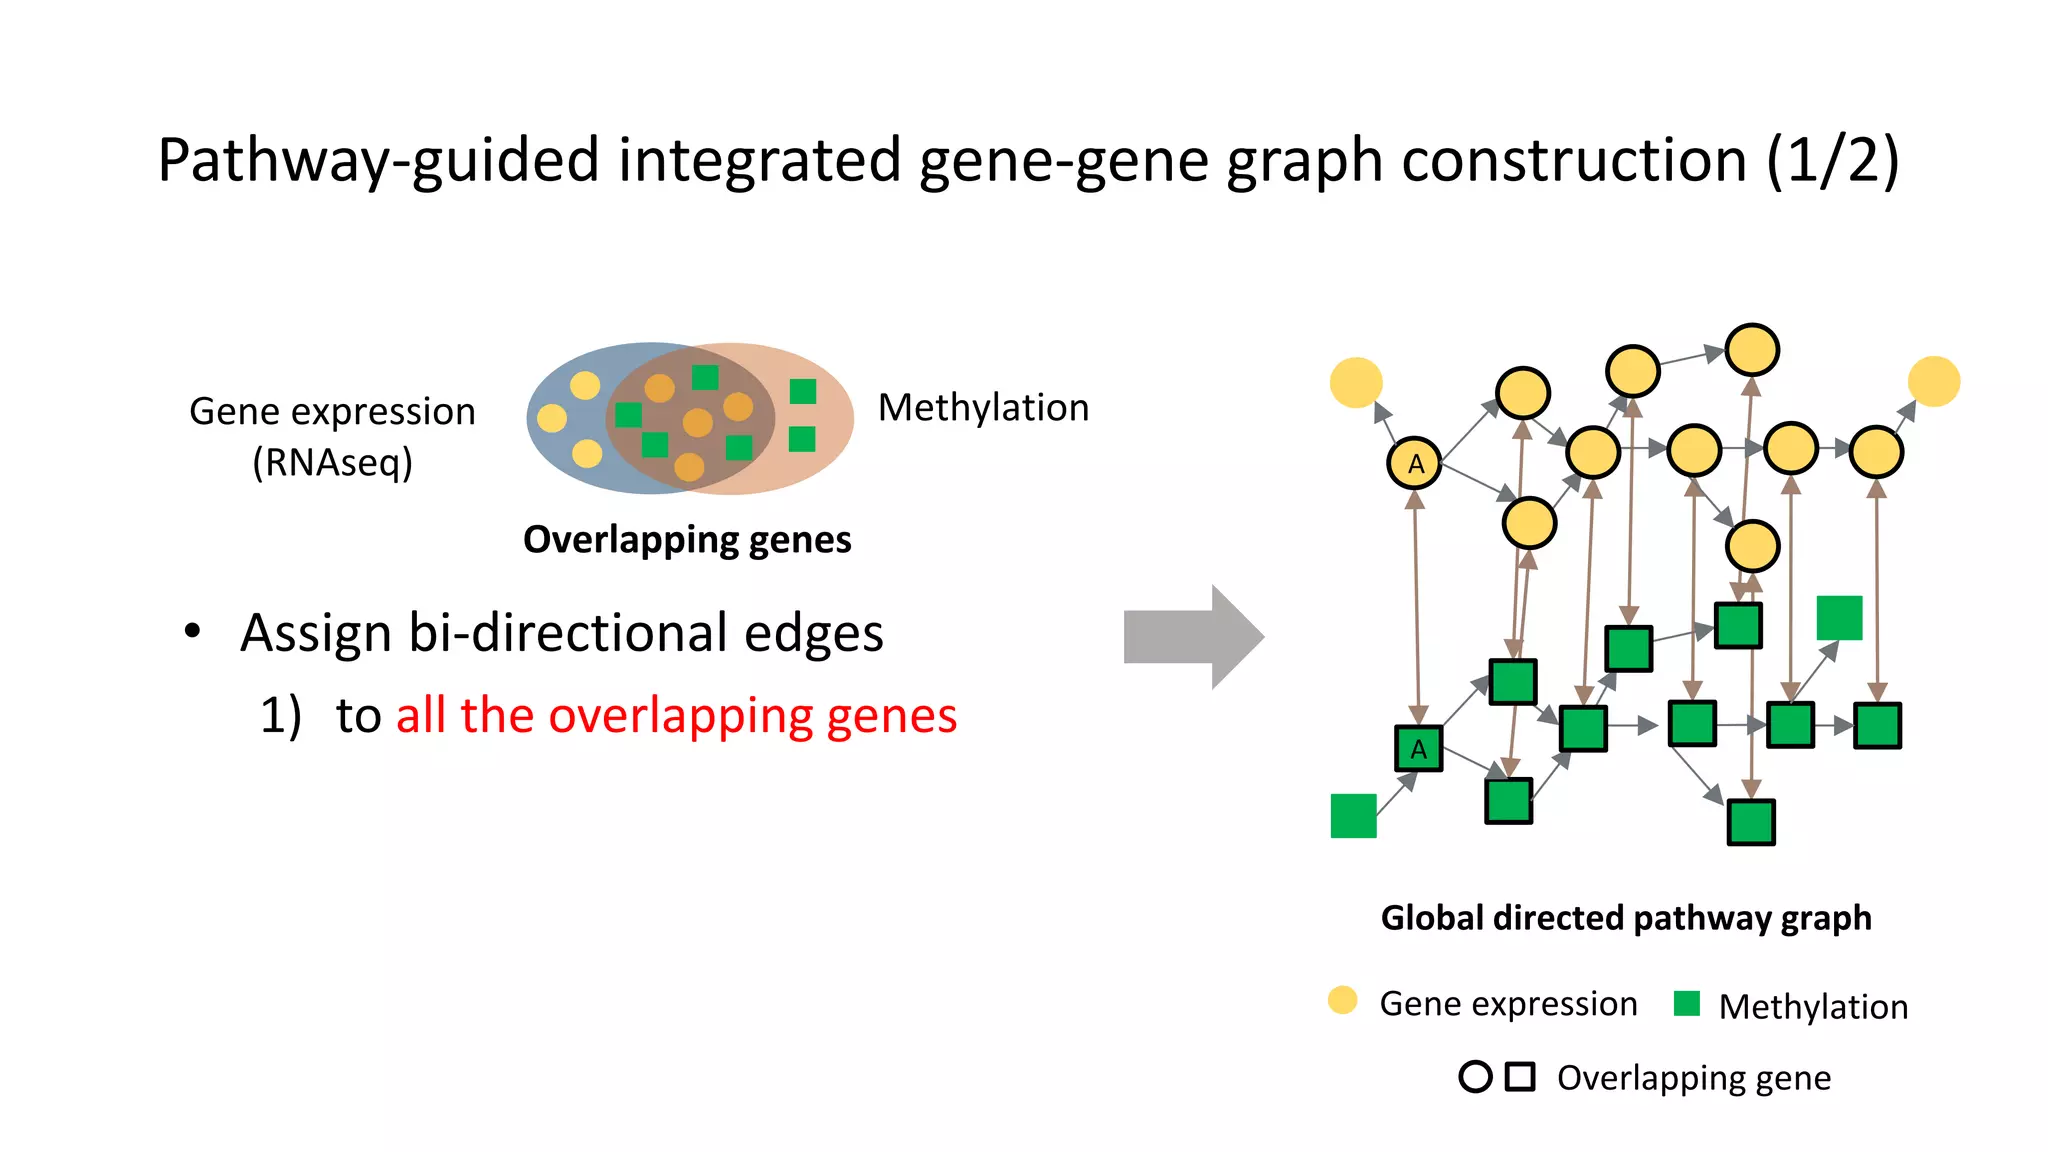
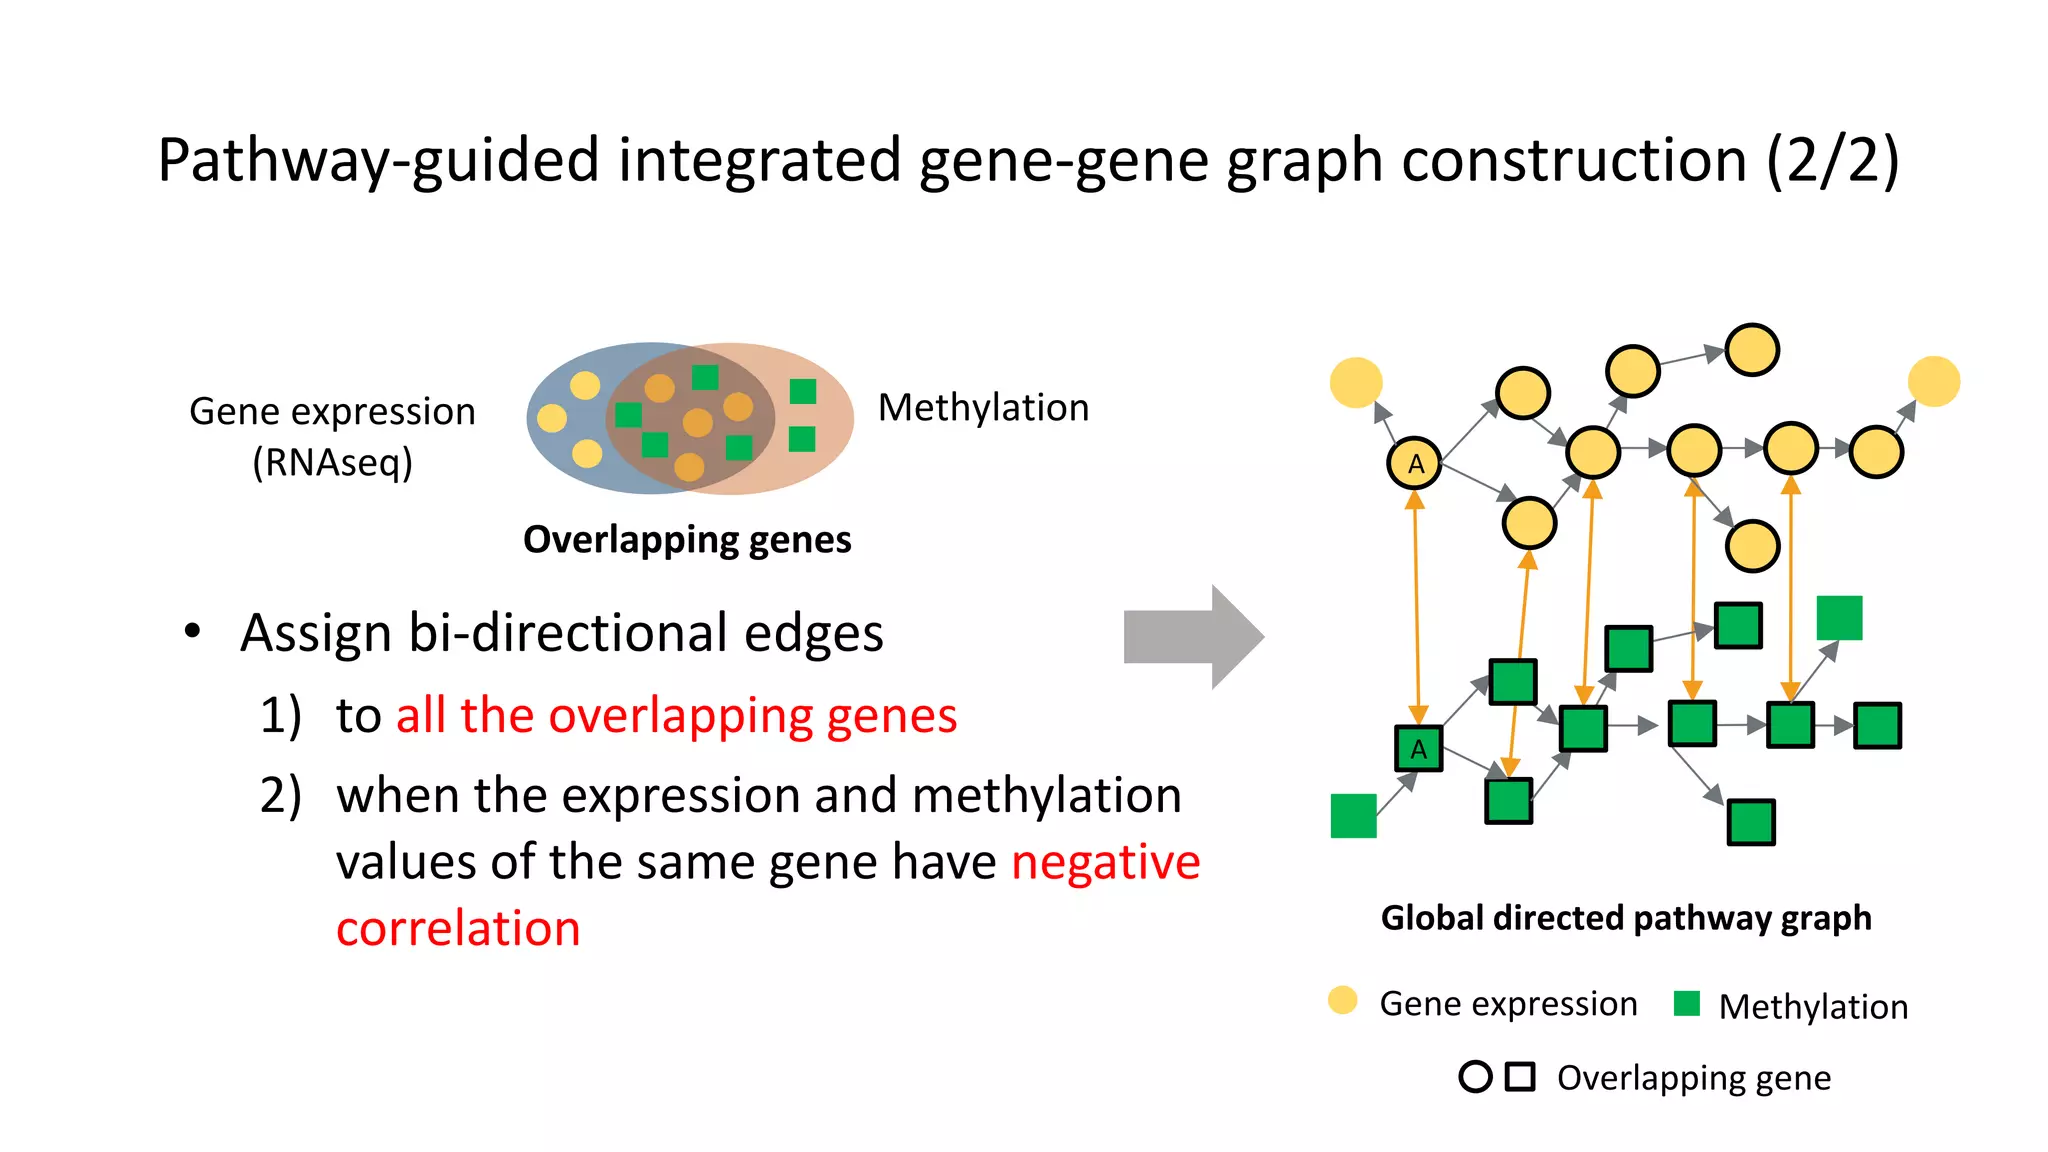
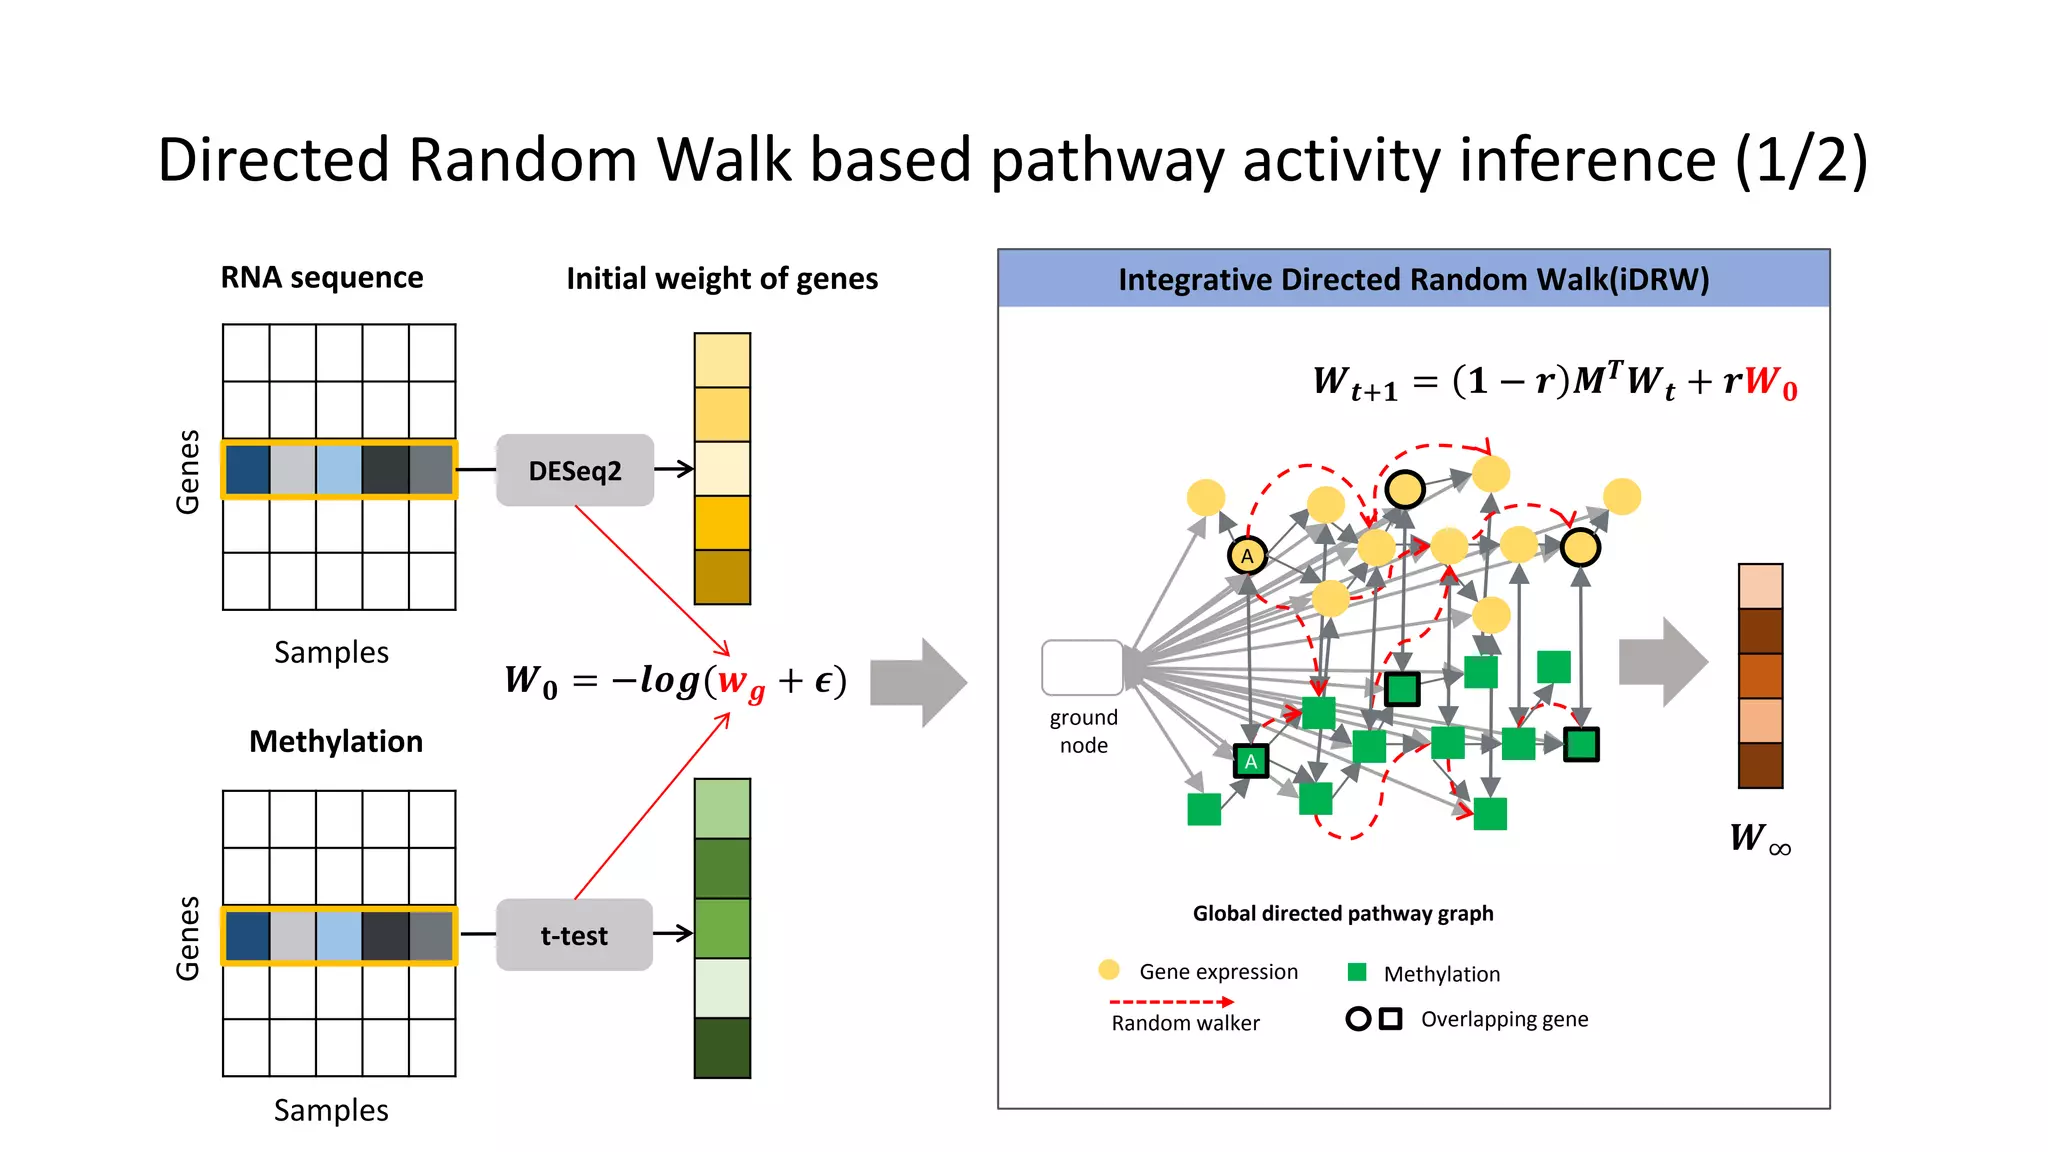
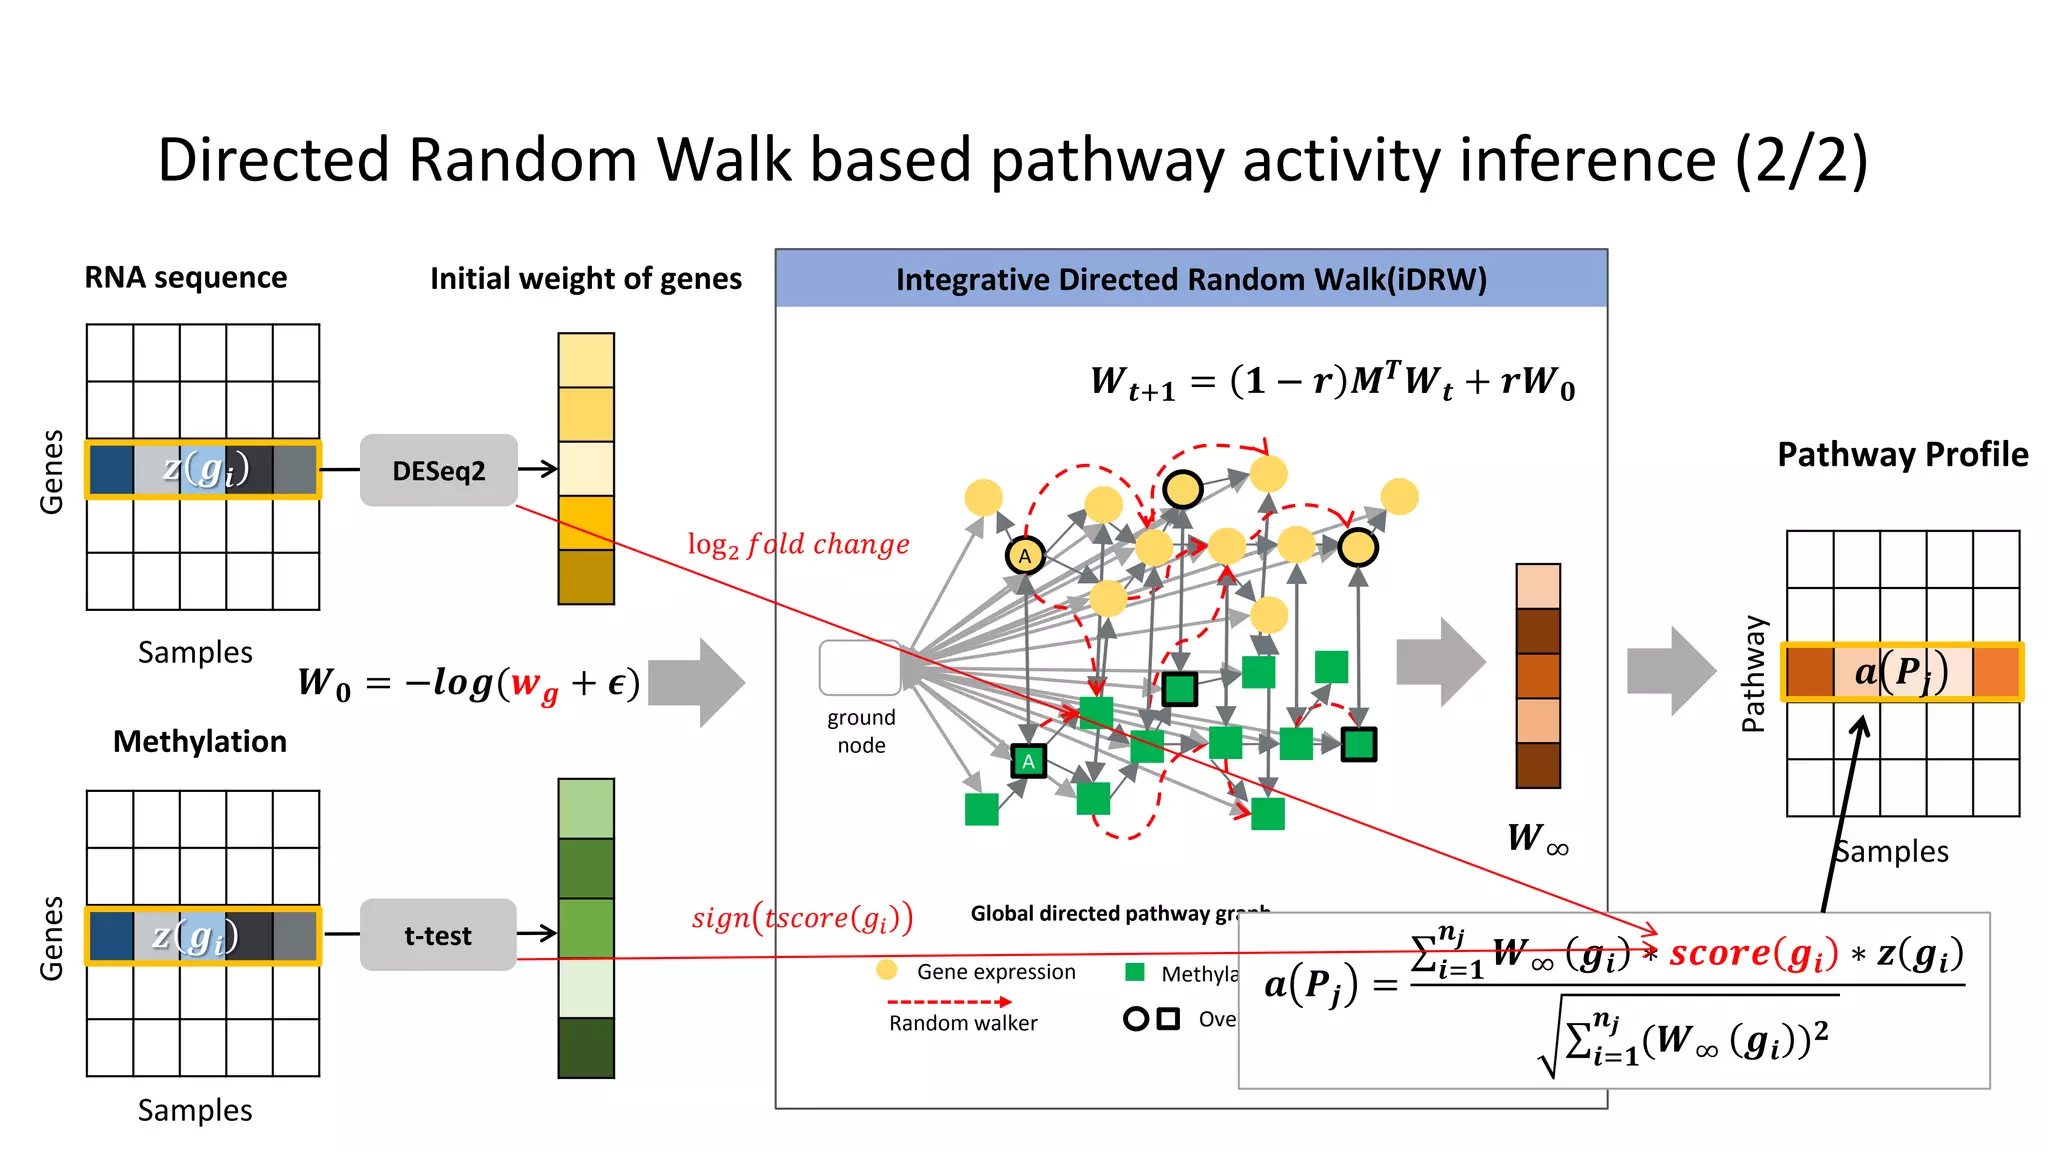
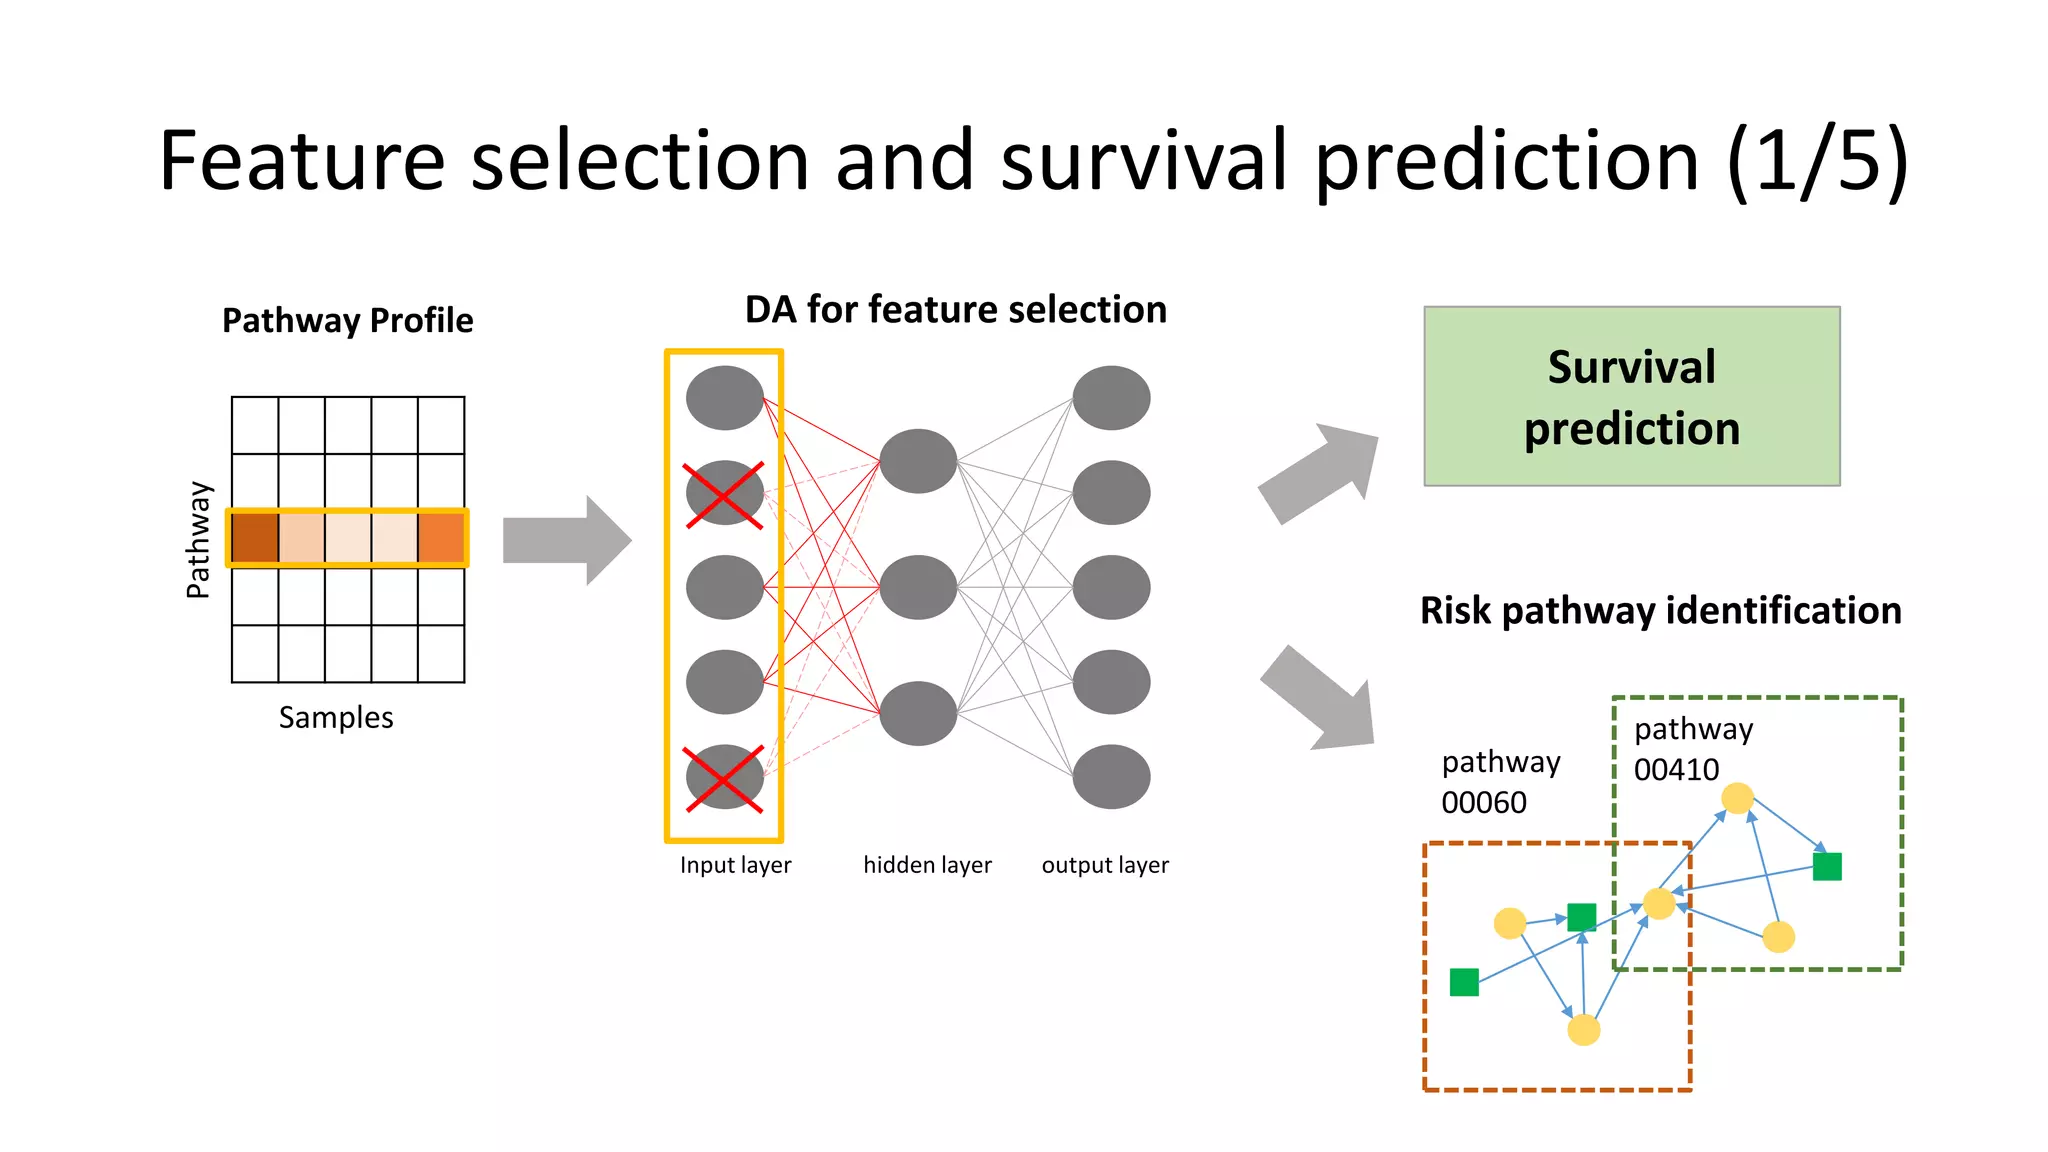
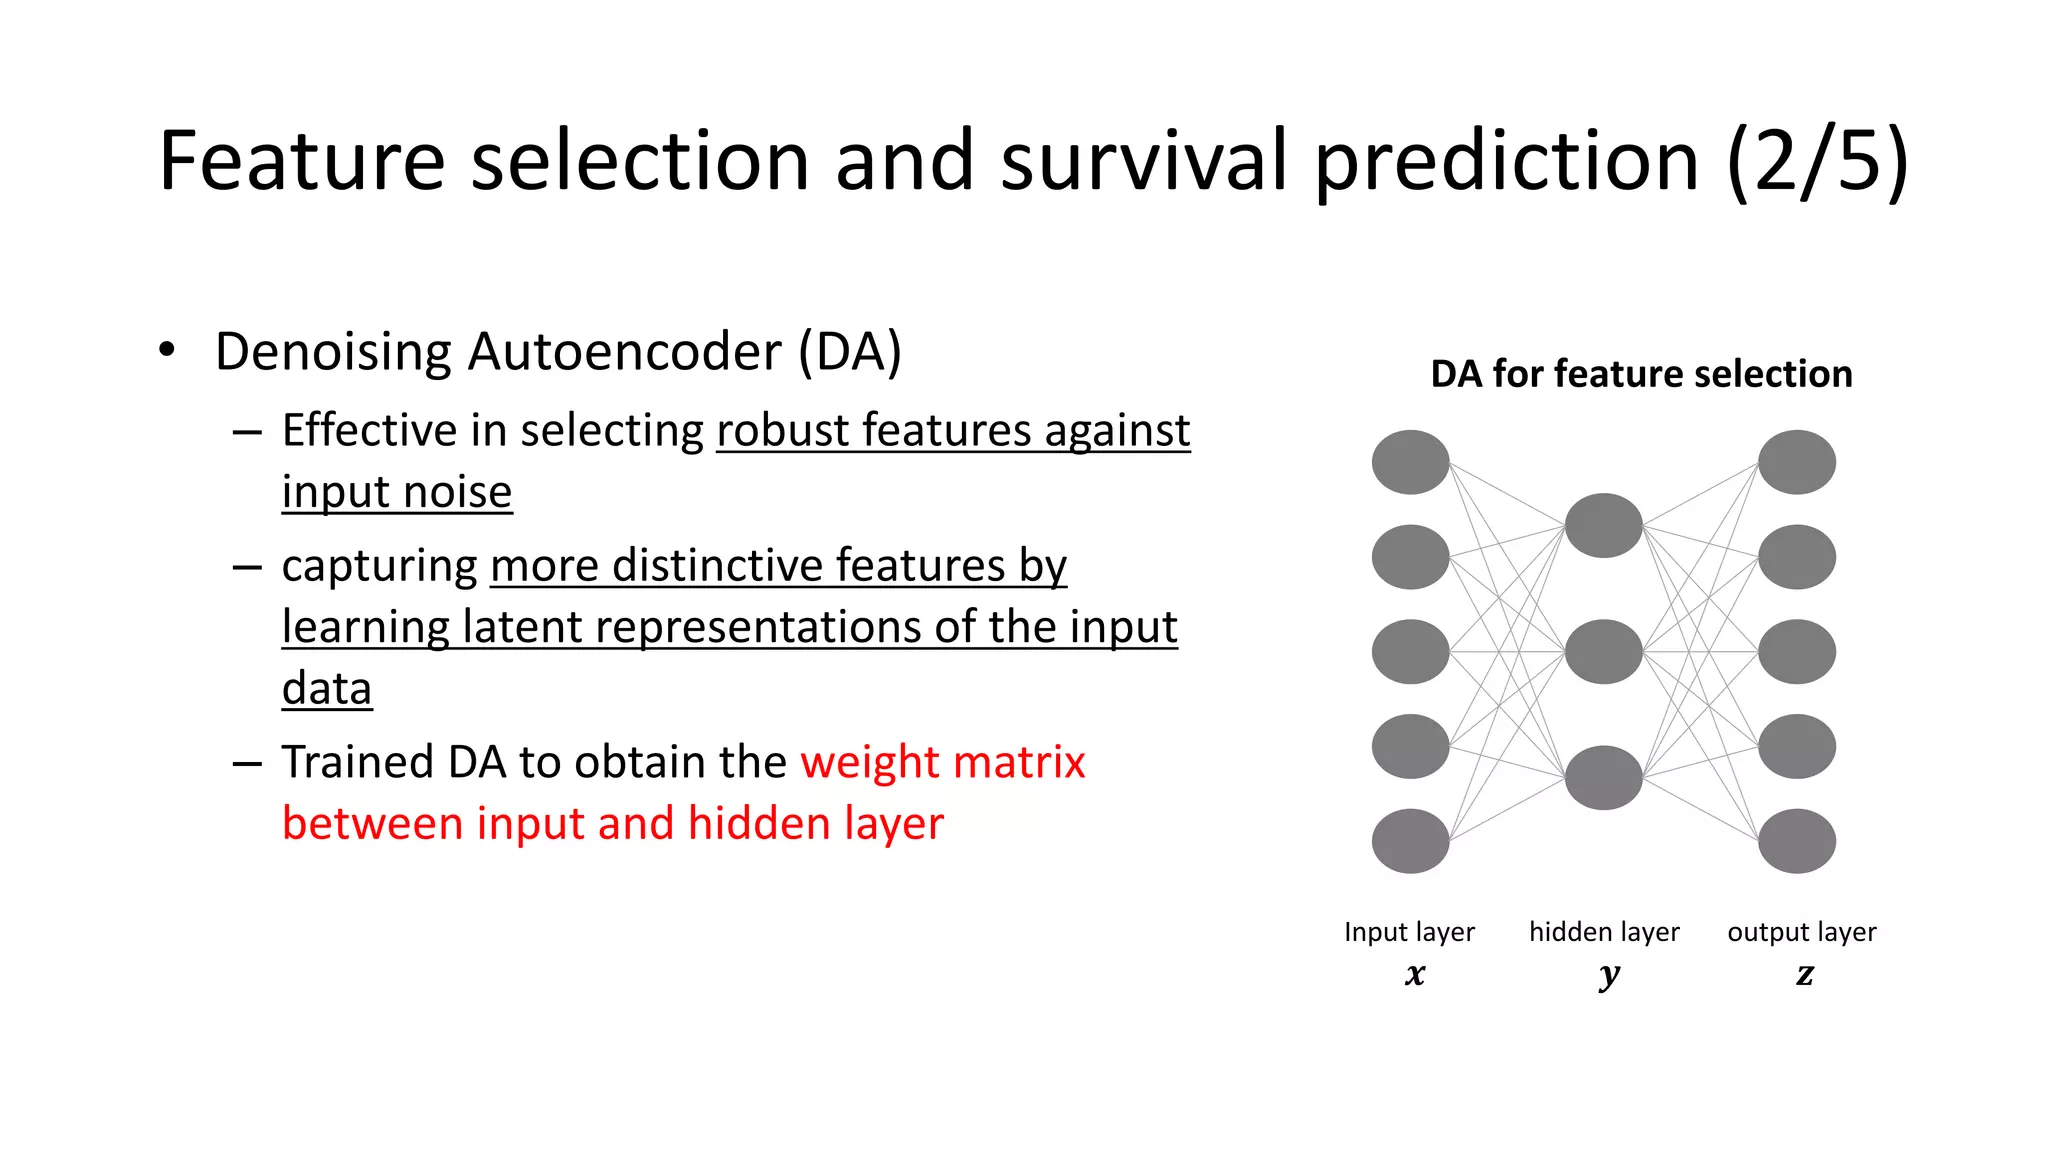
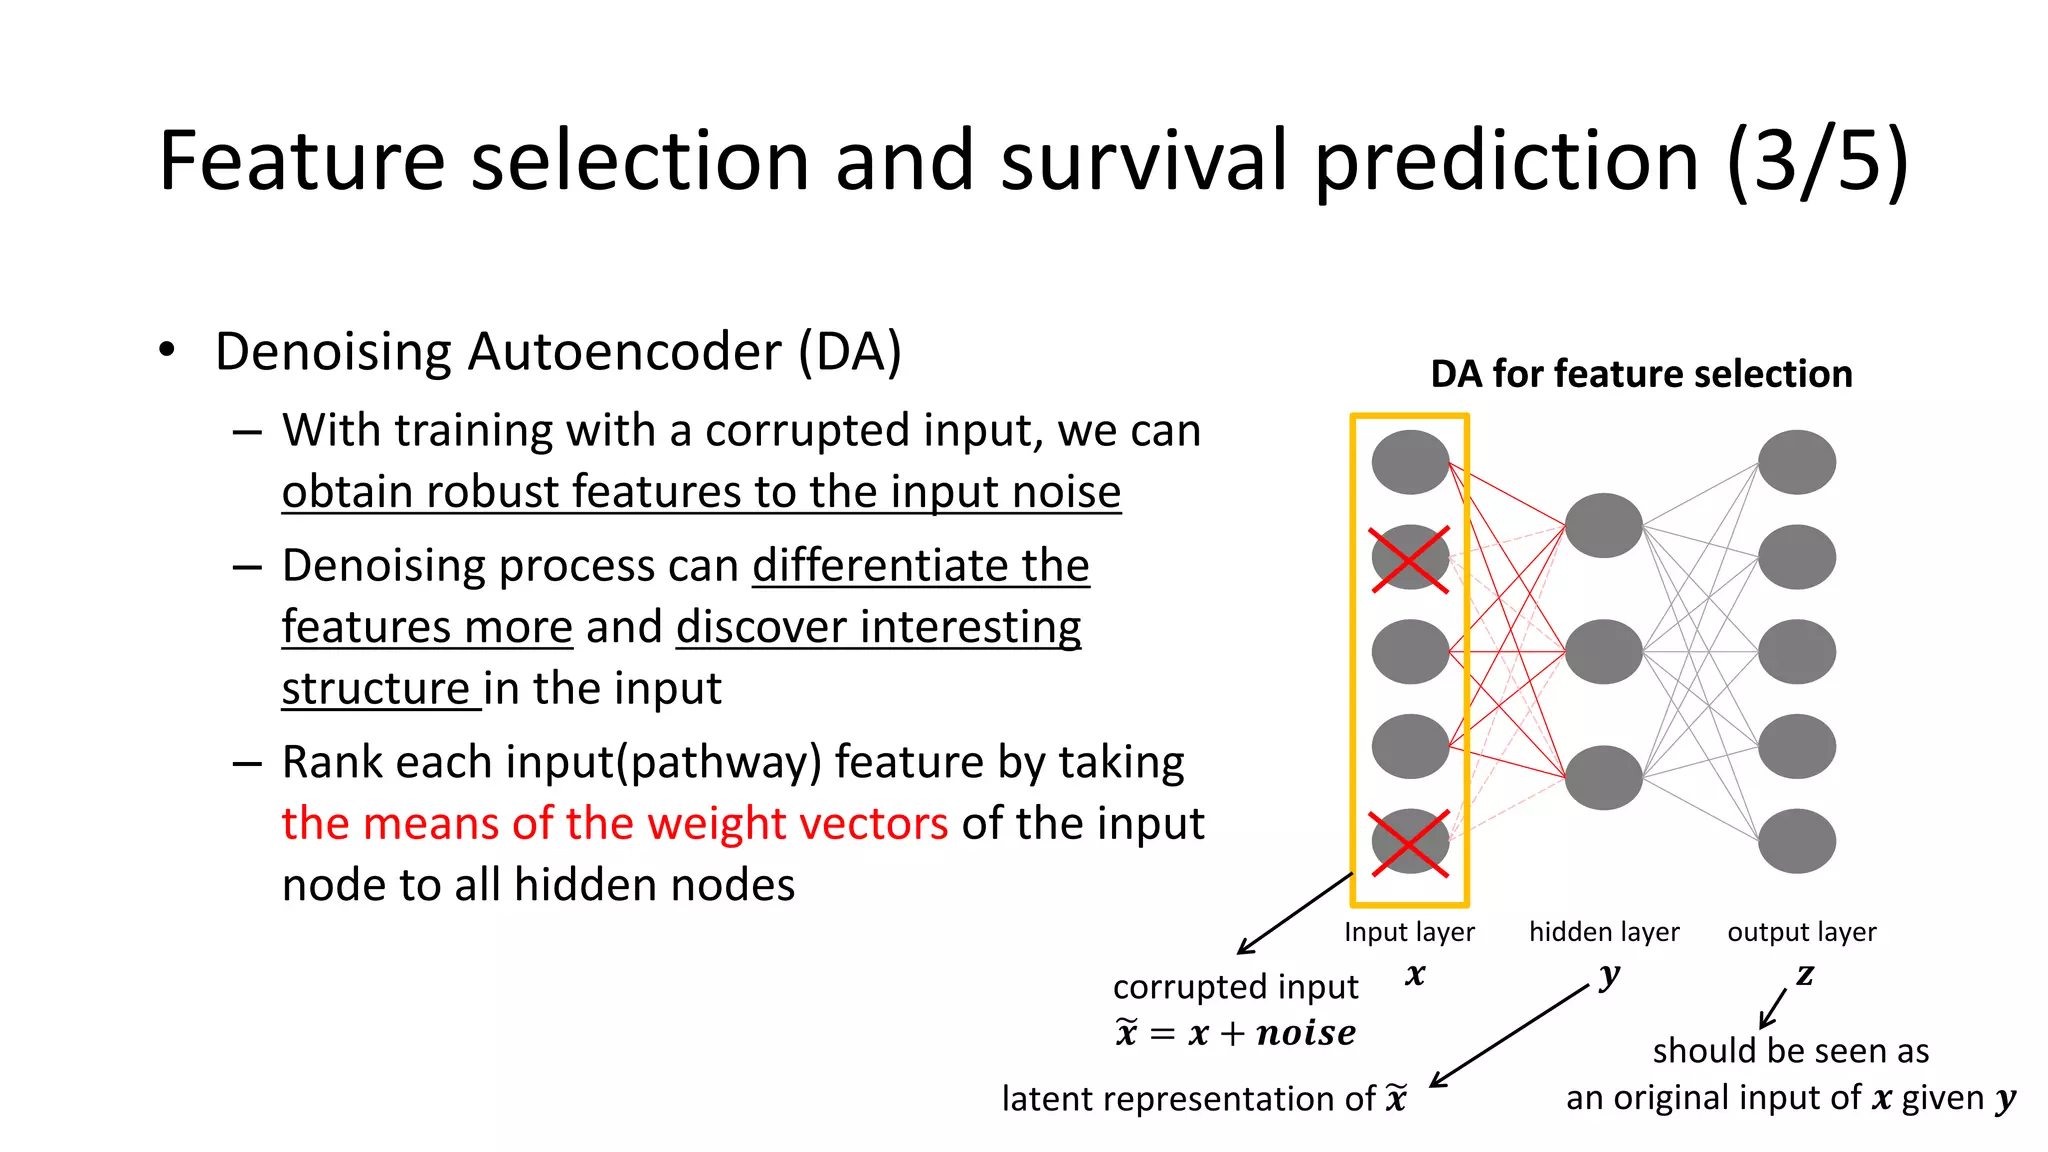
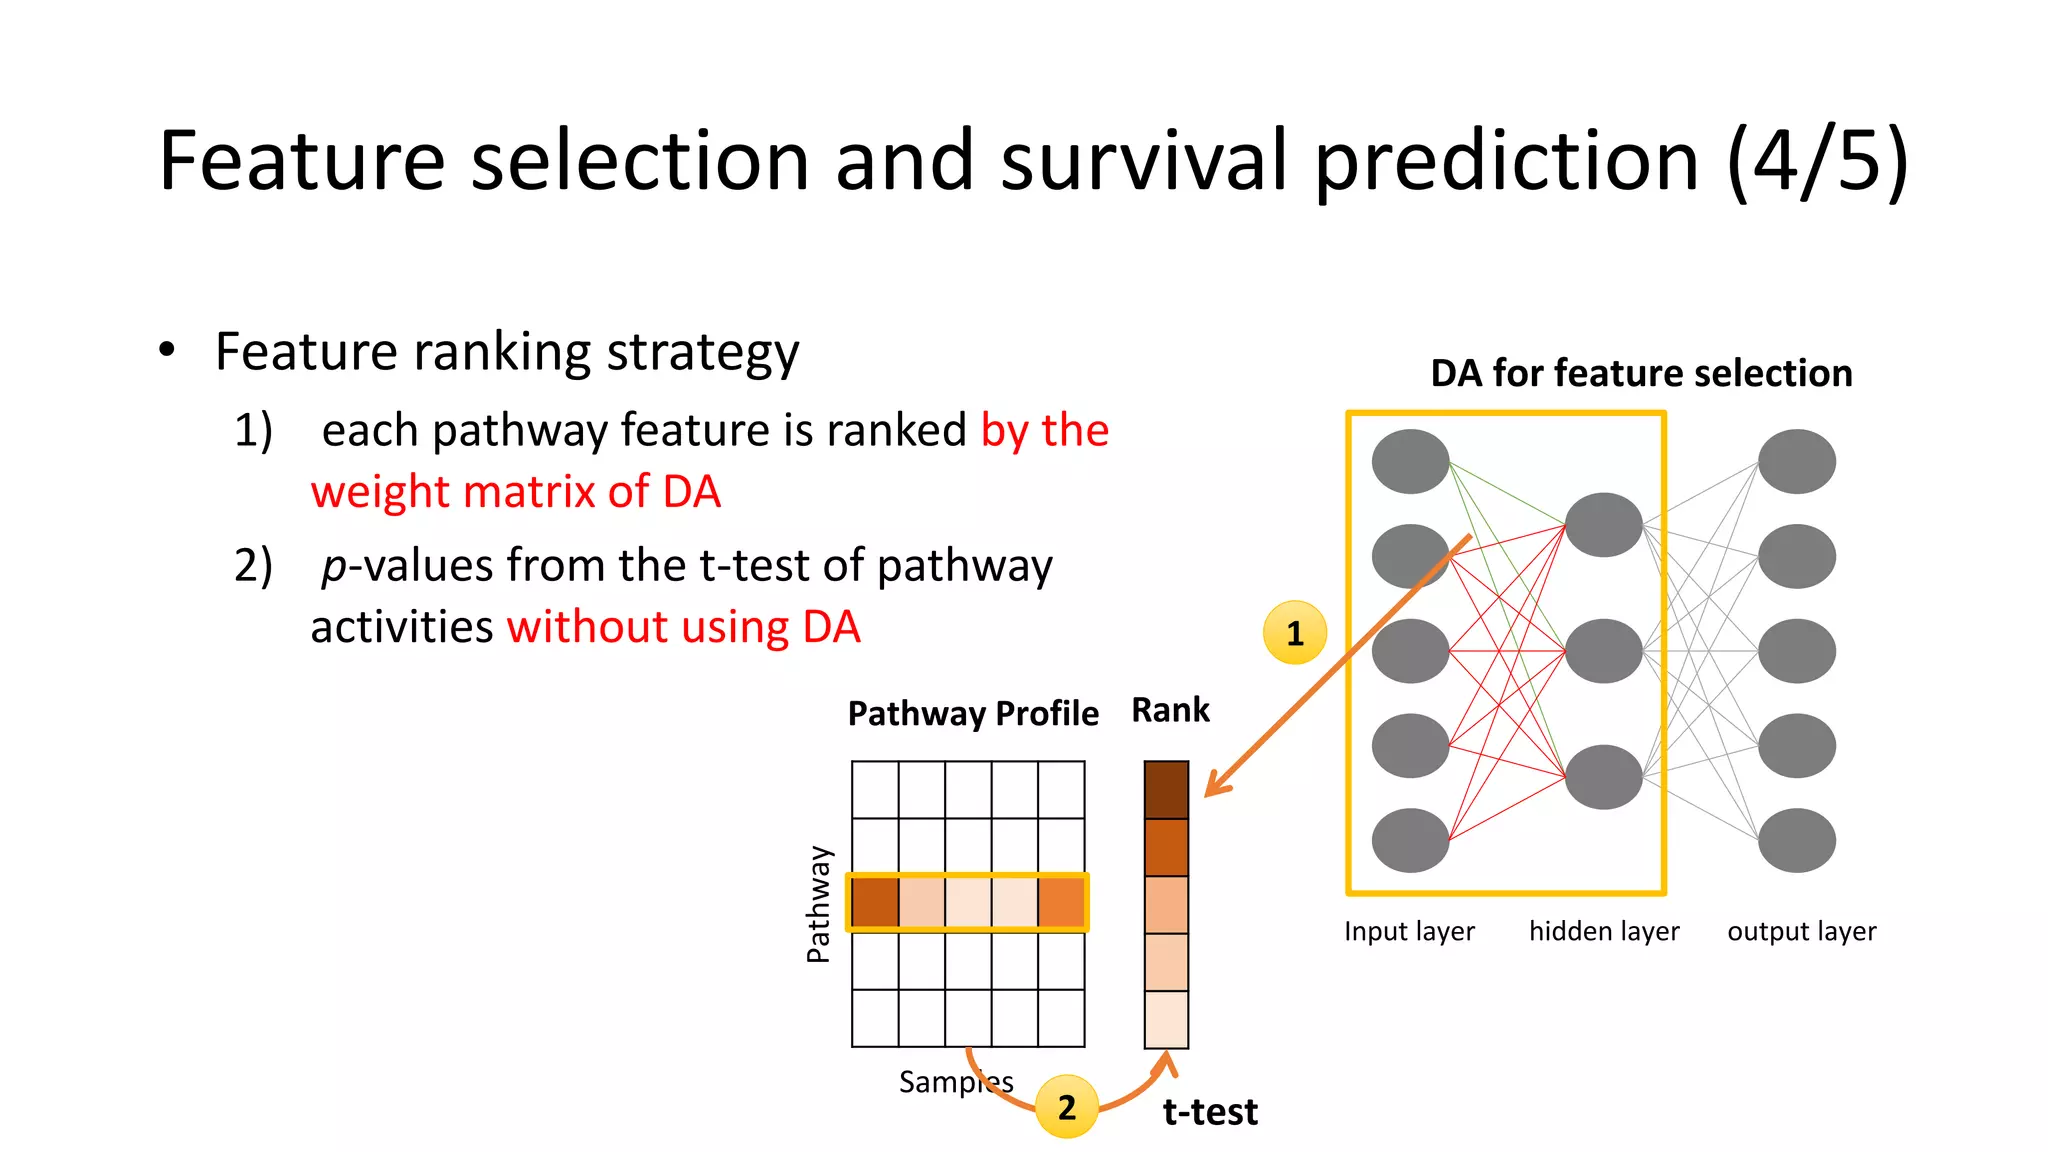
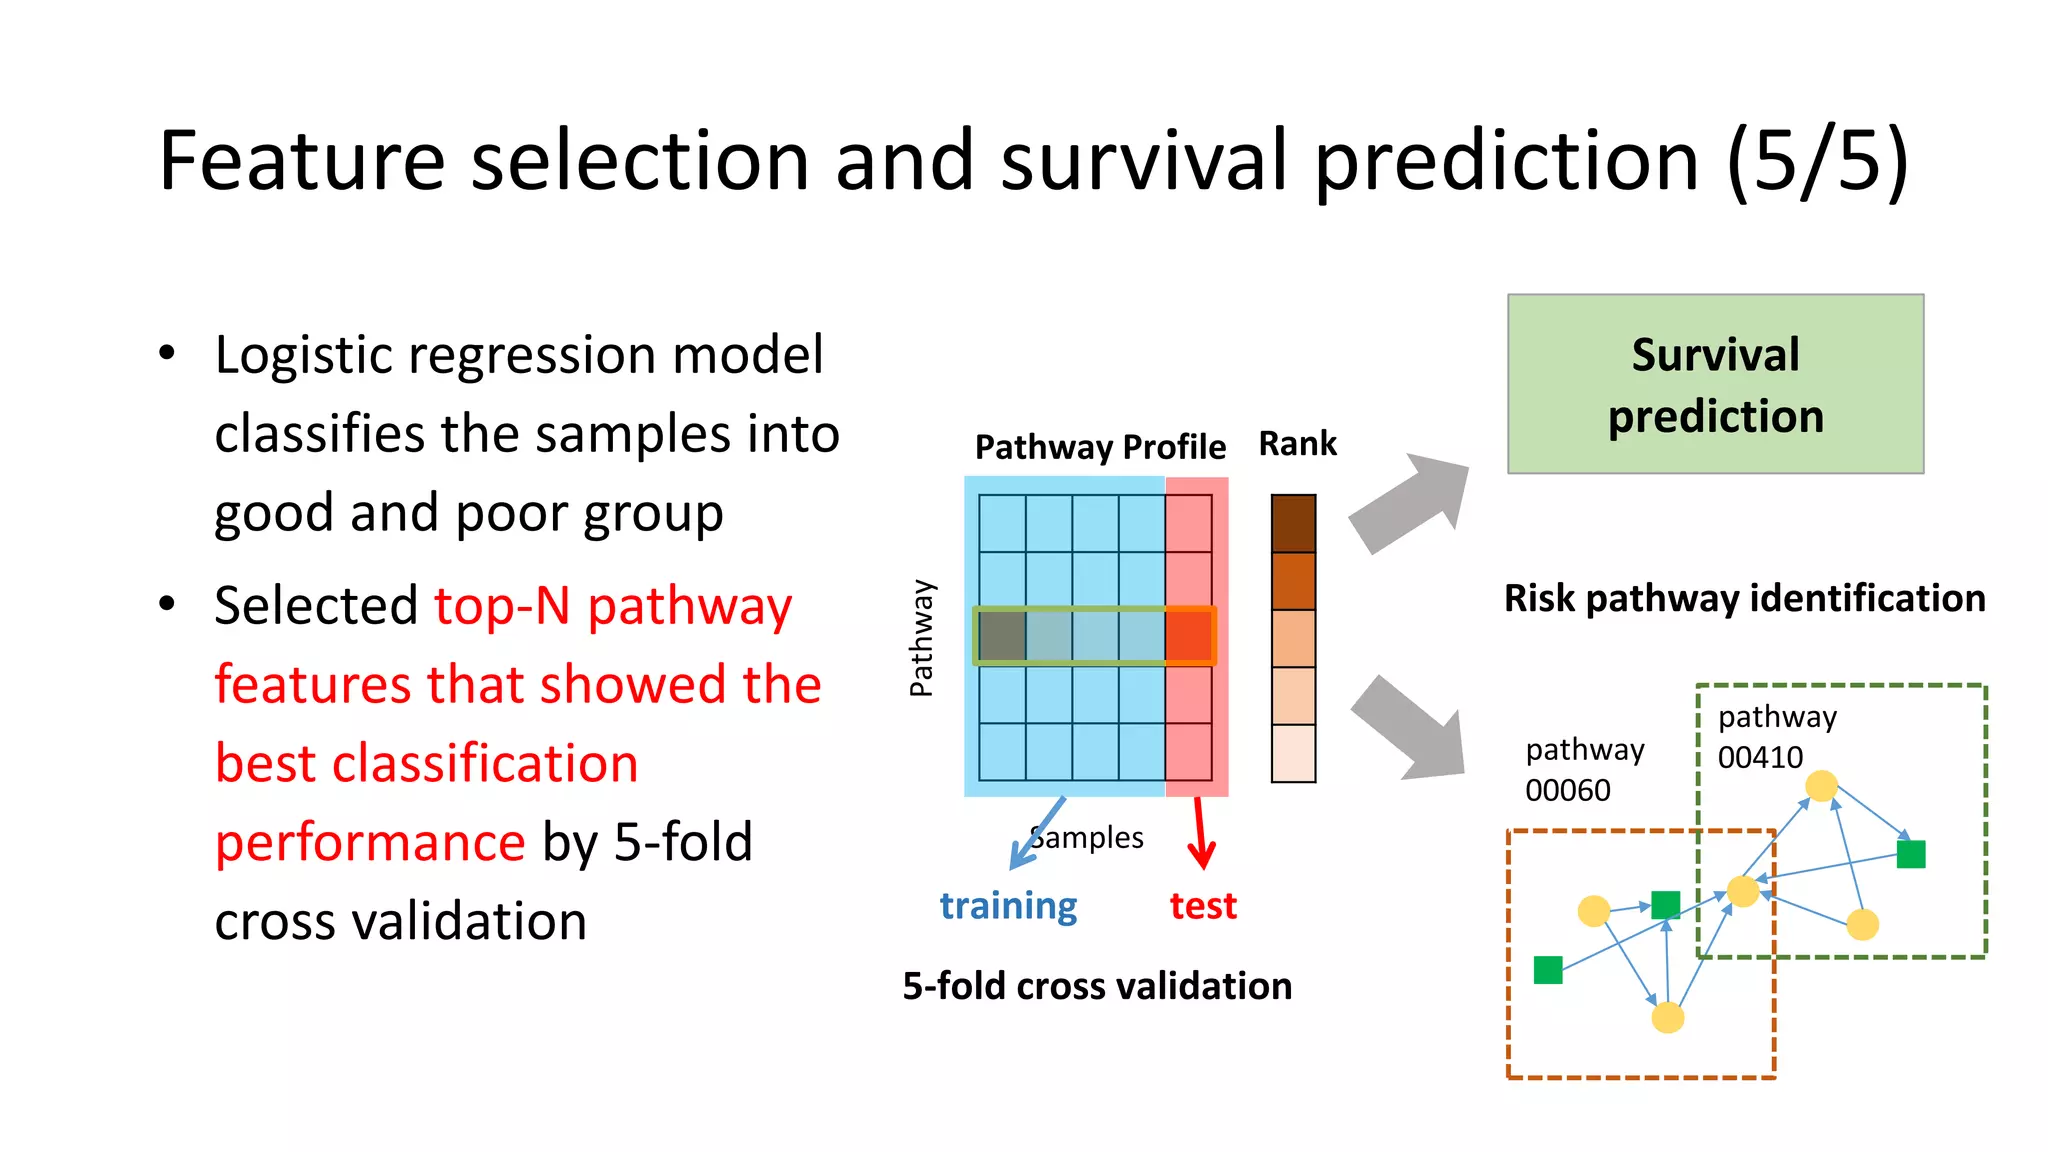
This document summarizes a study that integrates gene expression and DNA methylation data to predict survival in breast cancer patients. The study constructs an integrated gene-gene graph incorporating pathway information and gene interactions. It then uses a directed random walk approach to infer pathway activities from the graph. A denoising autoencoder is applied to select important pathways related to breast cancer survival. The top pathways identified include dorso-ventral axis formation and neurotrophin signaling. Analysis found differentially expressed genes and methylation features in the pathways are associated with breast cancer. The integrated approach improved cancer classification performance over using single data types.


![[DSC Europe 25] Vid Stimac - Policy Parsimony: Between Oversimplifying and Ov...](https://cdn.slidesharecdn.com/ss_thumbnails/eqlepagzqp2rhg3gbluh-dsc-stimac-251120-251205090438-059e7f54-thumbnail.jpg?width=640&height=640&fit=bounds)

![[DSC Europe 25] Bogdan Daniel Maruneac - AI - It starts with you.pptx](https://cdn.slidesharecdn.com/ss_thumbnails/odov3snhrcqs9hx5ny2n-4-251205085715-f1daacfe-thumbnail.jpg?width=640&height=640&fit=bounds)
![[DSC Europe 25] Andy Cotgreave - Nothing is new in analytics.pptx](https://cdn.slidesharecdn.com/ss_thumbnails/mba4vzcurvoh5lfrd5zw-6-251205194645-341bbbbe-thumbnail.jpg?width=640&height=640&fit=bounds)


![[DSC Europe 25] Dragana Ilic - AI for Big Data in Astronomy.pptx](https://cdn.slidesharecdn.com/ss_thumbnails/8palya86qaatvjhva1ms-2-dragana-ilic-ai-ilic-251208151906-652b819c-thumbnail.jpg?width=640&height=640&fit=bounds)


![[DSC Europe 25] Max Talanov - Non digital NNs.pptx](https://cdn.slidesharecdn.com/ss_thumbnails/wif8tr3gtua74qvtopke-non-digital-nns-251205090438-26b0eea6-thumbnail.jpg?width=640&height=640&fit=bounds)


![[DSC Europe 25] Goran Obradovic - The Rise of Sovereign AI: Building the Regi...](https://cdn.slidesharecdn.com/ss_thumbnails/7nw2xxixrxqdxvrb5wca-6-251205085714-ab09a2ac-thumbnail.jpg?width=640&height=640&fit=bounds)