Excessive underage drinking in the United States contributes to nearly 5,000 deaths per year among youth. While underage drinking is illegal, youth consume 20% of all alcohol in the US. Data from the 2007 Michigan Youth Tobacco Survey found that liquor was the most commonly consumed type of alcohol among Michigan youth, followed by beer and malt beverages. Liquor consumption increased with age and was highest among white students. The findings suggest policies are needed to reduce youth access to alcohol and excessive consumption, such as increased alcohol taxes and enforcement of laws against underage sales and purchase.
The rate of alcohol-related deaths has accelerated in recent years, according to a new analysis of U.S. mortality data between 2000-2016. Here's more:
•Overall trends: There were more than 425,000 alcohol-induced deaths during the study period. The annual percentage change in such deaths increased among both men and women, but rose significantly starting in 2012.
•Demographics: Starting in 2012, men experienced a 4.2% annual increase in alcohol-related deaths. From 2013-2016, women experienced an annual percentage increase of around 7%. American Indian and Alaska Native women experienced the highest increases over the 17-year study period.
•Causes: Alcoholic liver disease accounted for the majority of deaths among men and women, followed by mental or physical disorders due to alcohol and accidental poisoning.
Get your quality homework help now and stand out.Our professional writers are committed to excellence. We have trained the best scholars in different fields of study.Contact us now at premiumessays.net and place your order at affordable price done within set deadlines.We always have someone online ready to answer all your queries and take your requests.
Illegal Drug Problem in the City of Ormoc As Perceived By User and Non-User R...inventionjournals
The study was conducted primarily to: describe the socio-demographic characteristics of user and non-user respondents; determine the reasons for engaging in illegal drugs among user respondents; document local and national ordinances enacted against illegal drug users; and identify the programs implemented by government and non-government organizations to make the City of Ormoc a drug-free community. The results of the study revealed that the mean age of the illegal drug users was 22 years old. Majority of them were males whose income fell below P10,000.00 in the form of allowance. They were aware of the illegality of the drugs used. Marijuana was the dominant drug abused. Influence of Peers and Curiosity were the topmost reasons why they got into drugs due to misinformation and assurance from friends who claim to have enjoyed the experience as perceived by the respondents. Among the National and Local Ordinances enacted against illegal drugs users in the City of Ormoc were: the implementation of RA 9165 – Dangerous Drugs Act of 2002; LOI 36/97: ALPHA BANAT (Barangay Against Narcotics Abusers and Traffickers) and Information dissemination of the ill effects of drugs through the Barangay Anti-Drug Abuse Counsel (BADAC).
Presented by
Salim Chowdhury, MD - Community Care
Curtis Upsher, Jr. MS - Director Community Relations - Community Care
Medicine, Culture, and Spirituality Conference
September 9, 2011
A new data brief reports that deaths from drug abuse among millennials has increased by 400% in the past 20 years. The opioid crisis partly explains the increase, but millennials also face other problems, including high living costs. Here’s more on what the report calls “deaths of despair”:
•Drug deaths: The number of deaths among those in their 20s and 30s went up by 108% between 2007 and 2017.
•Alcohol-related deaths: These deaths in those aged 18-34 went up by nearly 70% between 2007 and 2017, and nearly doubled since 1999.
•Suicides: Between 2011 and 2016, suicide was the second leading cause of death among those aged 15-34, and the following year, suicide rates across all ages increased by 4%.
More young people in Canada are visiting EDs because of drinking alcoholΔρ. Γιώργος K. Κασάπης
More people are visiting emergency departments after drinking alcohol, a new study finds. Researchers looked at more than 765,000 ED visits in Ontario, Canada’s largest province, and found a 175% increase in such visits between 2003 and 2016 among 25- to 29-year-olds. That spiked to a 240% increase in alcohol-related ED visits for young women, who were also more likely than men to be under Canada’s legal drinking age of 19. For both young men and women, visiting the ED for alcohol-related problems also led to more hospital admissions than other types of ED visits. Other countries, including the U.S., have experienced similar increases in alcohol-related visits to the ED, the authors behind the new study write, urging more research into the reasons behind the growing trend.
Business magazine-style report on World Suicide Rate Analysis.
Andy Kirk's The Three Principles of Good Visualization Design was followed to create the report.
Tools used: RStudio, Tableau and Canva
Graphs plotted:
1) Map Chart is used to show the amount of suicide in each country
2) A horizontal bar graph is used to further compare the differences in suicide
counts in each country
3) A single line graph is used to show the amount of suicides committed each year
during the period 1985-2016
4) Stacked 100% Area graph is used to compare the suicide counts among
different age groups, namely 5-14 years,15-24 years, 25-34 years, 35-54 years,
55-74 years
5) Side by side bar chart is used to compare the number of suicide counts
among different age groups, sex-wise
6) A pie chart is used to see the composition of causes of deaths in the US in the year
2017
7) Bubble Chart is used to check out the methods by which people commit
suicide and to check which one causes the maximum death
8) A line graph is used to compare the Suicide count and happiness index for the years 2006 to 2015
9) The correlation matrix is used to find the correlation between different elements.
10) Side by side line graph is used to compare gender wise suicide
percentage in the US
11) Treemaps are used to see the composition of the number of suicides
among the states of US
12) Side by side area graph is used to see the availability of different drugs in the US
over time
A study published in the American Journal of Preventive Medicine today finds that more than 2 million Americans who misused opioids between 2012 and 2014 also identified as binge drinkers. Overall, binge drinkers had nearly twice the odds of misusing opioids compared to non-drinkers.
The finding alarmed researchers, who noted that one in five prescription opioid deaths in recent years also involved alcohol. "Combining alcohol and opioids can significantly increase the risk of overdoses and deaths," CDC Director Robert Redfield said in a statement.
A study which chillingly lays bare the “public health crisis” that arose over a decade in the United States because of excessive alcohol consumption has received severe criticism for relying on comprised data to arrive at that conclusion. It has been criticized by some experts and the Distilled Spirits Council (DSC) for being less consistent, and for not including young adults aged below 18 years, who are increasingly taking to alcohol in America.
Substance Abuse among Adolescents: 1. Prevalence and Patterns of Alcohol Use ...iosrphr_editor
The IOSR Journal of Pharmacy (IOSRPHR) is an open access online & offline peer reviewed international journal, which publishes innovative research papers, reviews, mini-reviews, short communications and notes dealing with Pharmaceutical Sciences( Pharmaceutical Technology, Pharmaceutics, Biopharmaceutics, Pharmacokinetics, Pharmaceutical/Medicinal Chemistry, Computational Chemistry and Molecular Drug Design, Pharmacognosy & Phytochemistry, Pharmacology, Pharmaceutical Analysis, Pharmacy Practice, Clinical and Hospital Pharmacy, Cell Biology, Genomics and Proteomics, Pharmacogenomics, Bioinformatics and Biotechnology of Pharmaceutical Interest........more details on Aim & Scope).
When people think of the word “alcoholic,” they generally come up with the image of a middle-aged man, divorced or facing divorce, probably also a smoker or illicit drug user. However, a study in 2001-2002 found that contrary to many people’s preconceptions, alcoholism takes on more varied forms and often starts young, around or before turning 20. Although alcoholism can develop differently, there are 5 main categories that individuals with alcoholism generally fall into. Learn about the characteristics of each group through this slide show. For more information about alcoholism recovery for anyone struggling with an alcohol addiction, contact an admissions counselor at Pyramid Healthcare: 1-888-694-9996.
When people think of the word “alcoholic,” they generally come up with the image of a middle-aged man, divorced or facing divorce, probably also a smoker or illicit drug user. However, a study in 2001-2002 found that contrary to many people’s preconceptions, alcoholism takes on more varied forms and often starts young, around or before turning 20. Although alcoholism can develop differently, there are 5 main categories that individuals with alcoholism generally fall into. Learn about the characteristics of each group through this slide show. For more information about alcoholism recovery for anyone struggling with an alcohol addiction, contact an admissions counselor at Pyramid Healthcare: 1-888-694-9996.
Missouri legislators weren't resonating with the previous 40-page and outdated white paper, so we updated its statistics, condensed it to 10-pages and added inforgraphics to make it more visually engaging.
Alcohol misuse and older people- Conor Breen, CARDIRoger O'Sullivan
Many public health campaigns on the misuse of alcohol are aimed at younger age groups. However, there is evidence that alcohol misuse is increasing in people over the age of 65. For a variety of reasons, alcohol misuse among these older people may go unnoticed (Department of Work and Pensions, 2013).
This edition of the CARDI “Focus on . . .” series looks at alcohol misuse among older people across the island of Ireland and asks if more could be done in policy and social work terms to address the associated health and welfare issues among older age groups.
The prostate is an exocrine gland of the male mammalian reproductive system
It is a walnut-sized gland that forms part of the male reproductive system and is located in front of the rectum and just below the urinary bladder
Function is to store and secrete a clear, slightly alkaline fluid that constitutes 10-30% of the volume of the seminal fluid that along with the spermatozoa, constitutes semen
A healthy human prostate measures (4cm-vertical, by 3cm-horizontal, 2cm ant-post ).
It surrounds the urethra just below the urinary bladder. It has anterior, median, posterior and two lateral lobes
It’s work is regulated by androgens which are responsible for male sex characteristics
Generalised disease of the prostate due to hormonal derangement which leads to non malignant enlargement of the gland (increase in the number of epithelial cells and stromal tissue)to cause compression of the urethra leading to symptoms (LUTS
Prix Galien International 2024 Forum ProgramLevi Shapiro
June 20, 2024, Prix Galien International and Jerusalem Ethics Forum in ROME. Detailed agenda including panels:
- ADVANCES IN CARDIOLOGY: A NEW PARADIGM IS COMING
- WOMEN’S HEALTH: FERTILITY PRESERVATION
- WHAT’S NEW IN THE TREATMENT OF INFECTIOUS,
ONCOLOGICAL AND INFLAMMATORY SKIN DISEASES?
- ARTIFICIAL INTELLIGENCE AND ETHICS
- GENE THERAPY
- BEYOND BORDERS: GLOBAL INITIATIVES FOR DEMOCRATIZING LIFE SCIENCE TECHNOLOGIES AND PROMOTING ACCESS TO HEALTHCARE
- ETHICAL CHALLENGES IN LIFE SCIENCES
- Prix Galien International Awards Ceremony
ARTIFICIAL INTELLIGENCE IN HEALTHCARE.pdfAnujkumaranit
Artificial intelligence (AI) refers to the simulation of human intelligence processes by machines, especially computer systems. It encompasses tasks such as learning, reasoning, problem-solving, perception, and language understanding. AI technologies are revolutionizing various fields, from healthcare to finance, by enabling machines to perform tasks that typically require human intelligence.
Title: Sense of Smell
Presenter: Dr. Faiza, Assistant Professor of Physiology
Qualifications:
MBBS (Best Graduate, AIMC Lahore)
FCPS Physiology
ICMT, CHPE, DHPE (STMU)
MPH (GC University, Faisalabad)
MBA (Virtual University of Pakistan)
Learning Objectives:
Describe the primary categories of smells and the concept of odor blindness.
Explain the structure and location of the olfactory membrane and mucosa, including the types and roles of cells involved in olfaction.
Describe the pathway and mechanisms of olfactory signal transmission from the olfactory receptors to the brain.
Illustrate the biochemical cascade triggered by odorant binding to olfactory receptors, including the role of G-proteins and second messengers in generating an action potential.
Identify different types of olfactory disorders such as anosmia, hyposmia, hyperosmia, and dysosmia, including their potential causes.
Key Topics:
Olfactory Genes:
3% of the human genome accounts for olfactory genes.
400 genes for odorant receptors.
Olfactory Membrane:
Located in the superior part of the nasal cavity.
Medially: Folds downward along the superior septum.
Laterally: Folds over the superior turbinate and upper surface of the middle turbinate.
Total surface area: 5-10 square centimeters.
Olfactory Mucosa:
Olfactory Cells: Bipolar nerve cells derived from the CNS (100 million), with 4-25 olfactory cilia per cell.
Sustentacular Cells: Produce mucus and maintain ionic and molecular environment.
Basal Cells: Replace worn-out olfactory cells with an average lifespan of 1-2 months.
Bowman’s Gland: Secretes mucus.
Stimulation of Olfactory Cells:
Odorant dissolves in mucus and attaches to receptors on olfactory cilia.
Involves a cascade effect through G-proteins and second messengers, leading to depolarization and action potential generation in the olfactory nerve.
Quality of a Good Odorant:
Small (3-20 Carbon atoms), volatile, water-soluble, and lipid-soluble.
Facilitated by odorant-binding proteins in mucus.
Membrane Potential and Action Potential:
Resting membrane potential: -55mV.
Action potential frequency in the olfactory nerve increases with odorant strength.
Adaptation Towards the Sense of Smell:
Rapid adaptation within the first second, with further slow adaptation.
Psychological adaptation greater than receptor adaptation, involving feedback inhibition from the central nervous system.
Primary Sensations of Smell:
Camphoraceous, Musky, Floral, Pepperminty, Ethereal, Pungent, Putrid.
Odor Detection Threshold:
Examples: Hydrogen sulfide (0.0005 ppm), Methyl-mercaptan (0.002 ppm).
Some toxic substances are odorless at lethal concentrations.
Characteristics of Smell:
Odor blindness for single substances due to lack of appropriate receptor protein.
Behavioral and emotional influences of smell.
Transmission of Olfactory Signals:
From olfactory cells to glomeruli in the olfactory bulb, involving lateral inhibition.
Primitive, less old, and new olfactory systems with different path
micro teaching on communication m.sc nursing.pdfAnurag Sharma
Microteaching is a unique model of practice teaching. It is a viable instrument for the. desired change in the teaching behavior or the behavior potential which, in specified types of real. classroom situations, tends to facilitate the achievement of specified types of objectives.
263778731218 Abortion Clinic /Pills In Harare ,sisternakatoto
263778731218 Abortion Clinic /Pills In Harare ,ABORTION WOMEN’S CLINIC +27730423979 IN women clinic we believe that every woman should be able to make choices in her pregnancy. Our job is to provide compassionate care, safety,affordable and confidential services. That’s why we have won the trust from all generations of women all over the world. we use non surgical method(Abortion pills) to terminate…Dr.LISA +27730423979women Clinic is committed to providing the highest quality of obstetrical and gynecological care to women of all ages. Our dedicated staff aim to treat each patient and her health concerns with compassion and respect.Our dedicated group ABORTION WOMEN’S CLINIC +27730423979 IN women clinic we believe that every woman should be able to make choices in her pregnancy. Our job is to provide compassionate care, safety,affordable and confidential services. That’s why we have won the trust from all generations of women all over the world. we use non surgical method(Abortion pills) to terminate…Dr.LISA +27730423979women Clinic is committed to providing the highest quality of obstetrical and gynecological care to women of all ages. Our dedicated staff aim to treat each patient and her health concerns with compassion and respect.Our dedicated group of receptionists, nurses, and physicians have worked together as a teamof receptionists, nurses, and physicians have worked together as a team wwww.lisywomensclinic.co.za/
Title: Sense of Taste
Presenter: Dr. Faiza, Assistant Professor of Physiology
Qualifications:
MBBS (Best Graduate, AIMC Lahore)
FCPS Physiology
ICMT, CHPE, DHPE (STMU)
MPH (GC University, Faisalabad)
MBA (Virtual University of Pakistan)
Learning Objectives:
Describe the structure and function of taste buds.
Describe the relationship between the taste threshold and taste index of common substances.
Explain the chemical basis and signal transduction of taste perception for each type of primary taste sensation.
Recognize different abnormalities of taste perception and their causes.
Key Topics:
Significance of Taste Sensation:
Differentiation between pleasant and harmful food
Influence on behavior
Selection of food based on metabolic needs
Receptors of Taste:
Taste buds on the tongue
Influence of sense of smell, texture of food, and pain stimulation (e.g., by pepper)
Primary and Secondary Taste Sensations:
Primary taste sensations: Sweet, Sour, Salty, Bitter, Umami
Chemical basis and signal transduction mechanisms for each taste
Taste Threshold and Index:
Taste threshold values for Sweet (sucrose), Salty (NaCl), Sour (HCl), and Bitter (Quinine)
Taste index relationship: Inversely proportional to taste threshold
Taste Blindness:
Inability to taste certain substances, particularly thiourea compounds
Example: Phenylthiocarbamide
Structure and Function of Taste Buds:
Composition: Epithelial cells, Sustentacular/Supporting cells, Taste cells, Basal cells
Features: Taste pores, Taste hairs/microvilli, and Taste nerve fibers
Location of Taste Buds:
Found in papillae of the tongue (Fungiform, Circumvallate, Foliate)
Also present on the palate, tonsillar pillars, epiglottis, and proximal esophagus
Mechanism of Taste Stimulation:
Interaction of taste substances with receptors on microvilli
Signal transduction pathways for Umami, Sweet, Bitter, Sour, and Salty tastes
Taste Sensitivity and Adaptation:
Decrease in sensitivity with age
Rapid adaptation of taste sensation
Role of Saliva in Taste:
Dissolution of tastants to reach receptors
Washing away the stimulus
Taste Preferences and Aversions:
Mechanisms behind taste preference and aversion
Influence of receptors and neural pathways
Impact of Sensory Nerve Damage:
Degeneration of taste buds if the sensory nerve fiber is cut
Abnormalities of Taste Detection:
Conditions: Ageusia, Hypogeusia, Dysgeusia (parageusia)
Causes: Nerve damage, neurological disorders, infections, poor oral hygiene, adverse drug effects, deficiencies, aging, tobacco use, altered neurotransmitter levels
Neurotransmitters and Taste Threshold:
Effects of serotonin (5-HT) and norepinephrine (NE) on taste sensitivity
Supertasters:
25% of the population with heightened sensitivity to taste, especially bitterness
Increased number of fungiform papillae
HOT NEW PRODUCT! BIG SALES FAST SHIPPING NOW FROM CHINA!! EU KU DB BK substit...GL Anaacs
Contact us if you are interested:
Email / Skype : kefaya1771@gmail.com
Threema: PXHY5PDH
New BATCH Ku !!! MUCH IN DEMAND FAST SALE EVERY BATCH HAPPY GOOD EFFECT BIG BATCH !
Contact me on Threema or skype to start big business!!
Hot-sale products:
NEW HOT EUTYLONE WHITE CRYSTAL!!
5cl-adba precursor (semi finished )
5cl-adba raw materials
ADBB precursor (semi finished )
ADBB raw materials
APVP powder
5fadb/4f-adb
Jwh018 / Jwh210
Eutylone crystal
Protonitazene (hydrochloride) CAS: 119276-01-6
Flubrotizolam CAS: 57801-95-3
Metonitazene CAS: 14680-51-4
Payment terms: Western Union,MoneyGram,Bitcoin or USDT.
Deliver Time: Usually 7-15days
Shipping method: FedEx, TNT, DHL,UPS etc.Our deliveries are 100% safe, fast, reliable and discreet.
Samples will be sent for your evaluation!If you are interested in, please contact me, let's talk details.
We specializes in exporting high quality Research chemical, medical intermediate, Pharmaceutical chemicals and so on. Products are exported to USA, Canada, France, Korea, Japan,Russia, Southeast Asia and other countries.
Explore natural remedies for syphilis treatment in Singapore. Discover alternative therapies, herbal remedies, and lifestyle changes that may complement conventional treatments. Learn about holistic approaches to managing syphilis symptoms and supporting overall health.
Acute scrotum is a general term referring to an emergency condition affecting the contents or the wall of the scrotum.
There are a number of conditions that present acutely, predominantly with pain and/or swelling
A careful and detailed history and examination, and in some cases, investigations allow differentiation between these diagnoses. A prompt diagnosis is essential as the patient may require urgent surgical intervention
Testicular torsion refers to twisting of the spermatic cord, causing ischaemia of the testicle.
Testicular torsion results from inadequate fixation of the testis to the tunica vaginalis producing ischemia from reduced arterial inflow and venous outflow obstruction.
The prevalence of testicular torsion in adult patients hospitalized with acute scrotal pain is approximately 25 to 50 percent
1. Excessive alcohol consumption contributes to an average
of approximately 4,700 deaths among underage youth in
the United States each year (e.g., from homicides,
motor-vehicle crashes, and suicides) and an average of 60
years of life lost per death.1
Although drinking by underage
persons (<21 years) is illegal in every state, youth aged
12-20 years drink nearly 20% of all the alcohol consumed
in the United States.2
In 2005, a preliminary series of
questions assessing the type of alcohol usually consumed
were added to the Youth Risk Behavior Survey in
Arkansas, Nebraska, New Mexico & Wyoming to obtain
information on underage drinking. However, little is known
about the specific types of alcoholic beverages currently
consumed by Michigan youth. These data are important
because numerous evidence-based strategies for reducing
underage drinking rates are beverage-specific, including
increasing alcohol excise taxes and increasing restrictions
on the distribution and sale of alcoholic beverages.3
Data from the 2007 Michigan Youth Tobacco Survey
(MiYTS) can be used to determine the type of alcohol
consumed in Michigan’s teenagers. Among YTS
respondents, the overall proportion of non-drinkers was
59.0%, while 41.0% of respondents reported being current
drinkers and 31.3% reporting binge drinking. Overall, high
school males and females had similar prevalence of
current (40.8% of males and 41.3% of females) & binge (32.1%
of males and 30.4% of females) drinkers.
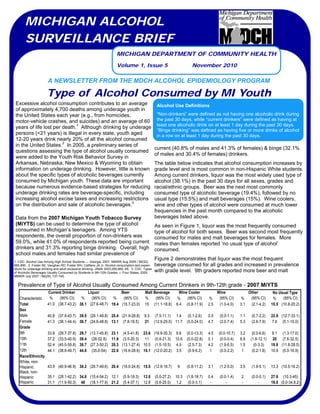
The table below indicates that alcohol consumption increases by
grade level and is most common in non-Hispanic White students.
Among current drinkers, liquor was the most widely used type of
alcohol (38.1%) in the past 30 days for all sexes, grades and
racial/ethnic groups. Beer was the next most commonly
consumed type of alcoholic beverage (19.4%), followed by no
usual type (15.5%) and malt beverages (15%). Wine coolers,
wine and other types of alcohol were consumed at much lower
frequencies in the past month compared to the alcoholic
beverages listed above.
As seen in Figure 1, liquor was the most frequently consumed
type of alcohol for both sexes. Beer was second most frequently
consumed for males and malt beverages for females. More
males than females reported ‘no usual type of alcohol’
consumed.
Figure 2 demonstrates that liquor was the most frequent
beverage consumed for all grades and increased in prevalence
with grade level. 9th graders reported more beer and malt
MICHIGAN DEPARTMENT OF COMMUNITY HEALTH
November 2010Volume 1, Issue 5
MICHIGAN ALCOHOL
SURVEILLANCE BRIEF
Type of Alcohol Consumed by MI Youth
A NEWSLETTER FROM THE MDCH ALCOHOL EPIDEMIOLOGY PROGRAM
Alcohol Use Definitions
“Non-drinkers” were defined as not having one alcoholic drink during
the past 30 days, while “current drinkers” were defined as having at
least one alcoholic drink on at least 1 day during the past 30 days.
“Binge drinking” was defined as having five or more drinks of alcohol
in a row on at least 1 day during the past 30 days.
Prevalence of Type of Alcohol Usually Consumed Among Current Drinkers in 9th-12th grade - 2007 MiYTS
1. CDC. Alcohol Use Among High School Students --- Georgia, 2007. MMWR Aug 3009 / 58(32);
885-890. 2. Foster SE, Vaughan RD, Foster WH, Califano JA Jr. Alcohol consumption and expen-
diture for underage drinking and adult excessive drinking. JAMA 2003;289:989--95. 3. CDC. Types
of Alcoholic Beverages Usually Consumed by Students in 9th-12th Grades — Four States, 2005.
MMWR July 2007 / 56(29); 737-740.
Characteristic % (95% CI) % (95% CI) % (95% CI) % (95% CI) % (95% CI) % (95% CI) % (95% CI) % (95% CI)
Total 41.0 (38.7-43.2) 38.1 (27.6-48.7) 19.4 (15.7-23.0) 15 (11.1-18.8) 6.4 (0.8-11.9) 2.5 (1.0-4.0) 3.1 (2.1-4.2) 15.5 (10.8-20.2)
Sex
Male 40.8 (37.9-43.7) 39.5 (29.1-49.8) 25.4 (21.9-28.8) 9.3 (7.5-11.1) 1.4 (0.1-2.6) 0.5 (0.0-1.1) 1.1 (0.7-2.2) 22.9 (12.7-33.1)
Female 41.3 (38.1-44.4) 36.7 (24.6-48.8) 13.1 (7.8-18.5) 21 (12.9-29.0) 11.7 (0.0-24.0) 4.7 (2.0-7.4) 5.3 (2.6-7.9) 7.6 (5.1-10.0)
Grade
9th 33.8 (29.7-37.8) 29.7 (13.7-45.8) 23.1 (4.5-41.8) 23.6 (16.9-30.3) 6.6 (0.0-13.3) 4.5 (0.0-10.7) 3.2 (0.0-6.6) 9.1 (1.3-17.0)
10th 37.2 (33.5-40.9) 39.4 (26-52.8) 11.9 (3.5-20.3) 11 (0.8-21.3) 10.6 (0.0-22.8) 0.1 (0.0-0.4) 6.9 (1.8-12.1) 20 (7.6-32.5)
11th 52.4 (45.0-59.8) 38.7 (27.3-50.2) 20.3 (13.1-27.4) 10.5 (1.5-19.5) 4.9 (2.5-7.3) 4.2 (1.9-6.5) 1.5 (0-3.3) 19.8 (11.8-28.5)
12th 44.1 (38.6-49.7) 44.8 (35.6-54) 22.6 (16.6-28.6) 16.1 (12.0-20.2) 3.5 (0.9-6.2) 1 (0.0-2.2) 1 (0.2-1.8) 10.9 (5.0-16.9)
Race/Ethnicity
White, non-
Hispanic 43.9 (40.9-46.9) 38.2 (26.7-49.6) 20.4 (16.0-24.8) 15.5 (12.9-18.7) 6 (0.8-11.2) 3.1 (1.2-5.0) 3.5 (1.9-5.1) 13.3 (10.5-16.2)
Black, non-
Hispanic 35.1 (28.1-42.2) 34.8 (15.4-54.2) 12.1 (5.9-18.3) 12.8 (0.0-27.2) 10.3 (1.8-18.7) 0.4 (0.0-1.4) 2 (0.0-5.1) 27.6 (10.3-45)
Hispanic 31.1 (11.9-50.3) 48 (18.1-77.9) 21.2 (5.4-37.1) 12.8 (0.6-25.0) 1.2 (0.0-3.1) - - - - 16.8 (0.0-34.8.2)
Current Drinker Liquor Beer Malt Beverage Wine Cooler Wine Other No Usual Type
2. beverage than older students. Liquor was the most
frequently consumed type of alcohol for all racial/ethnic
groups. Hispanics reported higher liquor consumption
prevalence than non-Hispanic Whites and Blacks. Beer
was the second most commonly consumed beverage for
non-Hispanic Whites and Hispanics, while for
non-Hispanic Blacks, ‘no usual type’ was second most
frequent. Consumption of wine and other types of alcohol
were reported at very small frequencies for all sexes,
grades and racial/ethnic groups.
In 2007, liquor was the most prevalent type of alcohol
usually consumed by students in 9th
-12th
grades reporting
current alcohol use in Michigan. It also was the most
prevalent type across sex, grade and racial/ethnic groups.
Binge drinkers reported the same preference in types of
alcoholic beverages as current drinkers. Liquor use was
reported at higher percentages by binge drinkers than
current drinkers (data not shown.) This report provides
convincing evidence of the need for policies and
interventions to reduce the accessibility of alcohol by
Michigan youth and the excessive consumption of
alcohol. Understanding beverage type and brand
consumption preferences are crucial in developing
targeted interventions for youth.
This report’s findings are similar to the 2005 MMWR
“Types of Alcoholic Beverages Usually Consumed by
Students in 9th--12th Grades --- Four States”.4
Previous
studies provide consistent evidence that increases in
alcohol prices and alcohol taxes are associated with
decreases in both excessive alcohol consumption and
related harms, such as alcohol-impaired driving,
non–motor vehicle mortality outcomes, and violence
outcomes.1
Alcohol excise taxes and greater
enforcement of laws prohibiting sales to minors and
prohibiting adults from supplying alcohol to underage
youth would help to reduce the excessive alcohol
consumption patterns reported in Michigan high school
students.
Type of Alcohol Consumed by MI Youth (Cont)
Page 2MICHIGAN ALCOHOL SURVEILLANCE BRIEF
Figure 1. Type of Alcohol Consumed by Current Drinkers by Sex
The 2007 Michigan Youth Tobacco Survey was designed by the Centers for Disease Control and Prevention for Michigan Department of Education and
MDCH as part of the National Youth Tobacco Survey (NYTS). The Michigan YTS was completed by 2,645 13- to 18- year old students in grades 9-12
in 53 public high schools in Michigan during the 2007 academic school year. The 2007 overall response rate in Michigan was 69% compared to the
2006 national overall response rate of 80%. Prevalence estimates are representative of all students in grades 9-12 attending public schools in the state
of Michigan. For more information on the YTS, visit: http://www.cdc.gov/tobacco/data_statistics/surveys/nyts/index.htm
Suggested citation: Gonzales K, Boynton K, Cameron L. Type of Alcohol Consumed by Michigan Youth. Michigan Alcohol Surveillance Brief.
Vol. 1, No. 5. Lansing, MI: Michigan Department of Community Health, Bureau of Epidemiology and Division of Genomics, Perinatal Health, and
Chronic Disease Epidemiology, November 2010.
Figure 2. Type of Alcohol Consumed by Current Drinkers by Grade
Figure 3. Type of Alcohol Consumed by Current Drinkers by Race/Ethnicity
4. MMWR July 2007 / 56(29); 737-740 (http://www.cdc.gov/mmwr/preview/mmwrhtml/
mm5629a3.htm) 5. The Community Guide. Preventing Excessive Alcohol Consumption:
Increasing Alcohol Taxes. Available at: http://www.thecommunityguide.org/alcohol/index.html
0
5
10
15
20
25
30
35
40
45
50
Liquor Beer Malt
Beverage
Wine
Cooler
Wine Other No Usual
Type
Percentage 9th
10th
11th
12th
0
5
10
15
20
25
30
35
40
45
50
Liquor Beer Malt
Beverage
Wine
Cooler
Wine Other No Usual
Type
Percentage
Male
Female
0
5
10
15
20
25
30
35
40
45
50
Liquor Beer Malt
Beverage
Wine
Cooler
Wine Other No Usual
Type
Percentage
White, non-Hispanic
Black, non-Hispanic
Hispanic