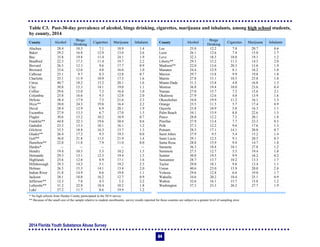
This document provides a summary of the 2014 Florida Youth Substance Abuse Survey. Some key findings include:
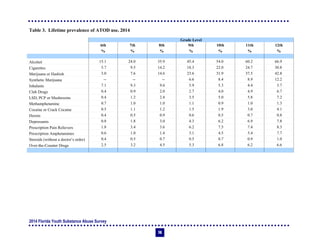
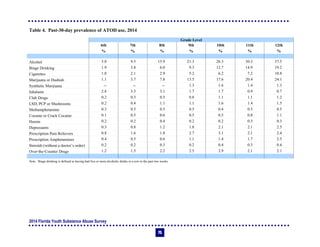
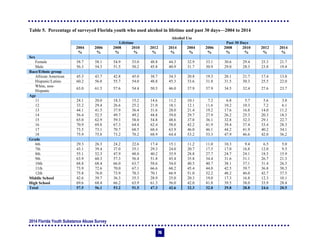
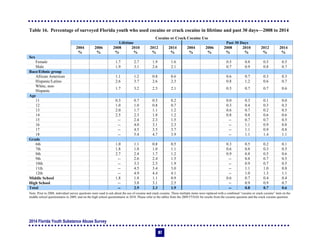
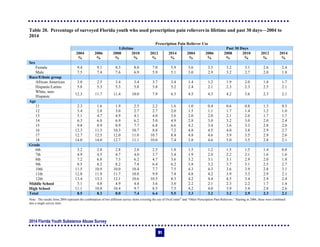
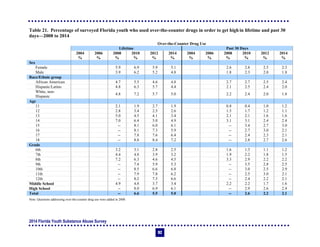
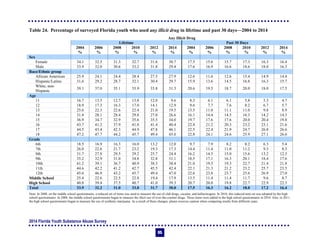
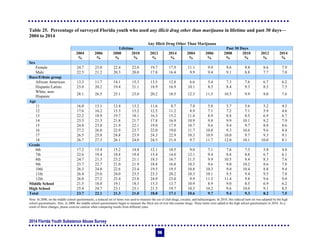
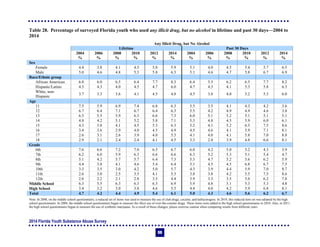
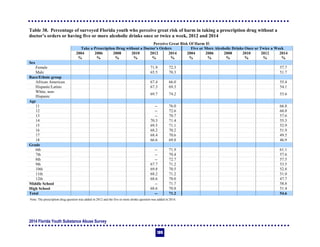
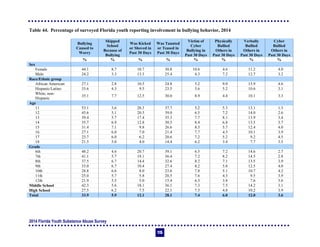
- Alcohol, cigarette, and other drug use among Florida youth has declined significantly over the past decade.
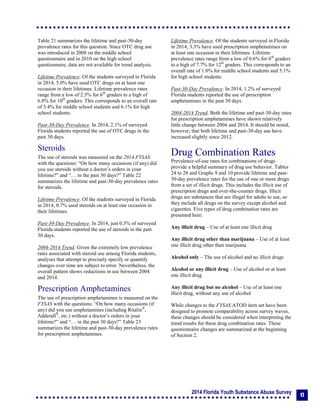
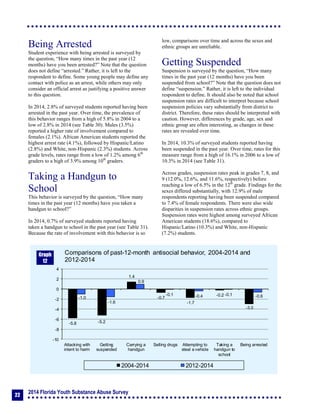
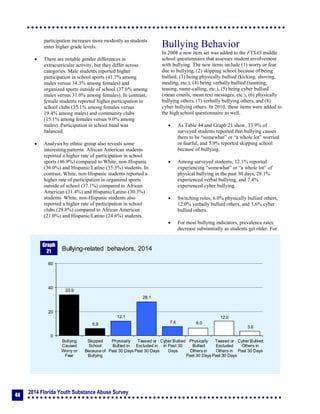
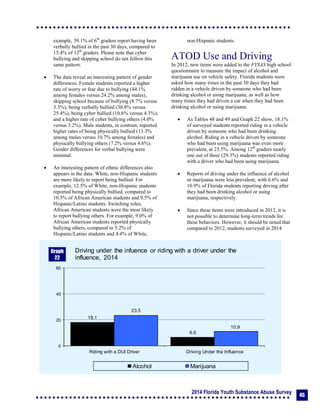
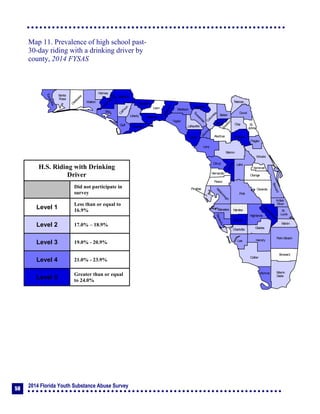
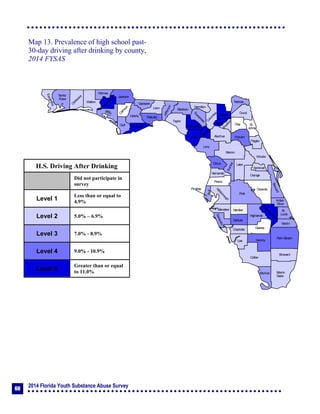
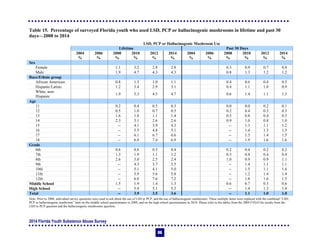
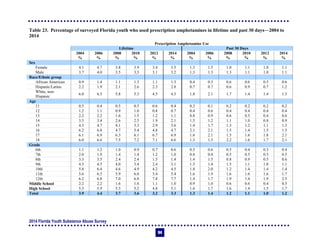
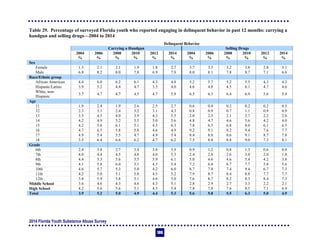
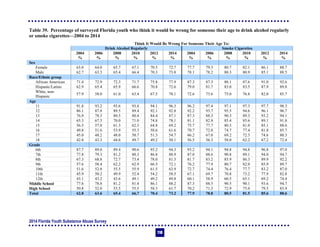
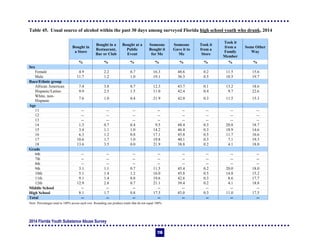
- However, high-risk drinking behaviors such as binge drinking and riding with drunk drivers remain problems.
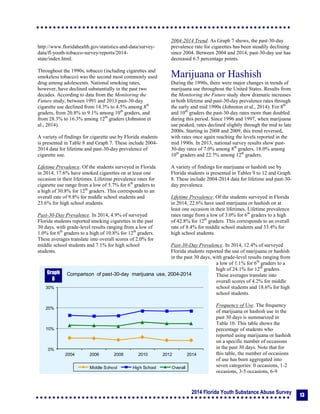
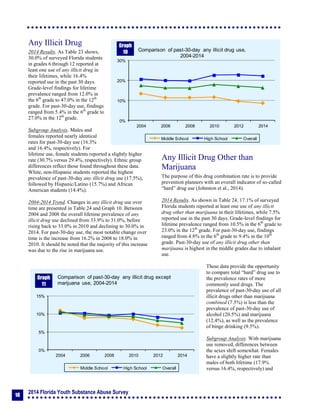
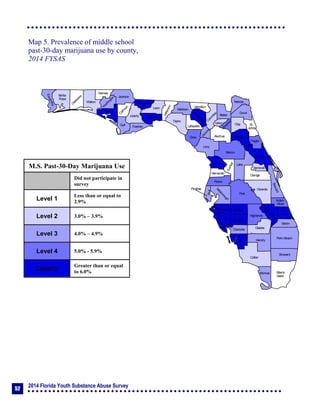
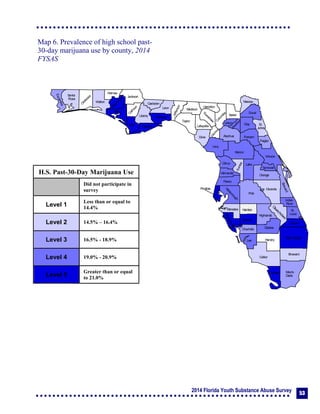
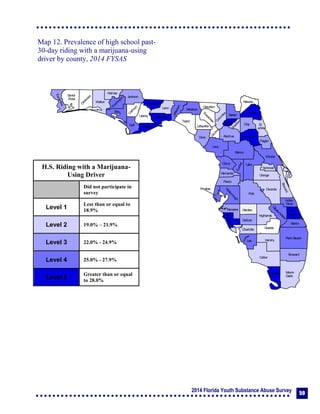
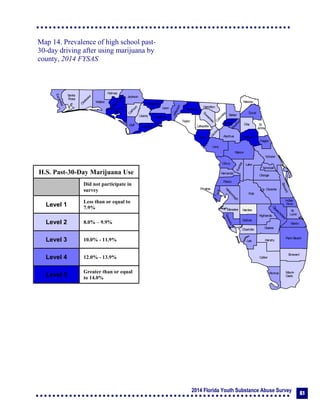
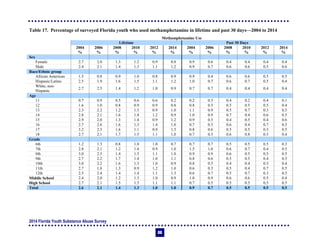
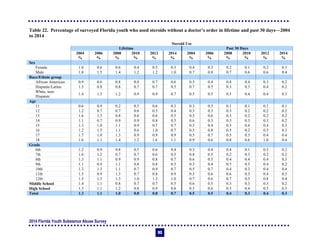
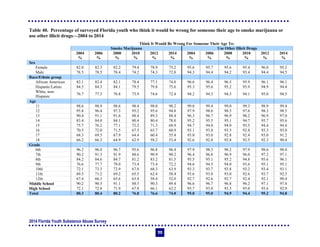
- Marijuana use has remained fairly constant while use of other drugs is very low.
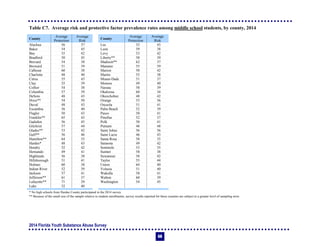
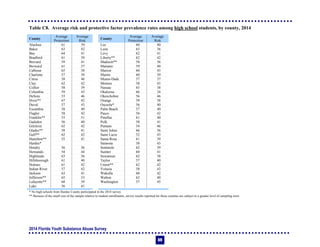
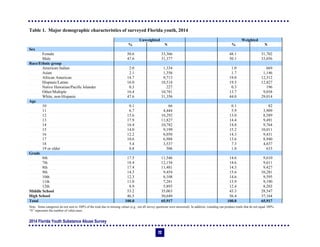
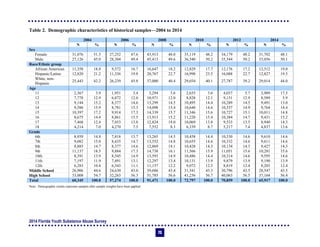
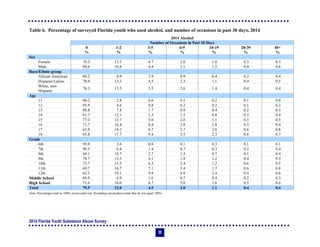
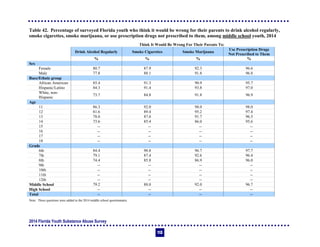
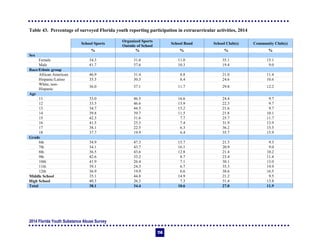
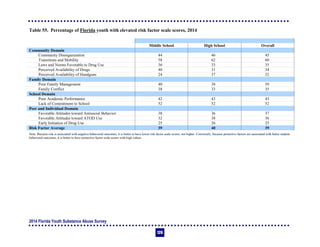
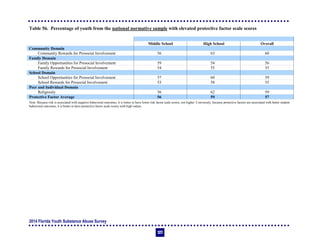
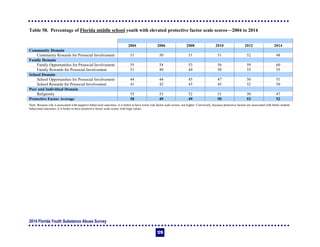
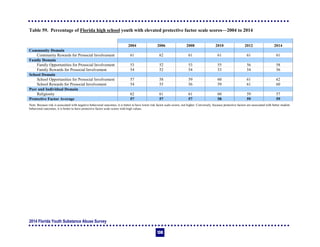
- Strong school and community participation in the survey provided a highly representative statewide sample.
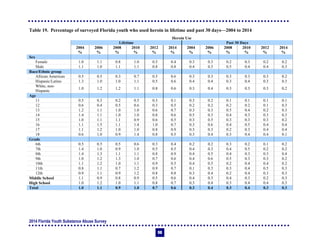
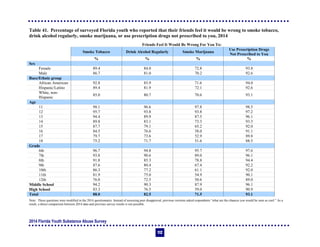
- Florida youth generally disapprove of substance use and perceive significant health risks from cigarettes.


![ONFH[AVN HIP] -TRIPLE REGIME -A NOVAL SURGICAL CONCEPT .pptx](https://cdn.slidesharecdn.com/ss_thumbnails/onfhavnhip2026koaconcalicutdrgokuldevdrmashraf-260210064517-213ec005-thumbnail.jpg?width=640&height=640&fit=bounds)


