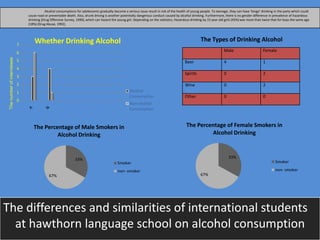
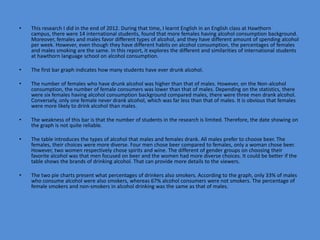
The differences and similarities of international students
at hawthorn language school on alcohol consumption
0
1
2
3
4
5
6
7
Thenumberofinterviewee
Whether Drinking Alcohol
Alcohol
Consumption
Non-alcohol
Consumption
Male Female
Beer 4 1
Spirits 0 2
Wine 0 2
Other 0 0
The Types of Drinking Alcohol
33%
67%
The Percentage of Male Smokers in
Alcohol Drinking
Smoker
non- smoker
33%
67%
The Percentage of Female Smokers in
Alcohol Drinking
Smoker
non- smoker
Alcohol consumptions for adolescents gradually become a serious issue result in risk of the health of young people. To teenage, they can have ‘binge’ drinking in the party which could
cause road or preventable death. Also, drunk driving is another potentially dangerous conduct caused by alcohol drinking. Furthermore, there is no gender difference in prevalence of hazardous
drinking (Drug Offensive Survey, 1990), which can hazard the young girl. Depending on the statistics, Hazardous drinking by 15 year old girls (45%) was more than twice that for boys the same age
(18%) (Drug Abuse, 1992).
• This research I did in the end of 2012. During that time, I learnt English in an English class at Hawthorn
campus, there were 14 international students, found that more females having alcohol consumption background.
Moreover, females and males favor different types of alcohol, and they have different amount of spending alcohol
per week. However, even though they have different habits on alcohol consumption, the percentages of females
and males smoking are the same. In this report, it explores the different and similarities of international students
at hawthorn language school on alcohol consumption.
• The first bar graph indicates how many students have ever drunk alcohol.
• The number of females who have drunk alcohol was higher than that of males. However, on the Non-alcohol
consumption, the number of female consumers was lower than that of males. Depending on the statistics, there
were six females having alcohol consumption background compared males, there were three men drank alcohol.
Conversely, only one female never drank alcohol, which was far less than that of males. It is obvious that females
were more likely to drink alcohol than males.
• The weakness of this bar is that the number of students in the research is limited. Therefore, the date showing on
the graph is not quite reliable.
• The table introduces the types of alcohol that males and females drank. All males prefer to choose beer. The
females, their choices were more diverse. Four men chose beer compared to females, only a woman chose beer.
However, two women respectively chose spirits and wine. The different of gender groups on choosing their
favorite alcohol was that men focused on beer and the women had more diverse choices. It could be better if the
table shows the brands of drinking alcohol. That can provide more details to the viewers.
• The two pie charts present what percentages of drinkers also smokers. According to the graph, only 33% of males
who consume alcohol were also smokers, whereas 67% alcohol consumers were not smokers. The percentage of
female smokers and non-smokers in alcohol drinking was the same as that of males.

Powerpoint

  • 1.
    The differences andsimilarities of international students at hawthorn language school on alcohol consumption 0 1 2 3 4 5 6 7 Thenumberofinterviewee Whether Drinking Alcohol Alcohol Consumption Non-alcohol Consumption Male Female Beer 4 1 Spirits 0 2 Wine 0 2 Other 0 0 The Types of Drinking Alcohol 33% 67% The Percentage of Male Smokers in Alcohol Drinking Smoker non- smoker 33% 67% The Percentage of Female Smokers in Alcohol Drinking Smoker non- smoker Alcohol consumptions for adolescents gradually become a serious issue result in risk of the health of young people. To teenage, they can have ‘binge’ drinking in the party which could cause road or preventable death. Also, drunk driving is another potentially dangerous conduct caused by alcohol drinking. Furthermore, there is no gender difference in prevalence of hazardous drinking (Drug Offensive Survey, 1990), which can hazard the young girl. Depending on the statistics, Hazardous drinking by 15 year old girls (45%) was more than twice that for boys the same age (18%) (Drug Abuse, 1992).
  • 2.
    • This researchI did in the end of 2012. During that time, I learnt English in an English class at Hawthorn campus, there were 14 international students, found that more females having alcohol consumption background. Moreover, females and males favor different types of alcohol, and they have different amount of spending alcohol per week. However, even though they have different habits on alcohol consumption, the percentages of females and males smoking are the same. In this report, it explores the different and similarities of international students at hawthorn language school on alcohol consumption. • The first bar graph indicates how many students have ever drunk alcohol. • The number of females who have drunk alcohol was higher than that of males. However, on the Non-alcohol consumption, the number of female consumers was lower than that of males. Depending on the statistics, there were six females having alcohol consumption background compared males, there were three men drank alcohol. Conversely, only one female never drank alcohol, which was far less than that of males. It is obvious that females were more likely to drink alcohol than males. • The weakness of this bar is that the number of students in the research is limited. Therefore, the date showing on the graph is not quite reliable. • The table introduces the types of alcohol that males and females drank. All males prefer to choose beer. The females, their choices were more diverse. Four men chose beer compared to females, only a woman chose beer. However, two women respectively chose spirits and wine. The different of gender groups on choosing their favorite alcohol was that men focused on beer and the women had more diverse choices. It could be better if the table shows the brands of drinking alcohol. That can provide more details to the viewers. • The two pie charts present what percentages of drinkers also smokers. According to the graph, only 33% of males who consume alcohol were also smokers, whereas 67% alcohol consumers were not smokers. The percentage of female smokers and non-smokers in alcohol drinking was the same as that of males.