This document provides a summary of the 2012 Florida Youth Substance Abuse Survey. Some key points:
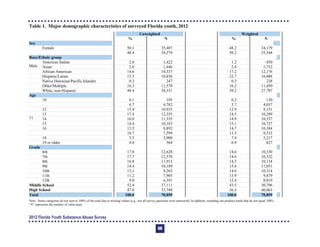
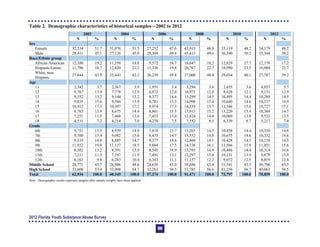
- Over 70,000 students from 746 schools participated in the survey about their substance use.
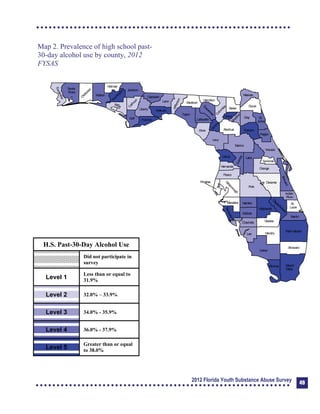
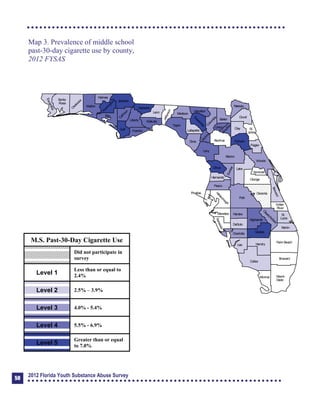
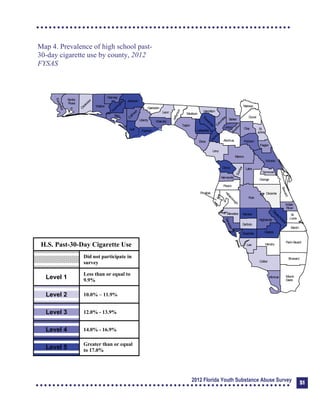
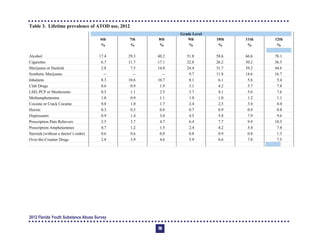
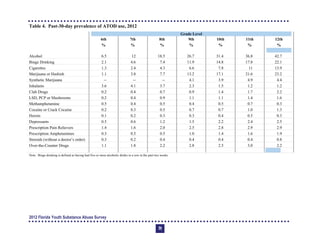
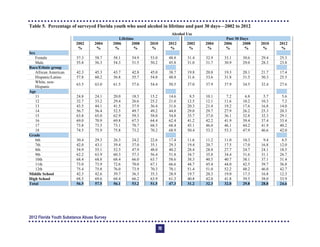
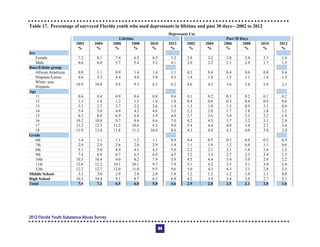
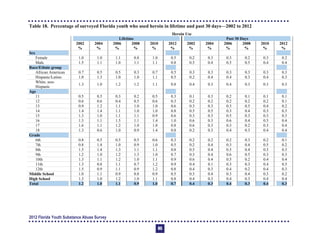
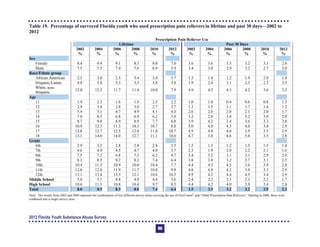
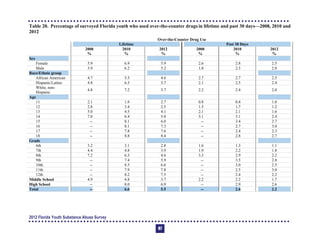
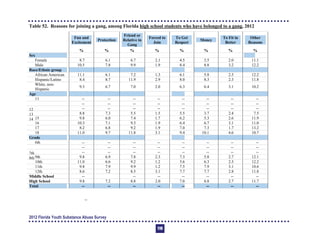
- Strengths included declining rates of alcohol, cigarette, and other drug use compared to past years. Rates of inhalants, club drugs, and less common drugs remained low.
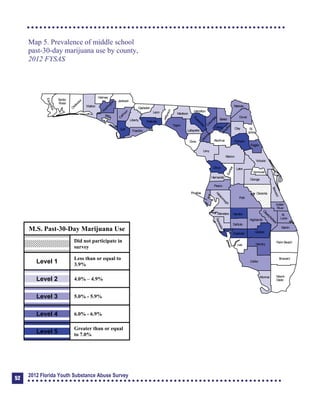
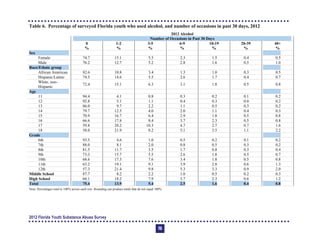
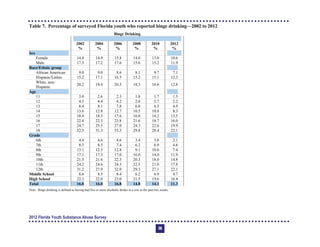
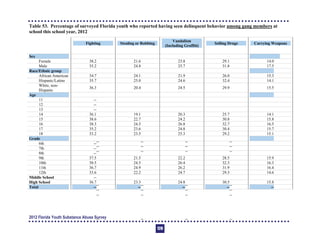
- Opportunities for improvement included alcohol and marijuana remaining the most commonly used substances. Rates of binge drinking and synthetic marijuana use were increasing. Perceived risks of drug use were declining.
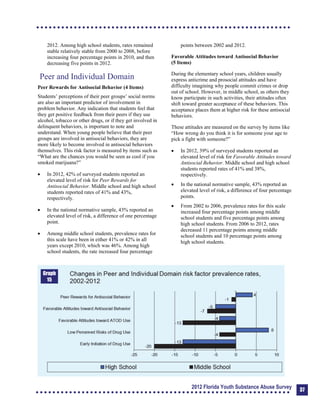
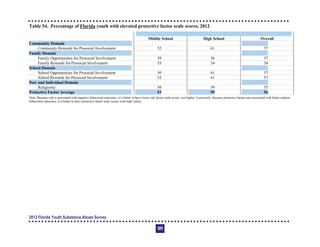
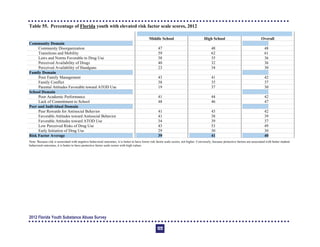
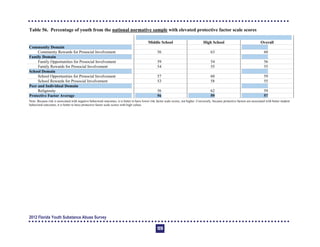
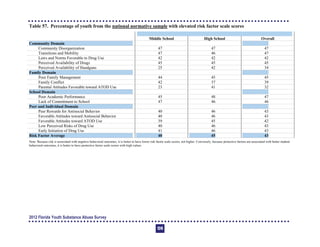
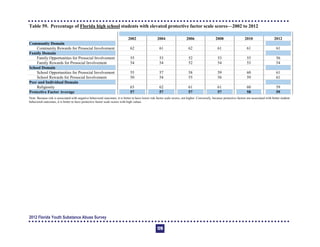
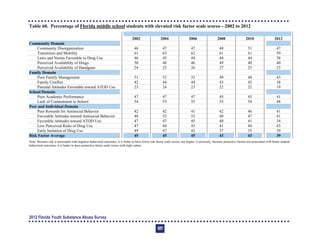
- The survey assessed risk and protective factors and how they correlated with substance use. Factors like family and community support