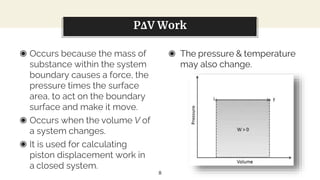
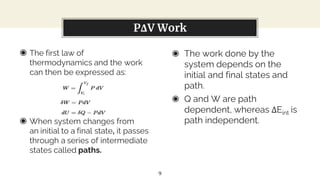
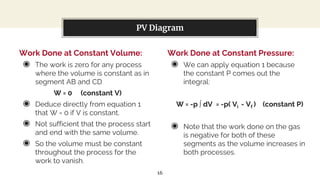
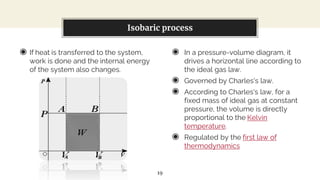
Presentation for
THERMODYNAMICS
By: Ayesha Anum, Marwa Batool
1
Work done by constant
volume and pressure
using PV diagram
What is Work?
Definition, Explanation and Units
3
“
“In thermodynamics, work performed by
a system is the energy transferred by the
system to its surroundings.”
W = F . d
4
Explanation:
◉ Work is a form of energy, but it
is energy in transit.
◉ A system contains no work,
work is a process done by or on
a system.
◉ In general, work is defined for
mechanical systems as the
action of a force on an object
through a distance.
You can also split your content
Units:
‘Newton-meter’ (Nm) or Joule (J)
WHAT IS WORK?
5
PΔV Work
6
“
“Pressure-volume work occurs when the volume V of a
system changes. It is equal to the area under the
process curve plotted on the PV diagram. It is known
also as boundary work.”
7
◉ Occurs because the mass of
substance within the system
boundary causes a force, the
pressure times the surface
area, to act on the boundary
surface and make it move.
◉ Occurs when the volume V of
a system changes.
◉ It is used for calculating
piston displacement work in
a closed system.
You can also split your content
◉ The pressure & temperature
may also change.
PΔV Work
8
◉ The first law of
thermodynamics and the work
can then be expressed as:
◉ When system changes from
an initial to a final state, it passes
through a series of intermediate
states called paths.
You can also split your content
◉ The work done by the
system depends on the
initial and final states and
path.
◉ Q and W are path
dependent, whereas ΔEint is
path independent.
PΔV Work
9
Pressure-Volume Diagram
10
“
“A pressure–volume diagram (PV diagram) is used to
describe corresponding changes
in volume and pressure in a system.”
11
◉ It plots the change in pressure P with
respect to volume V for a process.
◉ In thermodynamics, a set of
processes form a cycle, so on
completion of the cycle there has
been no net change in state of the
system.
◉ The figure shows an idealized PV
diagram showing a series of
numbered states (1 through 4).
◉ Paths between each state consist of
a process which alters the pressure
or volume of the system.
You can also split your content
l
Pressure Volume Diagram
12
◉ Amount of energy received by the
system as work can be measured as
the net work is represented by the
area enclosed by the four lines.
◉ In the figure, the processes 1-2-3
produce a work output.
◉ Processes from 3-4-1 require a
smaller energy input to return to the
starting position.
◉ Thus, the net work is the difference
between the two.
◉ This figure is highly idealized, in so
far as all the lines are straight and the
corners are right angles.
You can also split your content
l
Pressure Volume Diagram
13
Finding Work done using PV Diagram
14
◉ Consider that a gas is confined to a
cylinder in contact with a thermal
reservoir at temperature T.
◉ Piston exerts a total downward force
‘mg’ on the gas, which in equilibrium
is balanced by the upward force due
to the gas pressure.
◉ The volume of the gas is determined
from the height h of the piston above
the bottom of the cylinder.
◉ The temperature of the gas is
measured with a suitable
thermometer.
You can also split your content
◉ lA gas supply permits additional
gas to be added to the cylinder.
◉ If the piston moves through a
distance dx, then the volume of the
gas changes by an amount dV=A
dx.
◉ Thus, the work done on the gas is
W = - ∫ P dV --- Equation 1
◉ The integral is carried out between
the initial volume Vi and the final
volume Vf .
Work done using PV Diagram
15
Work Done at Constant Volume:
◉ The work is zero for any process
where the volume is constant as in
segment AB and CD
W = 0 (constant V)
◉ Deduce directly from equation 1
that W = 0 if V is constant.
◉ Not sufficient that the process start
and end with the same volume.
◉ So the volume must be constant
throughout the process for the
work to vanish.
You can also split your content
Work Done at Constant Pressure:
◉ We can apply equation 1 because
the constant P comes out the
integral:
W = -p ∫ dV = -p( Vi - Vf ) (constant P)
◉ Note that the work done on the gas
is negative for both of these
segments as the volume increases in
both processes.
PV Diagram
16
Isobaric Process
17
“
“An isobaric process is a thermodynamic
process change in the state of a certain amount of
matter in which the pressure remains constant.”
18
◉ If heat is transferred to the system,
work is done and the internal energy
of the system also changes.
You can also split your content
◉ In a pressure-volume diagram, it
drives a horizontal line according to
the ideal gas law.
◉ Governed by Charles's law.
◉ According to Charles's law, for a
fixed mass of ideal gas at constant
pressure, the volume is directly
proportional to the Kelvin
temperature.
◉ Regulated by the first law of
thermodynamics
Isobaric process
19
◉ In this process, the increase in
energy is equal to the increase
in enthalpy minus the pressure
multiplied by the increase in
volume:
ΔE = ΔH – P.ΔV.
◉ Not to be confused with isothermal
processes, which are carried out at
constant pressure or with adiabatic
processes, which do not
exchange heat.
You can also split your content
Isobaric process
20
Examples of Isobaric process:
◉ Expansion phase of the cylinder of
an engine.
◉ Boil water in an open container.
◉ Heating of a globe due to the
effects of solar radiation.
◉ Hot air balloons experiment
isobaric and isochoric process.
You can also split your content
Isobaric process
21
Formulas related to isobaric processes:
◉ W 1-2 = P (V 2 - V 1)
◉ W 1-2 = n R (T 2 - T 1)
◉ Q 1-2 = m c p (T 2 - T 1)
◉ Q 1-2 = (k / (k -1)) P (V 2 - V 1)
Isochoric Process
22
“
“The isochoric process is
a thermodynamic process that occurs in a
constant volume.”
23
◉ To carry it out in a gas or liquid, it is
sufficient to heat (cool) a substance in
a container that does not change its
volume.
You can also split your content
◉ In an isochoric process, the
pressure of an ideal gas is directly
proportional to its temperature.
◉ In real gases, Charles's law is not
fulfilled.
◉ The graphics are represented by
lines called isochores.
◉ For an ideal gas, they are straight
lines in all the diagrams that relate
parameters: T (temperature) V
(volume) and P (pressure).
Isochoric process
24
◉ An isochoric thermodynamic quasi-
static process is characterized by a
constant volume, that is, ΔV = 0.
◉ Does not perform pressure-volume
work, since said work is defined by:
W = P∆V
◉ For a reversible process, the first
law of thermodynamics gives the
change in the internal energy of the
system:
dU = dQ - dW
You can also split your content
◉ Replace work with a change in
volume gives:
dU = dQ - PdV
◉ Since the process is isochoric, dV =
0, the previous equation now gives:
dU = dQ
◉ Using the definition of specific
heat capacity at constant volume,
CV = dU/dT ,
dQ = nCVdT
Isochoric process
25
◉ Integration of both sides produces:
∆Q = n 𝑻1
𝑻2
𝑪𝒗𝒅𝑻
◉ Where Cv = specific heat capacity
at constant volume.
◉ T1 is the initial temperature.
◉ T2 is the final temperature.
◉ We conclude with:
∆Q = nCV∆T
You can also split your content
Ideal Gas:
◉ If an ideal gas is used in an
isochoric process and the amount
of gas remains constant, then the
increase in energy is proportional
to an increase in temperature and
pressure.
◉ For example, a gas heated in a rigid
container: the pressure and
temperature of the gas will
increase.
◉ However the volume will remain
the same.
Isochoric process
26
Practical Application of Isochoric
Process Theory:
◉ With an ideal Otto cycle, steps 2-3
and 4-1 are isochoric processes.
◉ Work done at the engine =
difference in the work which gas
will produce on the piston during
the third cycle.
◉ Work that the piston dedicates to
the gas compression during the
second cycle.
◉ In the Stirling cycle, there are also
two isochoric measures.
You can also split your content
◉ For its implementation, a regenerator
has been added to the Stirling
engine.
◉ Gas that passes through the filling in
one direction emits heat from the
working fluid to the regenerator.
◉ When it moves in the other direction
returns it to the work theme.
◉ The ideal Stirling cycle achieves
reversibility and the same efficiency
values as the Carnot cycle.
Isochoric process
27
Thank You
For watching!
28

Work done by constant volume and pressure using PV diagram

  • 1.
  • 2.
    Work done byconstant volume and pressure using PV diagram
  • 3.
    What is Work? Definition,Explanation and Units 3
  • 4.
    “ “In thermodynamics, workperformed by a system is the energy transferred by the system to its surroundings.” W = F . d 4
  • 5.
    Explanation: ◉ Work isa form of energy, but it is energy in transit. ◉ A system contains no work, work is a process done by or on a system. ◉ In general, work is defined for mechanical systems as the action of a force on an object through a distance. You can also split your content Units: ‘Newton-meter’ (Nm) or Joule (J) WHAT IS WORK? 5
  • 6.
  • 7.
    “ “Pressure-volume work occurswhen the volume V of a system changes. It is equal to the area under the process curve plotted on the PV diagram. It is known also as boundary work.” 7
  • 8.
    ◉ Occurs becausethe mass of substance within the system boundary causes a force, the pressure times the surface area, to act on the boundary surface and make it move. ◉ Occurs when the volume V of a system changes. ◉ It is used for calculating piston displacement work in a closed system. You can also split your content ◉ The pressure & temperature may also change. PΔV Work 8
  • 9.
    ◉ The firstlaw of thermodynamics and the work can then be expressed as: ◉ When system changes from an initial to a final state, it passes through a series of intermediate states called paths. You can also split your content ◉ The work done by the system depends on the initial and final states and path. ◉ Q and W are path dependent, whereas ΔEint is path independent. PΔV Work 9
  • 10.
  • 11.
    “ “A pressure–volume diagram(PV diagram) is used to describe corresponding changes in volume and pressure in a system.” 11
  • 12.
    ◉ It plotsthe change in pressure P with respect to volume V for a process. ◉ In thermodynamics, a set of processes form a cycle, so on completion of the cycle there has been no net change in state of the system. ◉ The figure shows an idealized PV diagram showing a series of numbered states (1 through 4). ◉ Paths between each state consist of a process which alters the pressure or volume of the system. You can also split your content l Pressure Volume Diagram 12
  • 13.
    ◉ Amount ofenergy received by the system as work can be measured as the net work is represented by the area enclosed by the four lines. ◉ In the figure, the processes 1-2-3 produce a work output. ◉ Processes from 3-4-1 require a smaller energy input to return to the starting position. ◉ Thus, the net work is the difference between the two. ◉ This figure is highly idealized, in so far as all the lines are straight and the corners are right angles. You can also split your content l Pressure Volume Diagram 13
  • 14.
    Finding Work doneusing PV Diagram 14
  • 15.
    ◉ Consider thata gas is confined to a cylinder in contact with a thermal reservoir at temperature T. ◉ Piston exerts a total downward force ‘mg’ on the gas, which in equilibrium is balanced by the upward force due to the gas pressure. ◉ The volume of the gas is determined from the height h of the piston above the bottom of the cylinder. ◉ The temperature of the gas is measured with a suitable thermometer. You can also split your content ◉ lA gas supply permits additional gas to be added to the cylinder. ◉ If the piston moves through a distance dx, then the volume of the gas changes by an amount dV=A dx. ◉ Thus, the work done on the gas is W = - ∫ P dV --- Equation 1 ◉ The integral is carried out between the initial volume Vi and the final volume Vf . Work done using PV Diagram 15
  • 16.
    Work Done atConstant Volume: ◉ The work is zero for any process where the volume is constant as in segment AB and CD W = 0 (constant V) ◉ Deduce directly from equation 1 that W = 0 if V is constant. ◉ Not sufficient that the process start and end with the same volume. ◉ So the volume must be constant throughout the process for the work to vanish. You can also split your content Work Done at Constant Pressure: ◉ We can apply equation 1 because the constant P comes out the integral: W = -p ∫ dV = -p( Vi - Vf ) (constant P) ◉ Note that the work done on the gas is negative for both of these segments as the volume increases in both processes. PV Diagram 16
  • 17.
  • 18.
    “ “An isobaric processis a thermodynamic process change in the state of a certain amount of matter in which the pressure remains constant.” 18
  • 19.
    ◉ If heatis transferred to the system, work is done and the internal energy of the system also changes. You can also split your content ◉ In a pressure-volume diagram, it drives a horizontal line according to the ideal gas law. ◉ Governed by Charles's law. ◉ According to Charles's law, for a fixed mass of ideal gas at constant pressure, the volume is directly proportional to the Kelvin temperature. ◉ Regulated by the first law of thermodynamics Isobaric process 19
  • 20.
    ◉ In thisprocess, the increase in energy is equal to the increase in enthalpy minus the pressure multiplied by the increase in volume: ΔE = ΔH – P.ΔV. ◉ Not to be confused with isothermal processes, which are carried out at constant pressure or with adiabatic processes, which do not exchange heat. You can also split your content Isobaric process 20 Examples of Isobaric process: ◉ Expansion phase of the cylinder of an engine. ◉ Boil water in an open container. ◉ Heating of a globe due to the effects of solar radiation. ◉ Hot air balloons experiment isobaric and isochoric process.
  • 21.
    You can alsosplit your content Isobaric process 21 Formulas related to isobaric processes: ◉ W 1-2 = P (V 2 - V 1) ◉ W 1-2 = n R (T 2 - T 1) ◉ Q 1-2 = m c p (T 2 - T 1) ◉ Q 1-2 = (k / (k -1)) P (V 2 - V 1)
  • 22.
  • 23.
    “ “The isochoric processis a thermodynamic process that occurs in a constant volume.” 23
  • 24.
    ◉ To carryit out in a gas or liquid, it is sufficient to heat (cool) a substance in a container that does not change its volume. You can also split your content ◉ In an isochoric process, the pressure of an ideal gas is directly proportional to its temperature. ◉ In real gases, Charles's law is not fulfilled. ◉ The graphics are represented by lines called isochores. ◉ For an ideal gas, they are straight lines in all the diagrams that relate parameters: T (temperature) V (volume) and P (pressure). Isochoric process 24
  • 25.
    ◉ An isochoricthermodynamic quasi- static process is characterized by a constant volume, that is, ΔV = 0. ◉ Does not perform pressure-volume work, since said work is defined by: W = P∆V ◉ For a reversible process, the first law of thermodynamics gives the change in the internal energy of the system: dU = dQ - dW You can also split your content ◉ Replace work with a change in volume gives: dU = dQ - PdV ◉ Since the process is isochoric, dV = 0, the previous equation now gives: dU = dQ ◉ Using the definition of specific heat capacity at constant volume, CV = dU/dT , dQ = nCVdT Isochoric process 25
  • 26.
    ◉ Integration ofboth sides produces: ∆Q = n 𝑻1 𝑻2 𝑪𝒗𝒅𝑻 ◉ Where Cv = specific heat capacity at constant volume. ◉ T1 is the initial temperature. ◉ T2 is the final temperature. ◉ We conclude with: ∆Q = nCV∆T You can also split your content Ideal Gas: ◉ If an ideal gas is used in an isochoric process and the amount of gas remains constant, then the increase in energy is proportional to an increase in temperature and pressure. ◉ For example, a gas heated in a rigid container: the pressure and temperature of the gas will increase. ◉ However the volume will remain the same. Isochoric process 26
  • 27.
    Practical Application ofIsochoric Process Theory: ◉ With an ideal Otto cycle, steps 2-3 and 4-1 are isochoric processes. ◉ Work done at the engine = difference in the work which gas will produce on the piston during the third cycle. ◉ Work that the piston dedicates to the gas compression during the second cycle. ◉ In the Stirling cycle, there are also two isochoric measures. You can also split your content ◉ For its implementation, a regenerator has been added to the Stirling engine. ◉ Gas that passes through the filling in one direction emits heat from the working fluid to the regenerator. ◉ When it moves in the other direction returns it to the work theme. ◉ The ideal Stirling cycle achieves reversibility and the same efficiency values as the Carnot cycle. Isochoric process 27
  • 28.