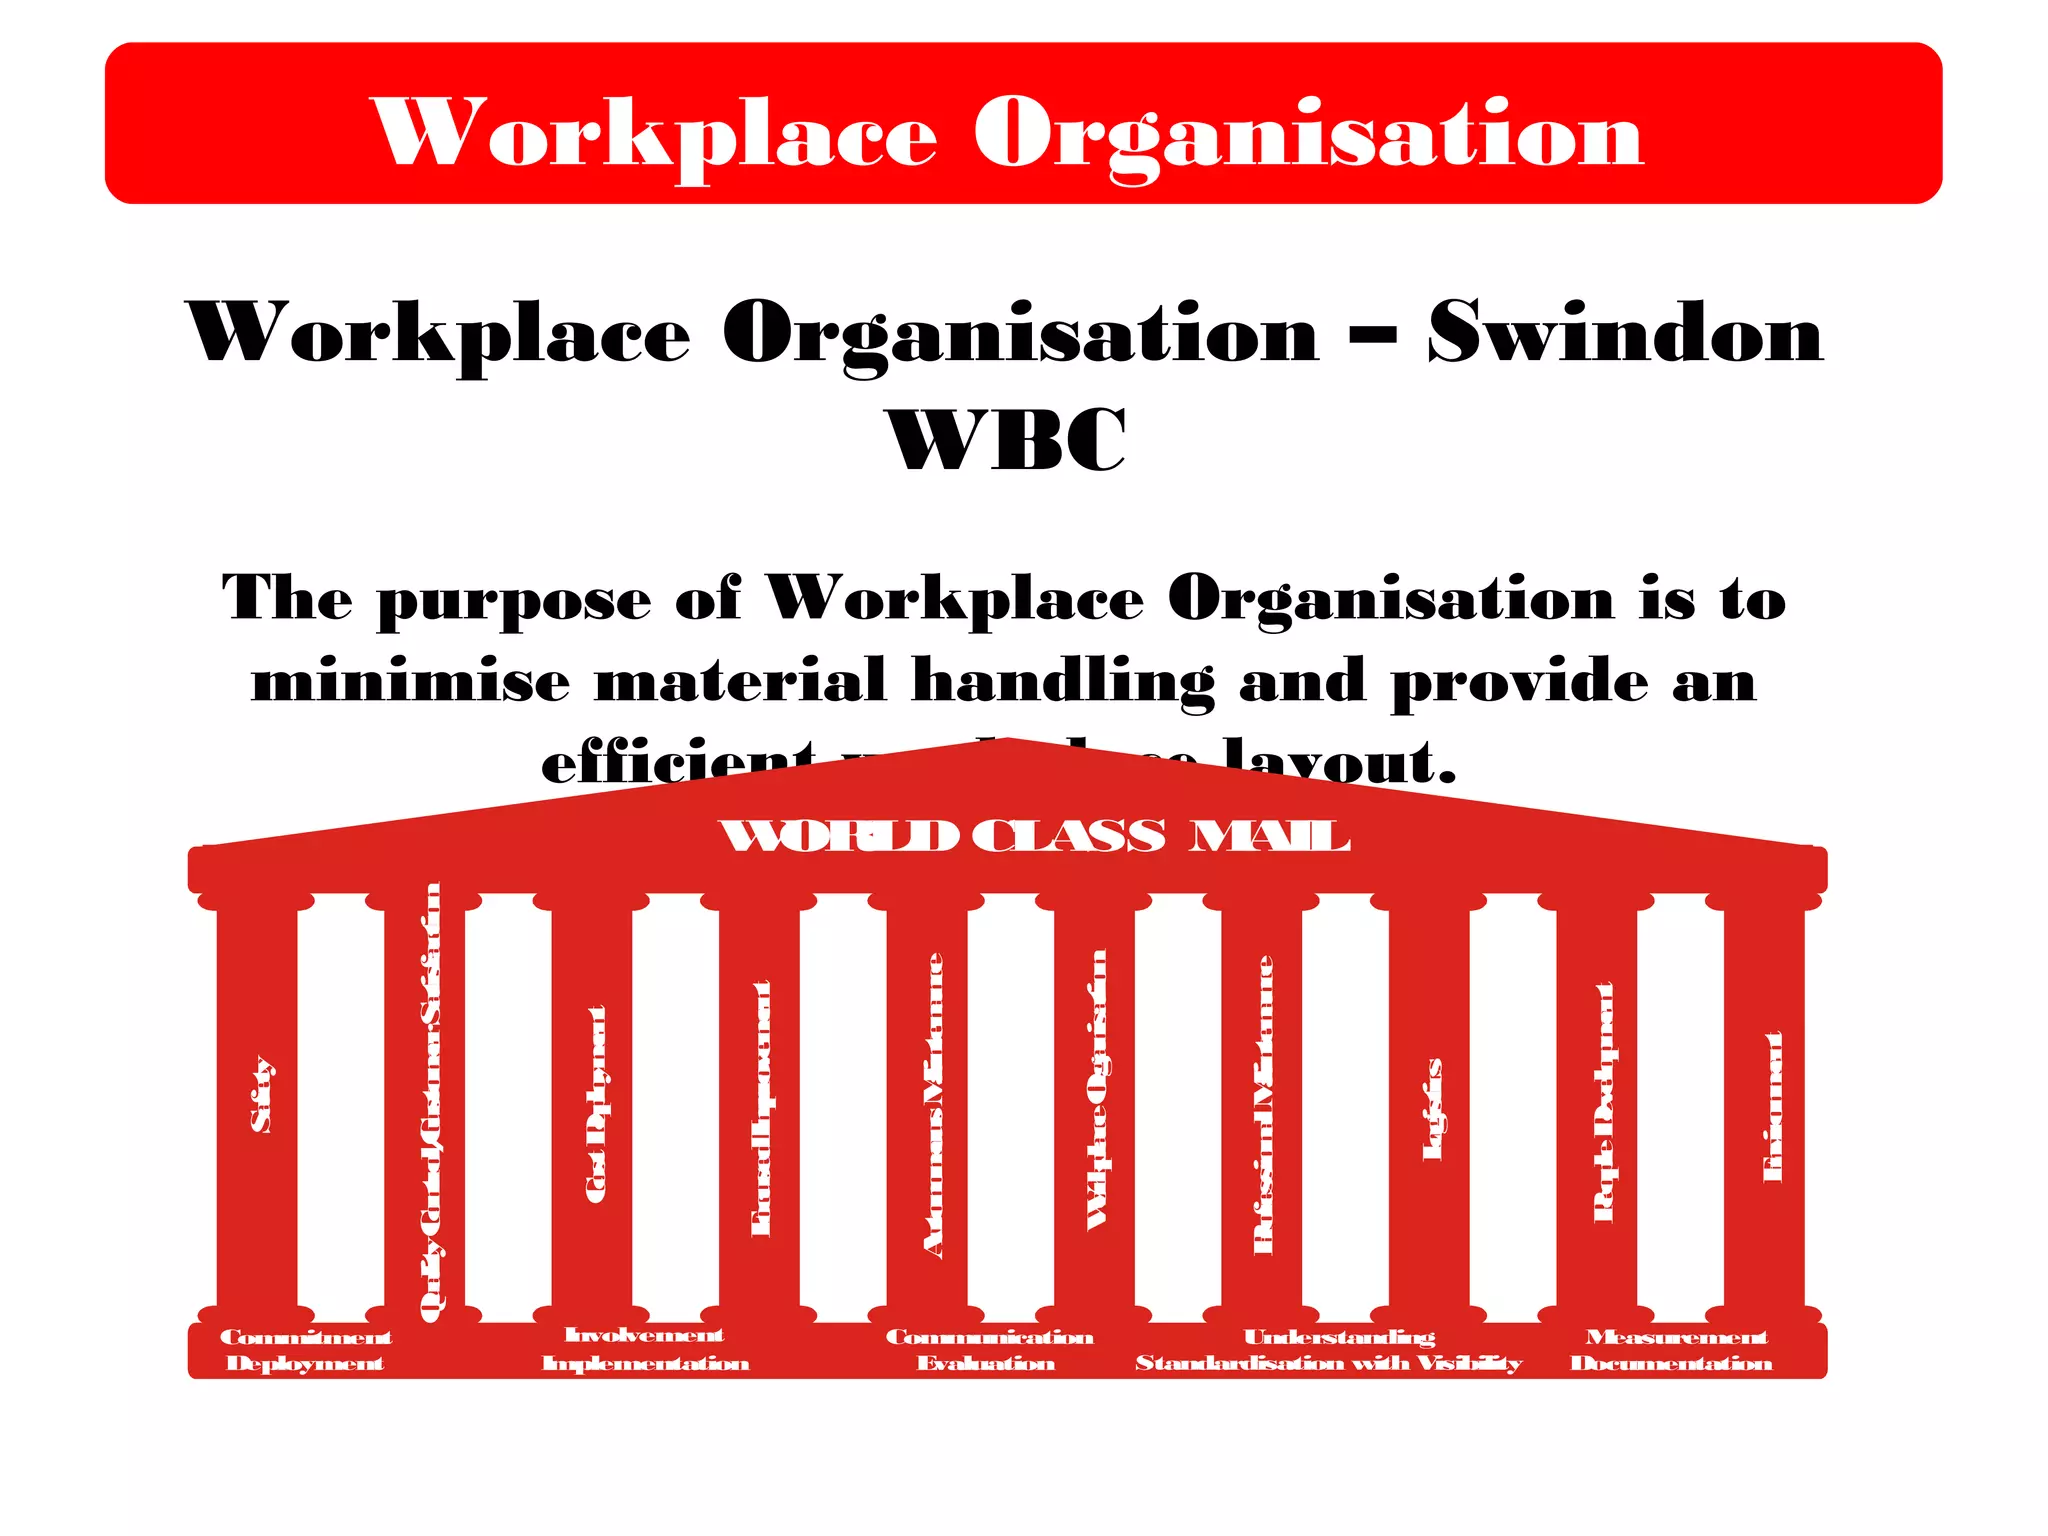
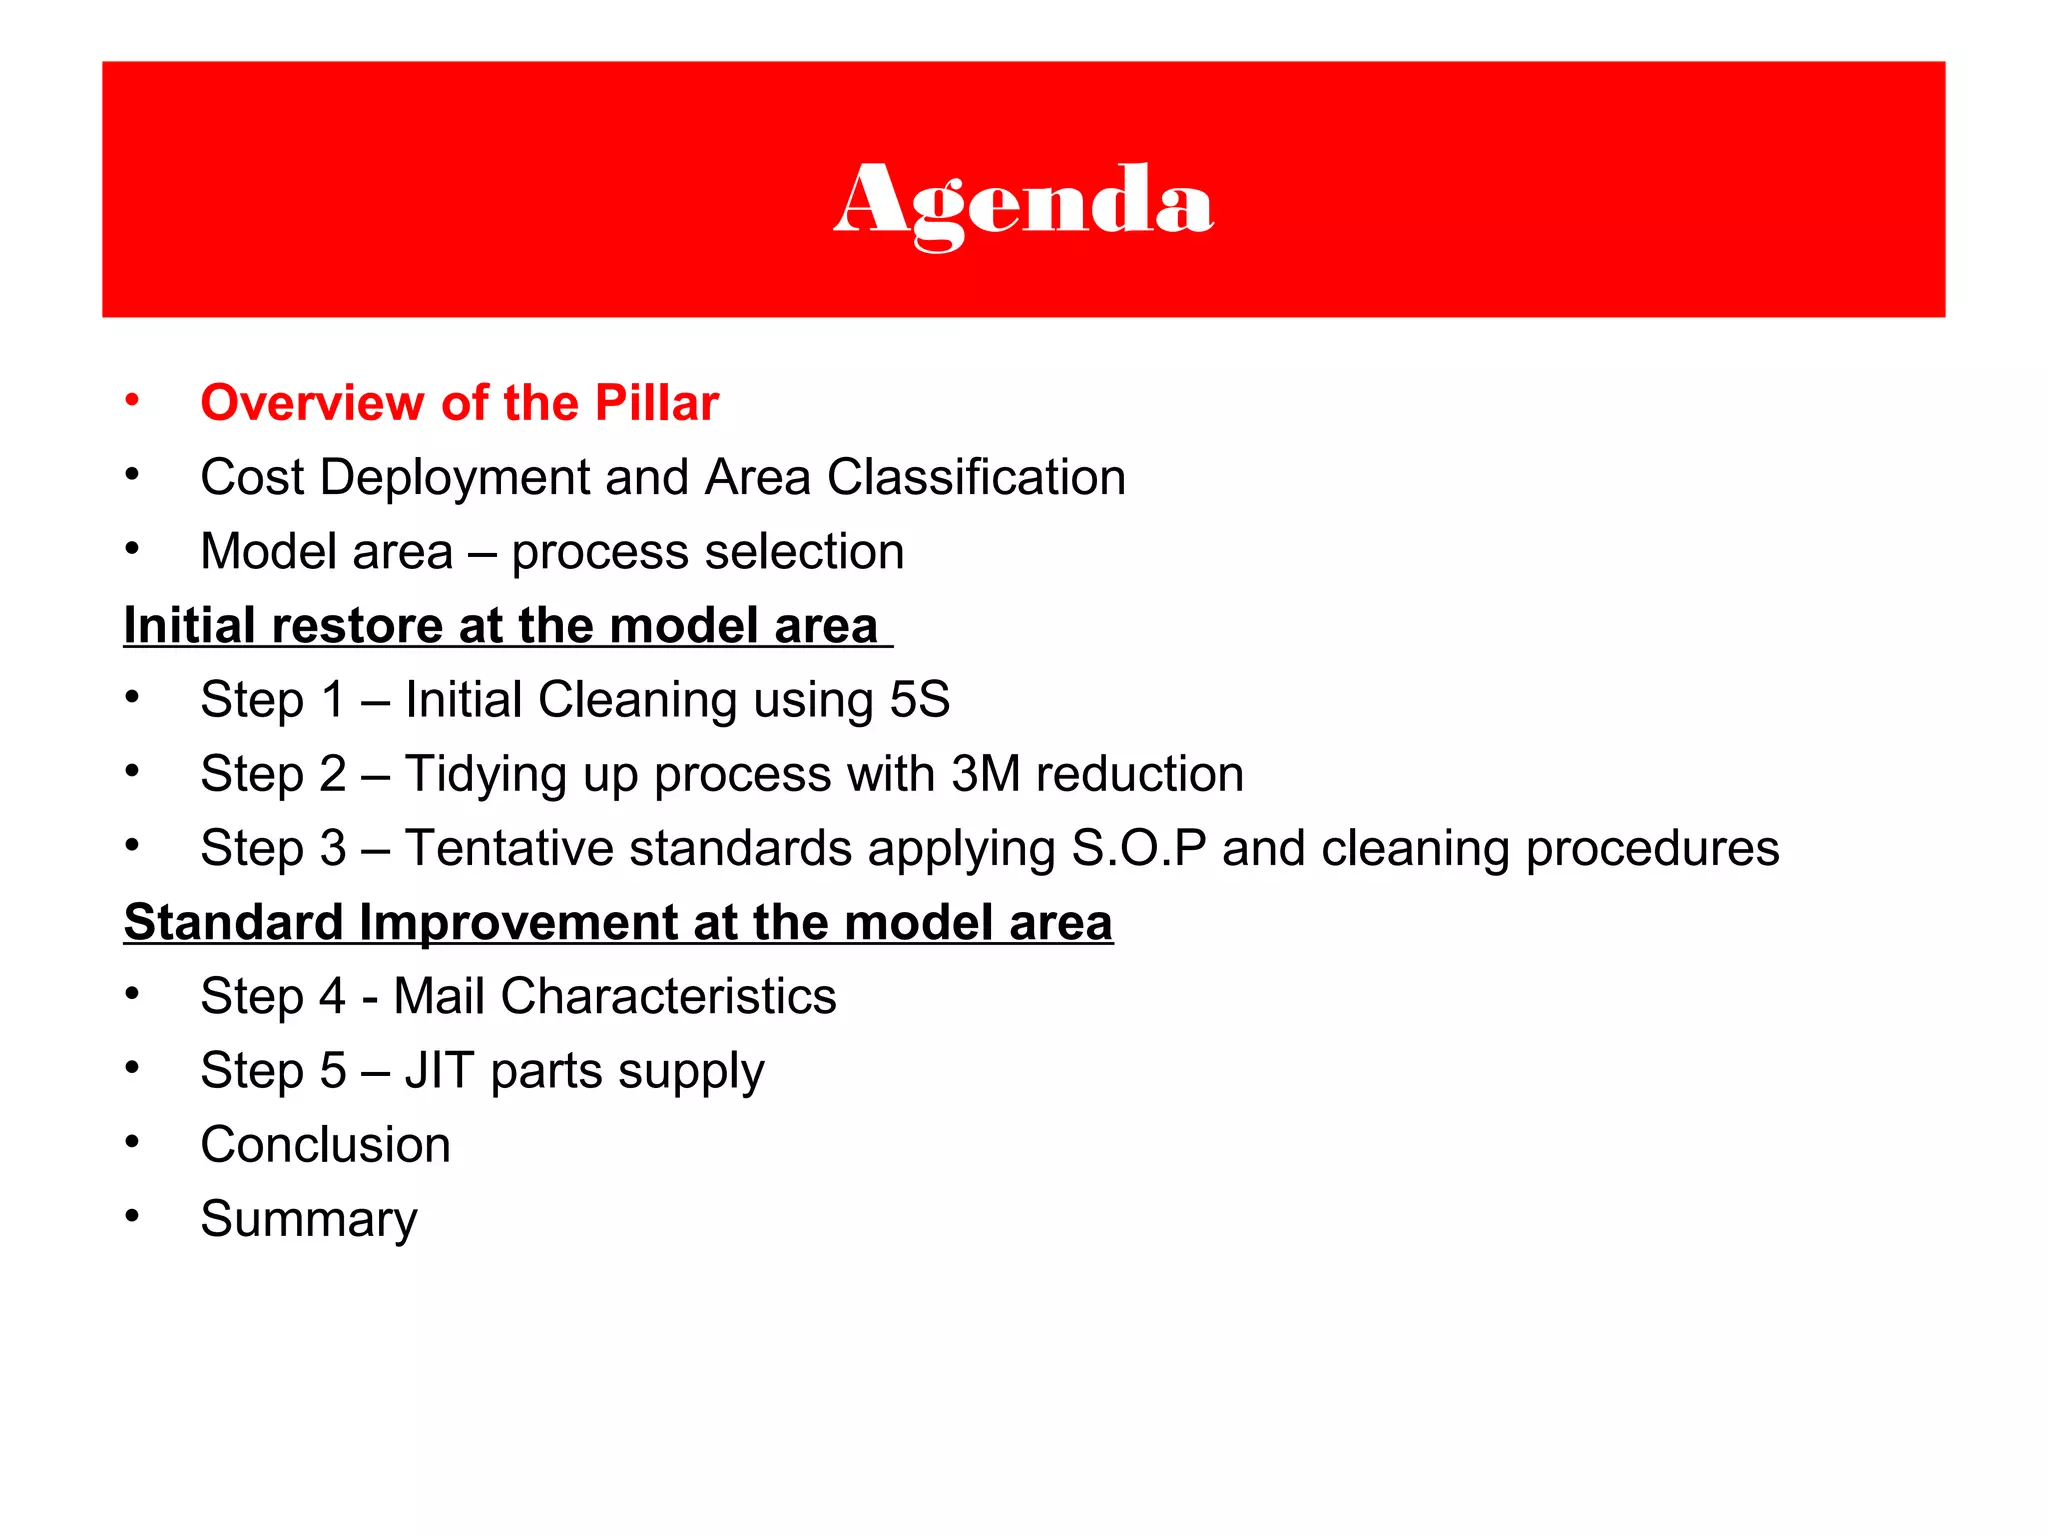
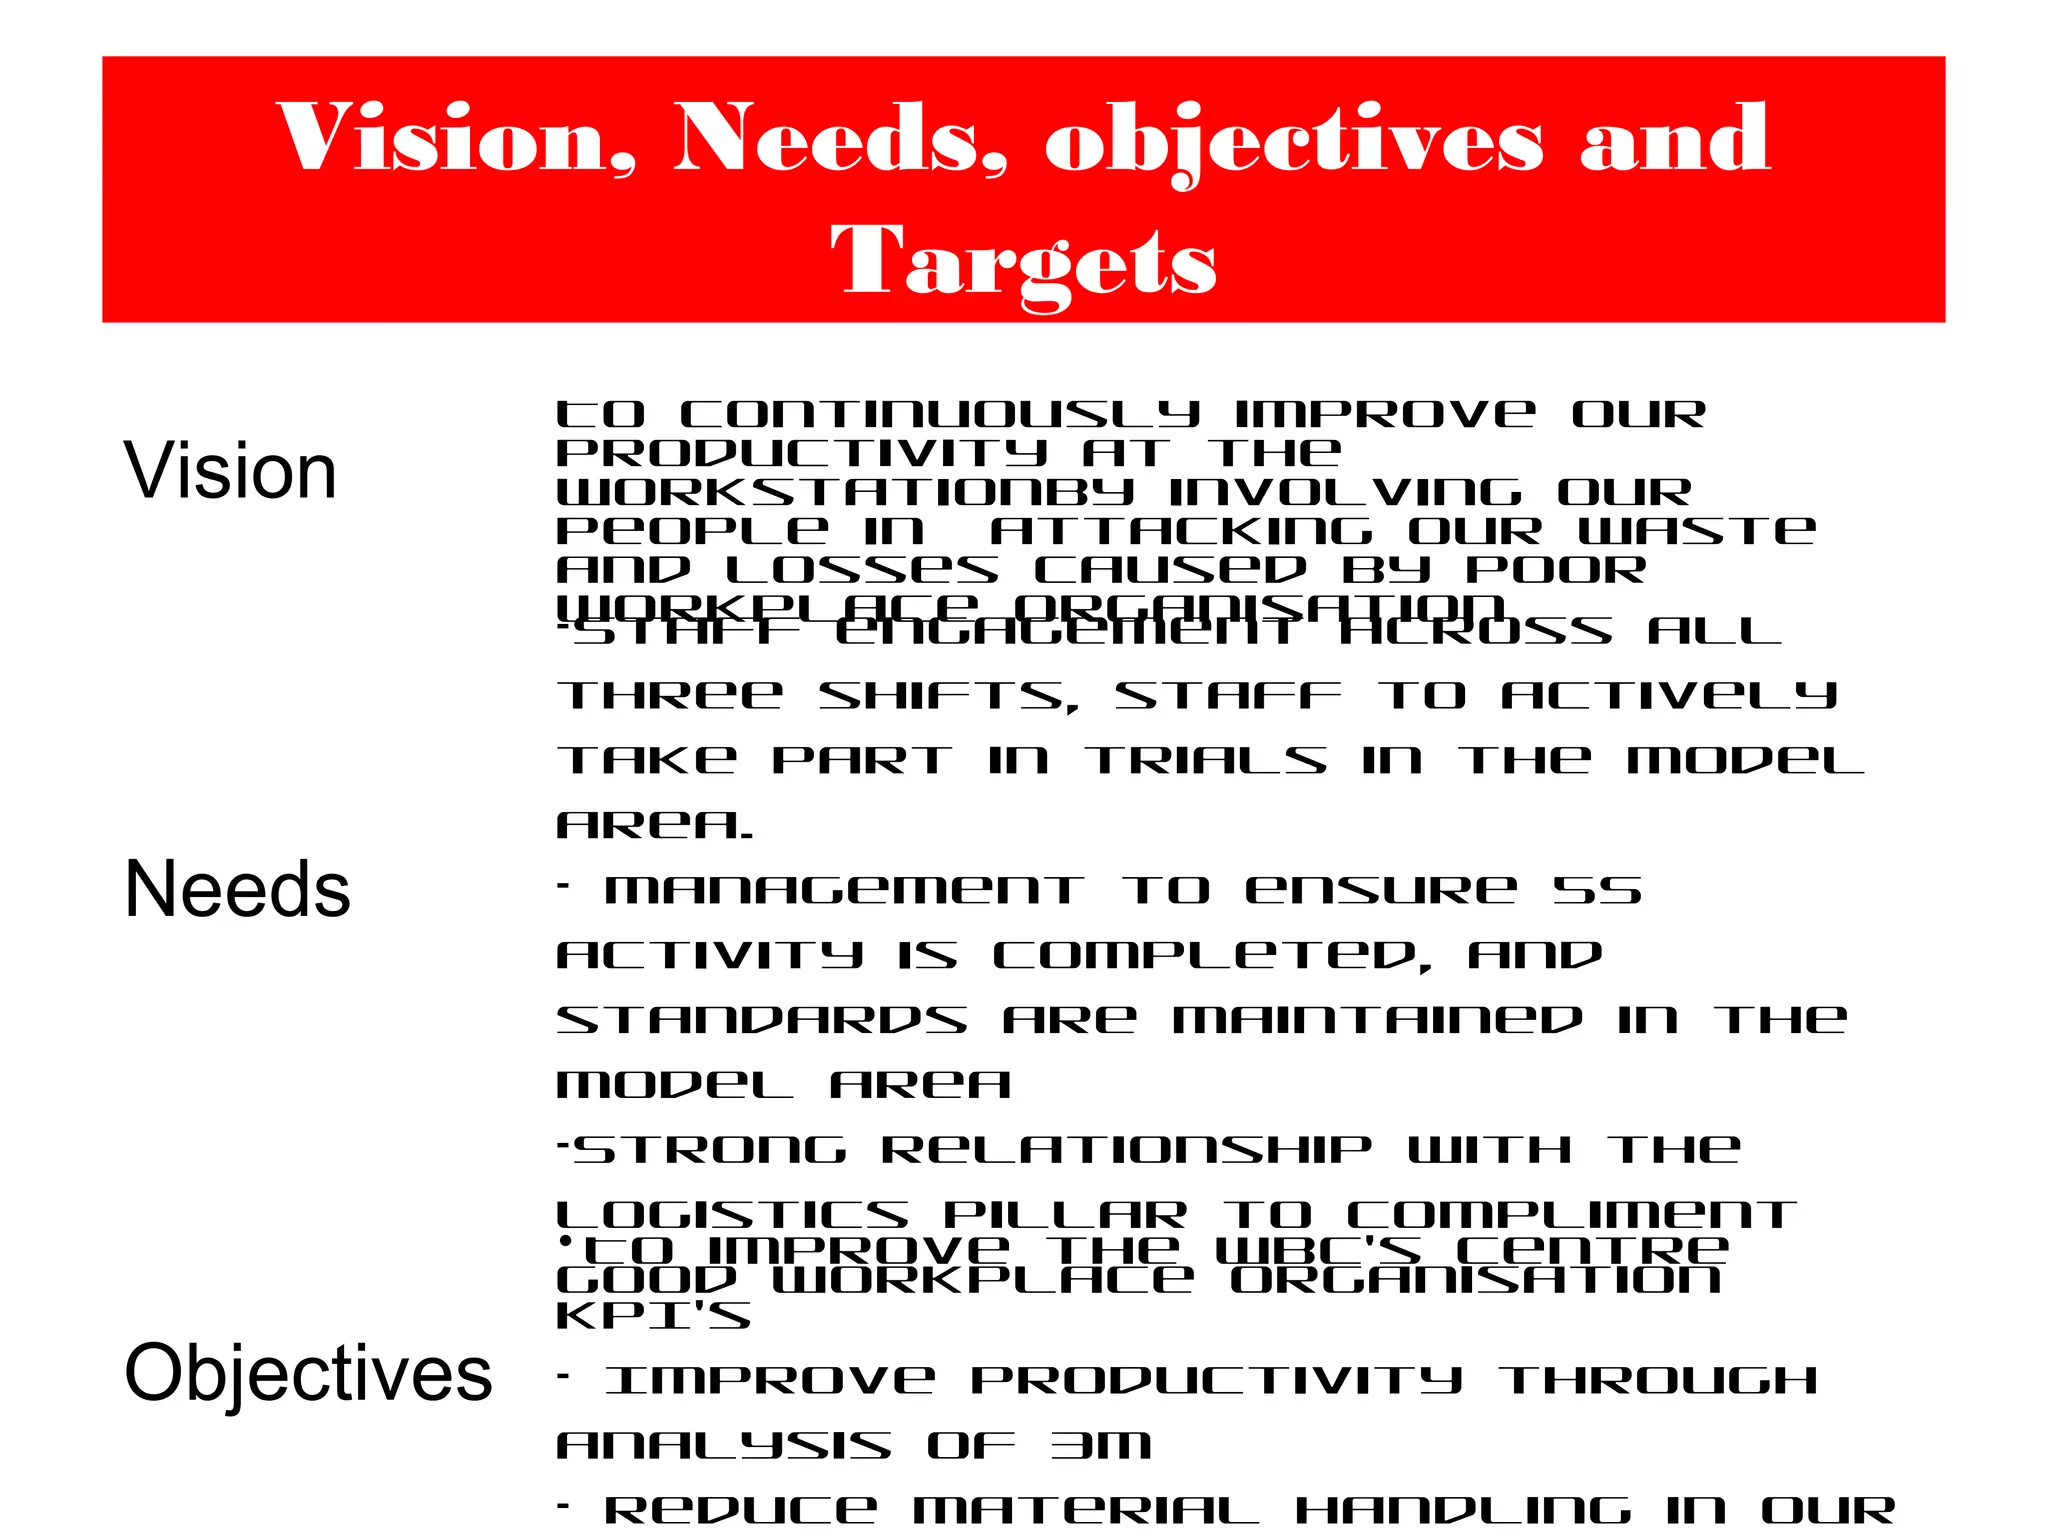
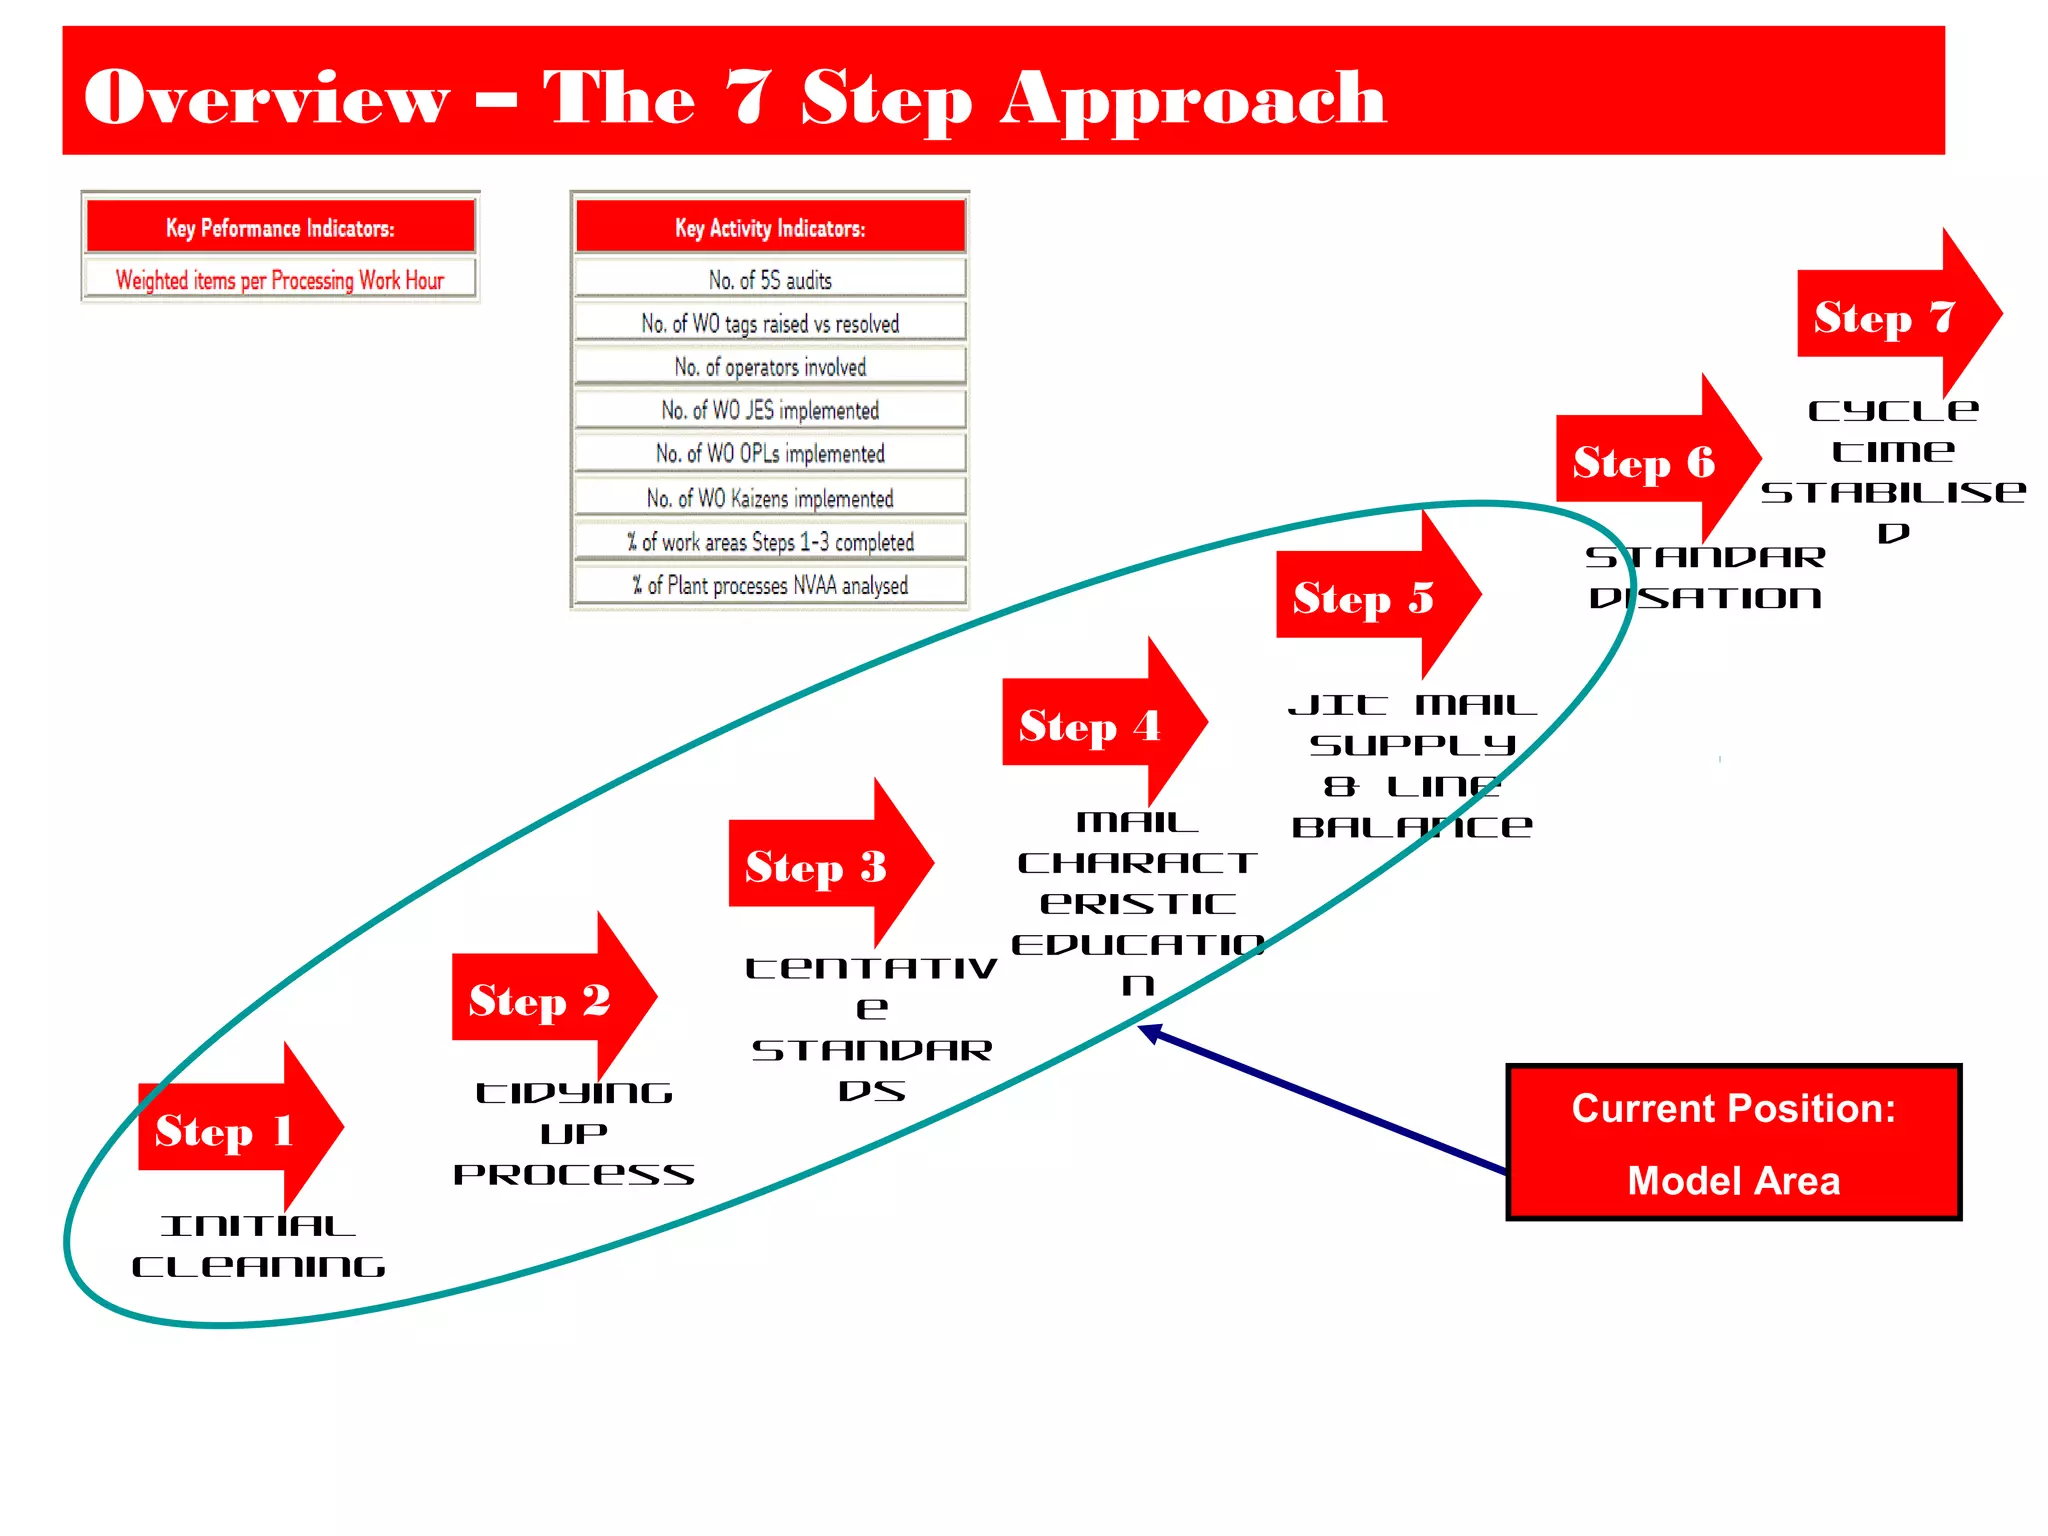
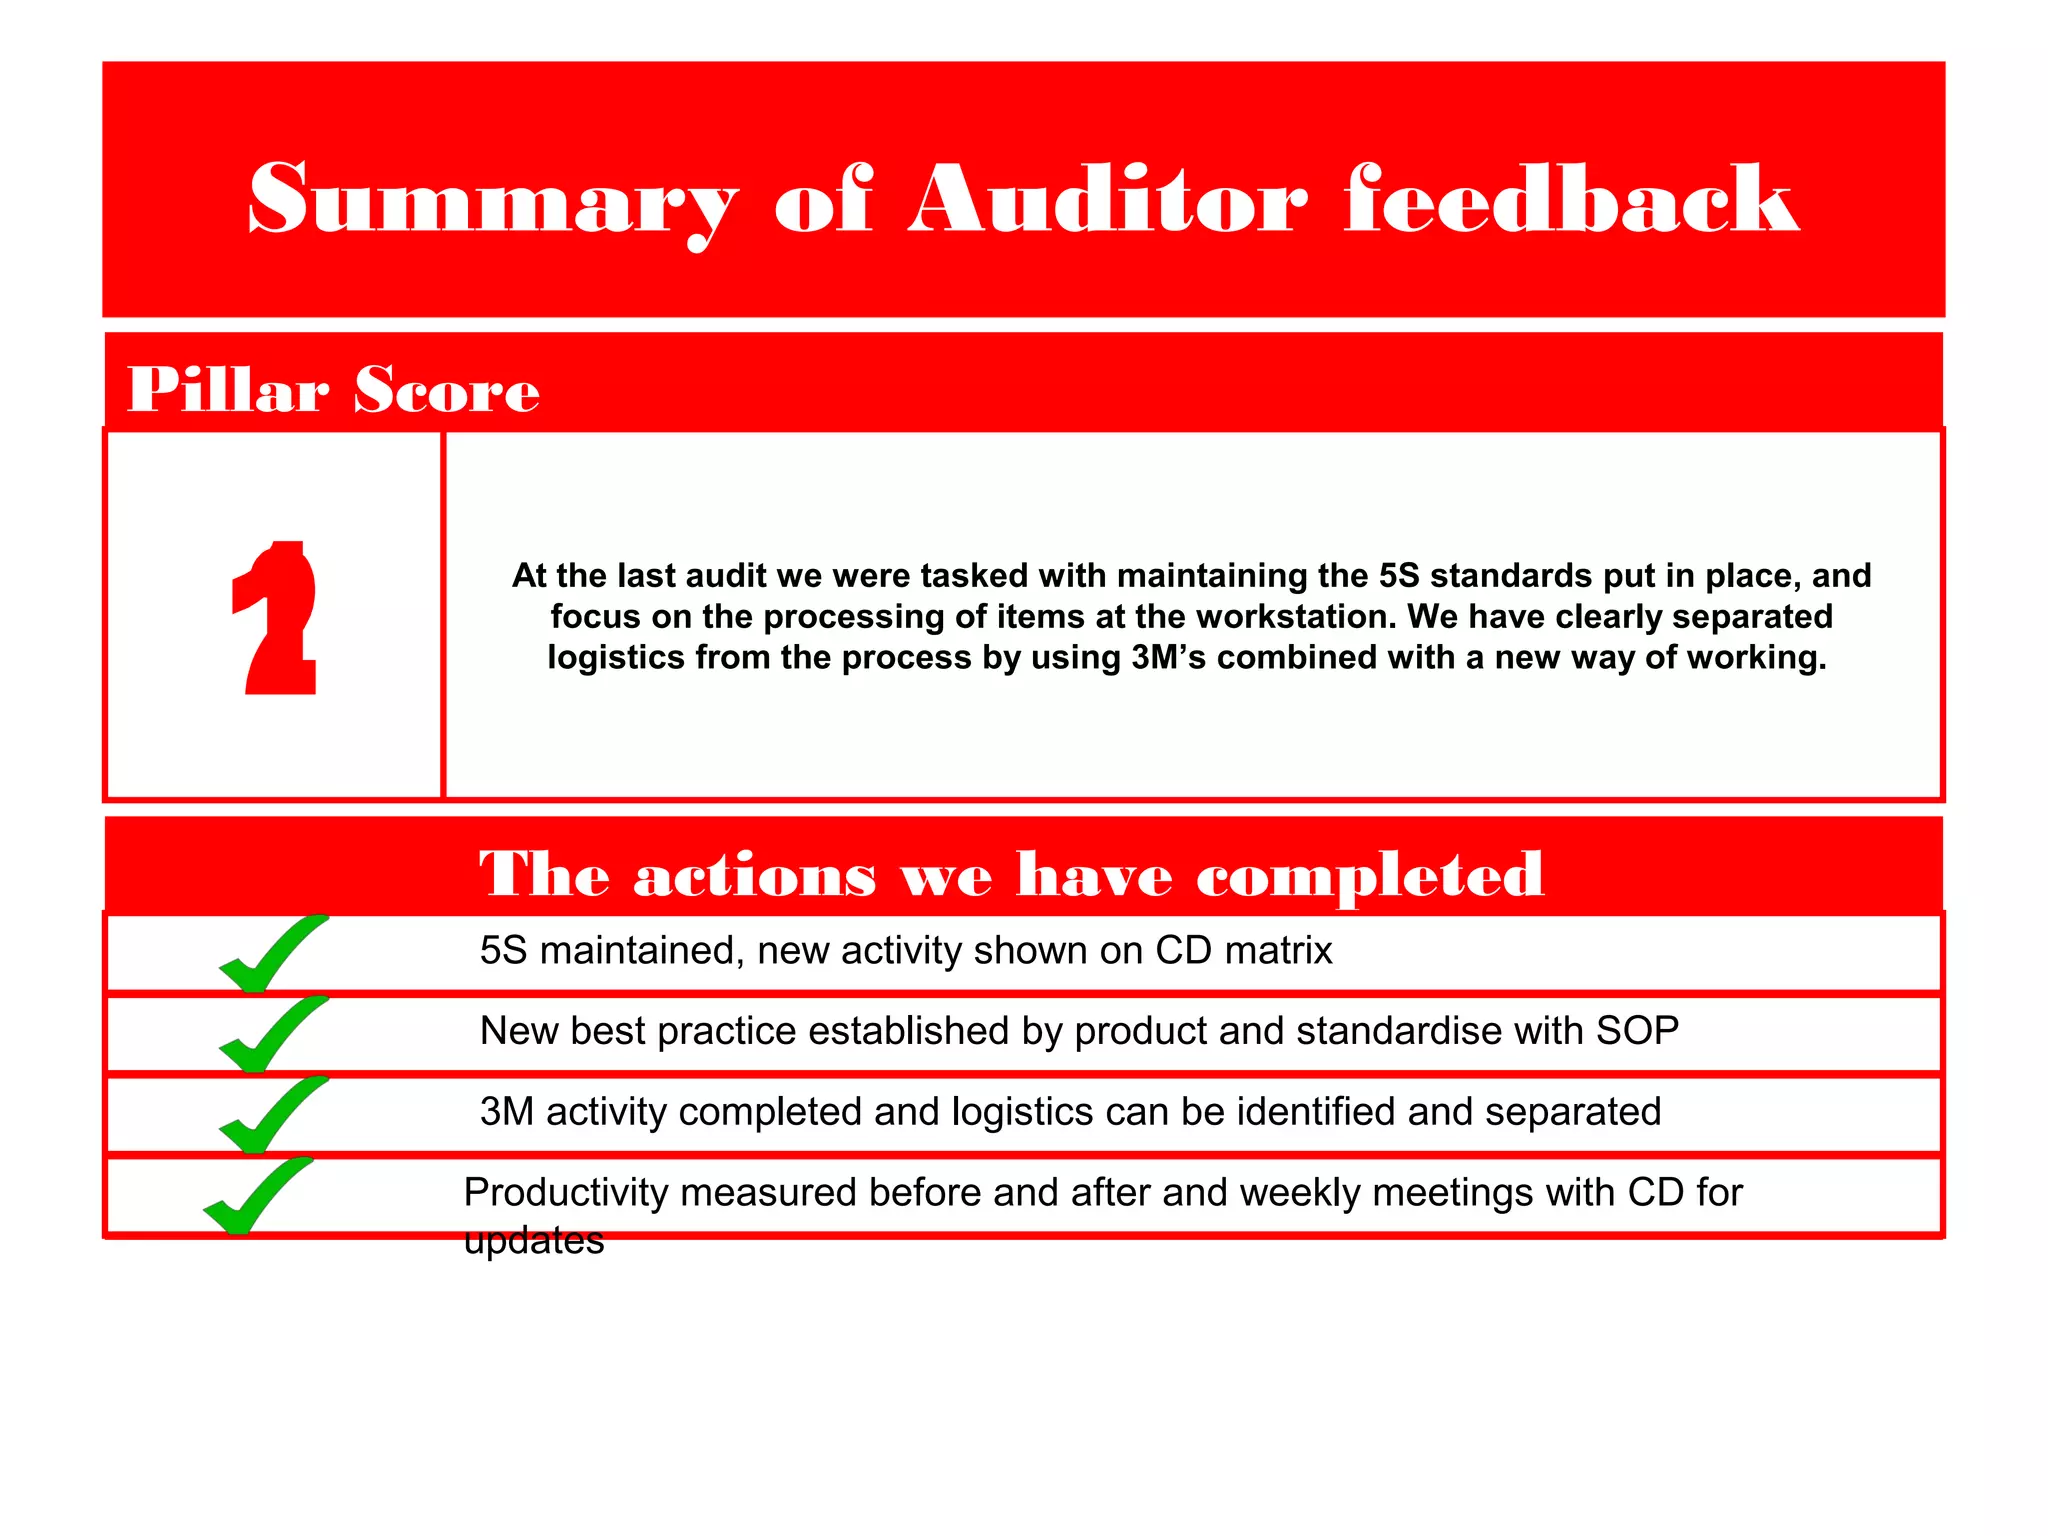
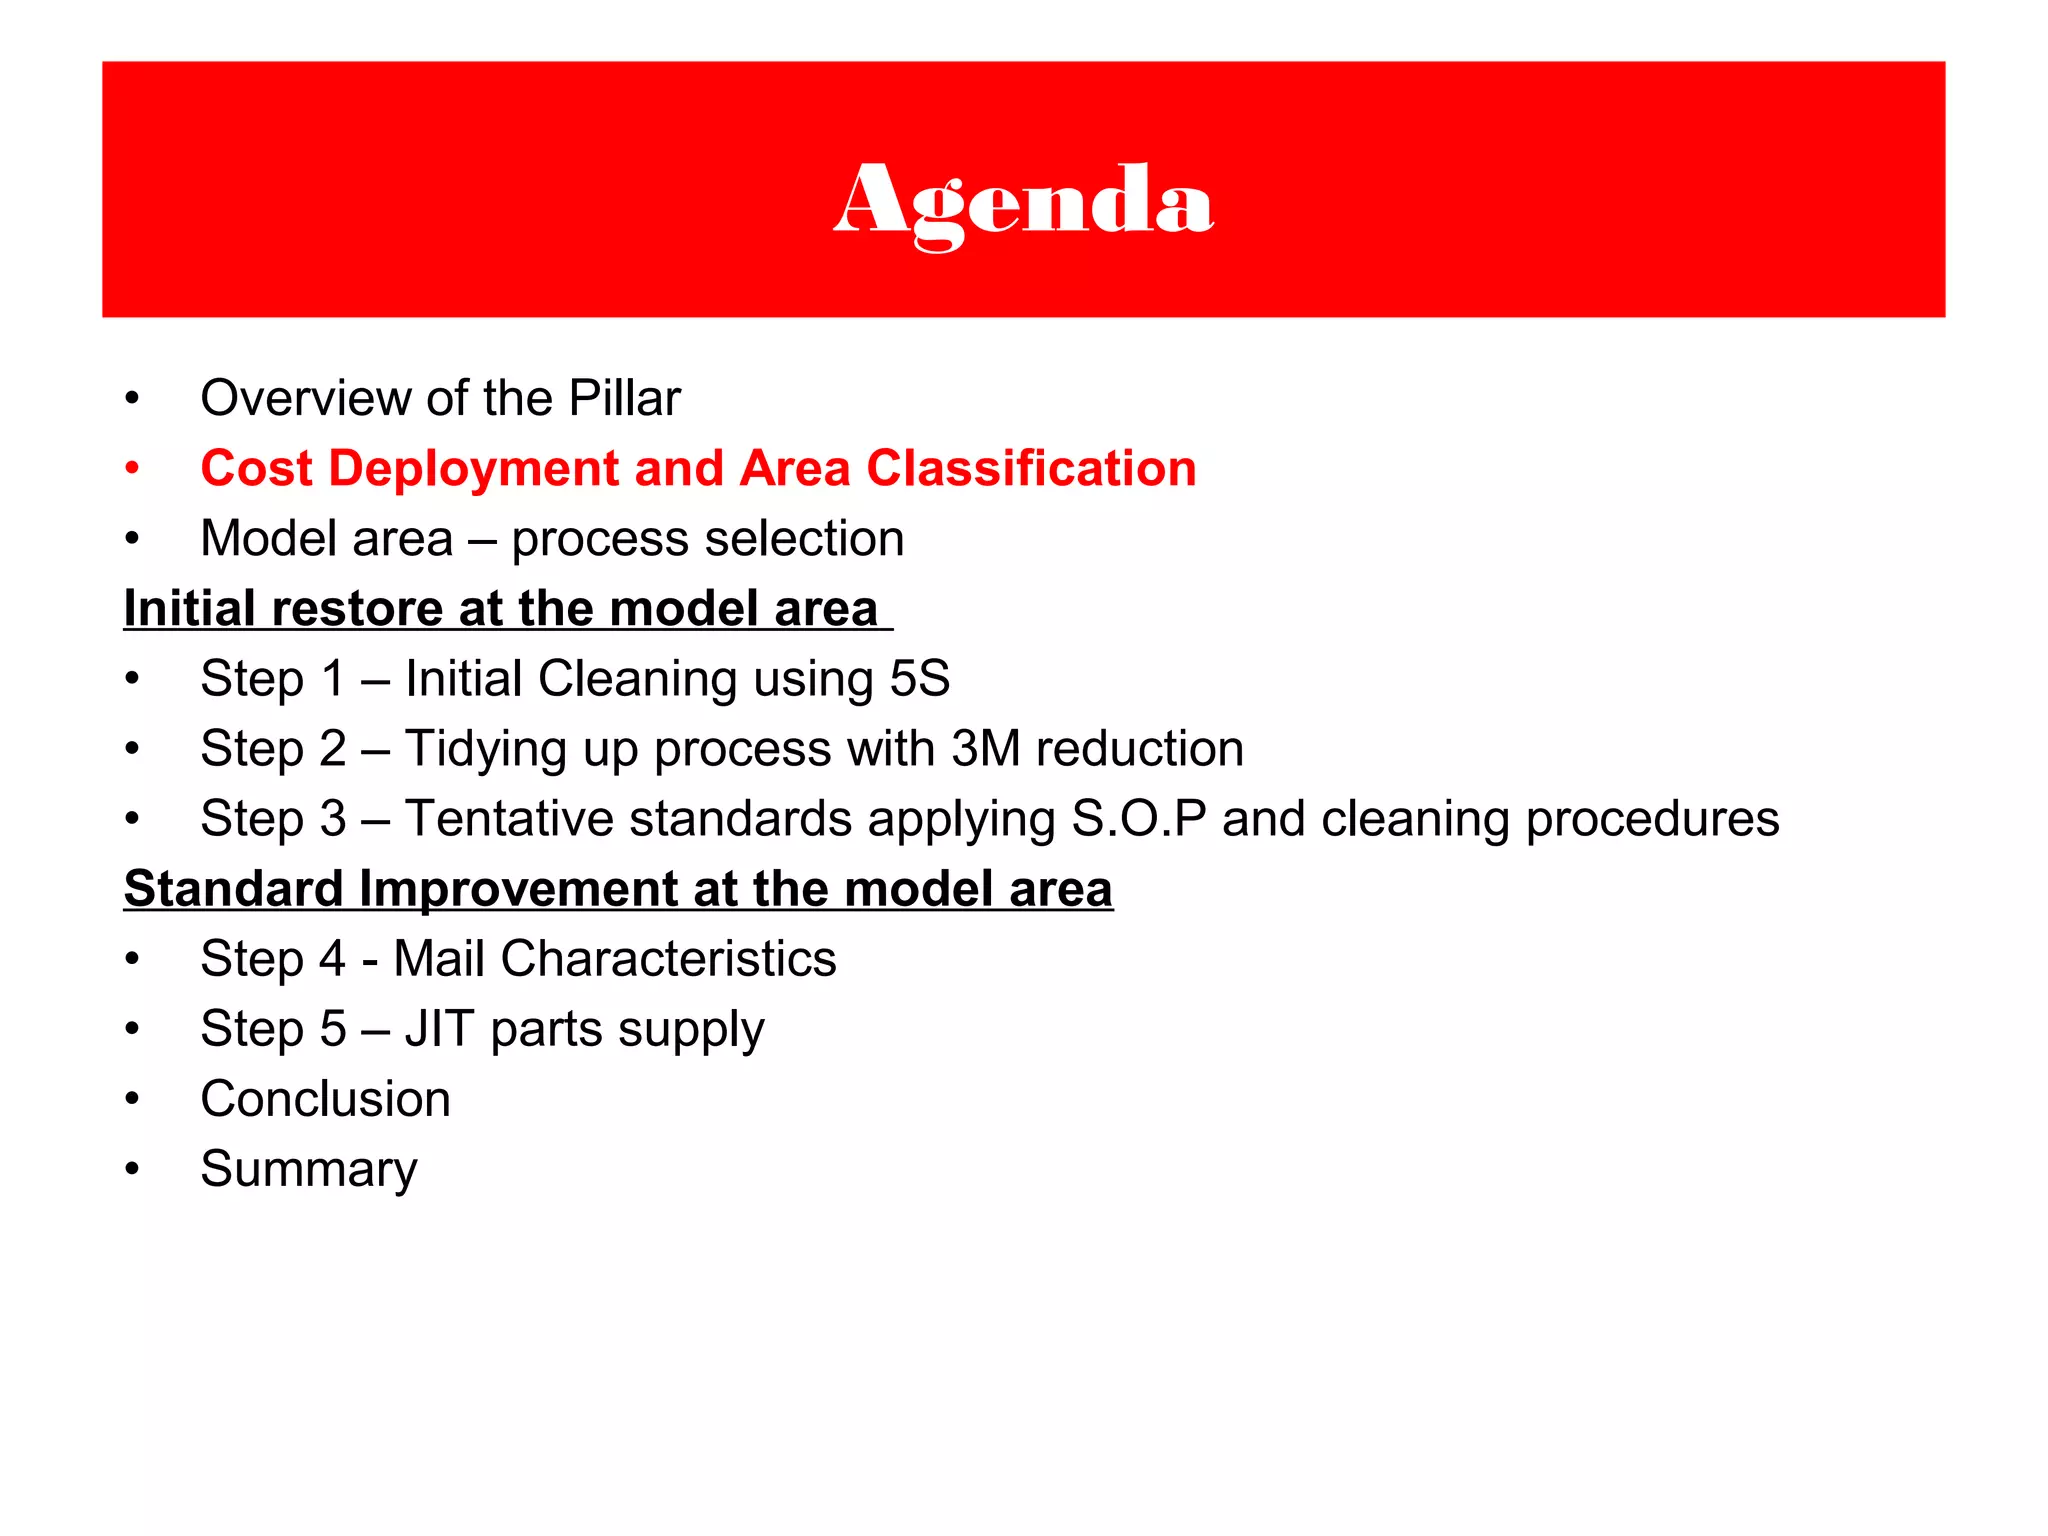
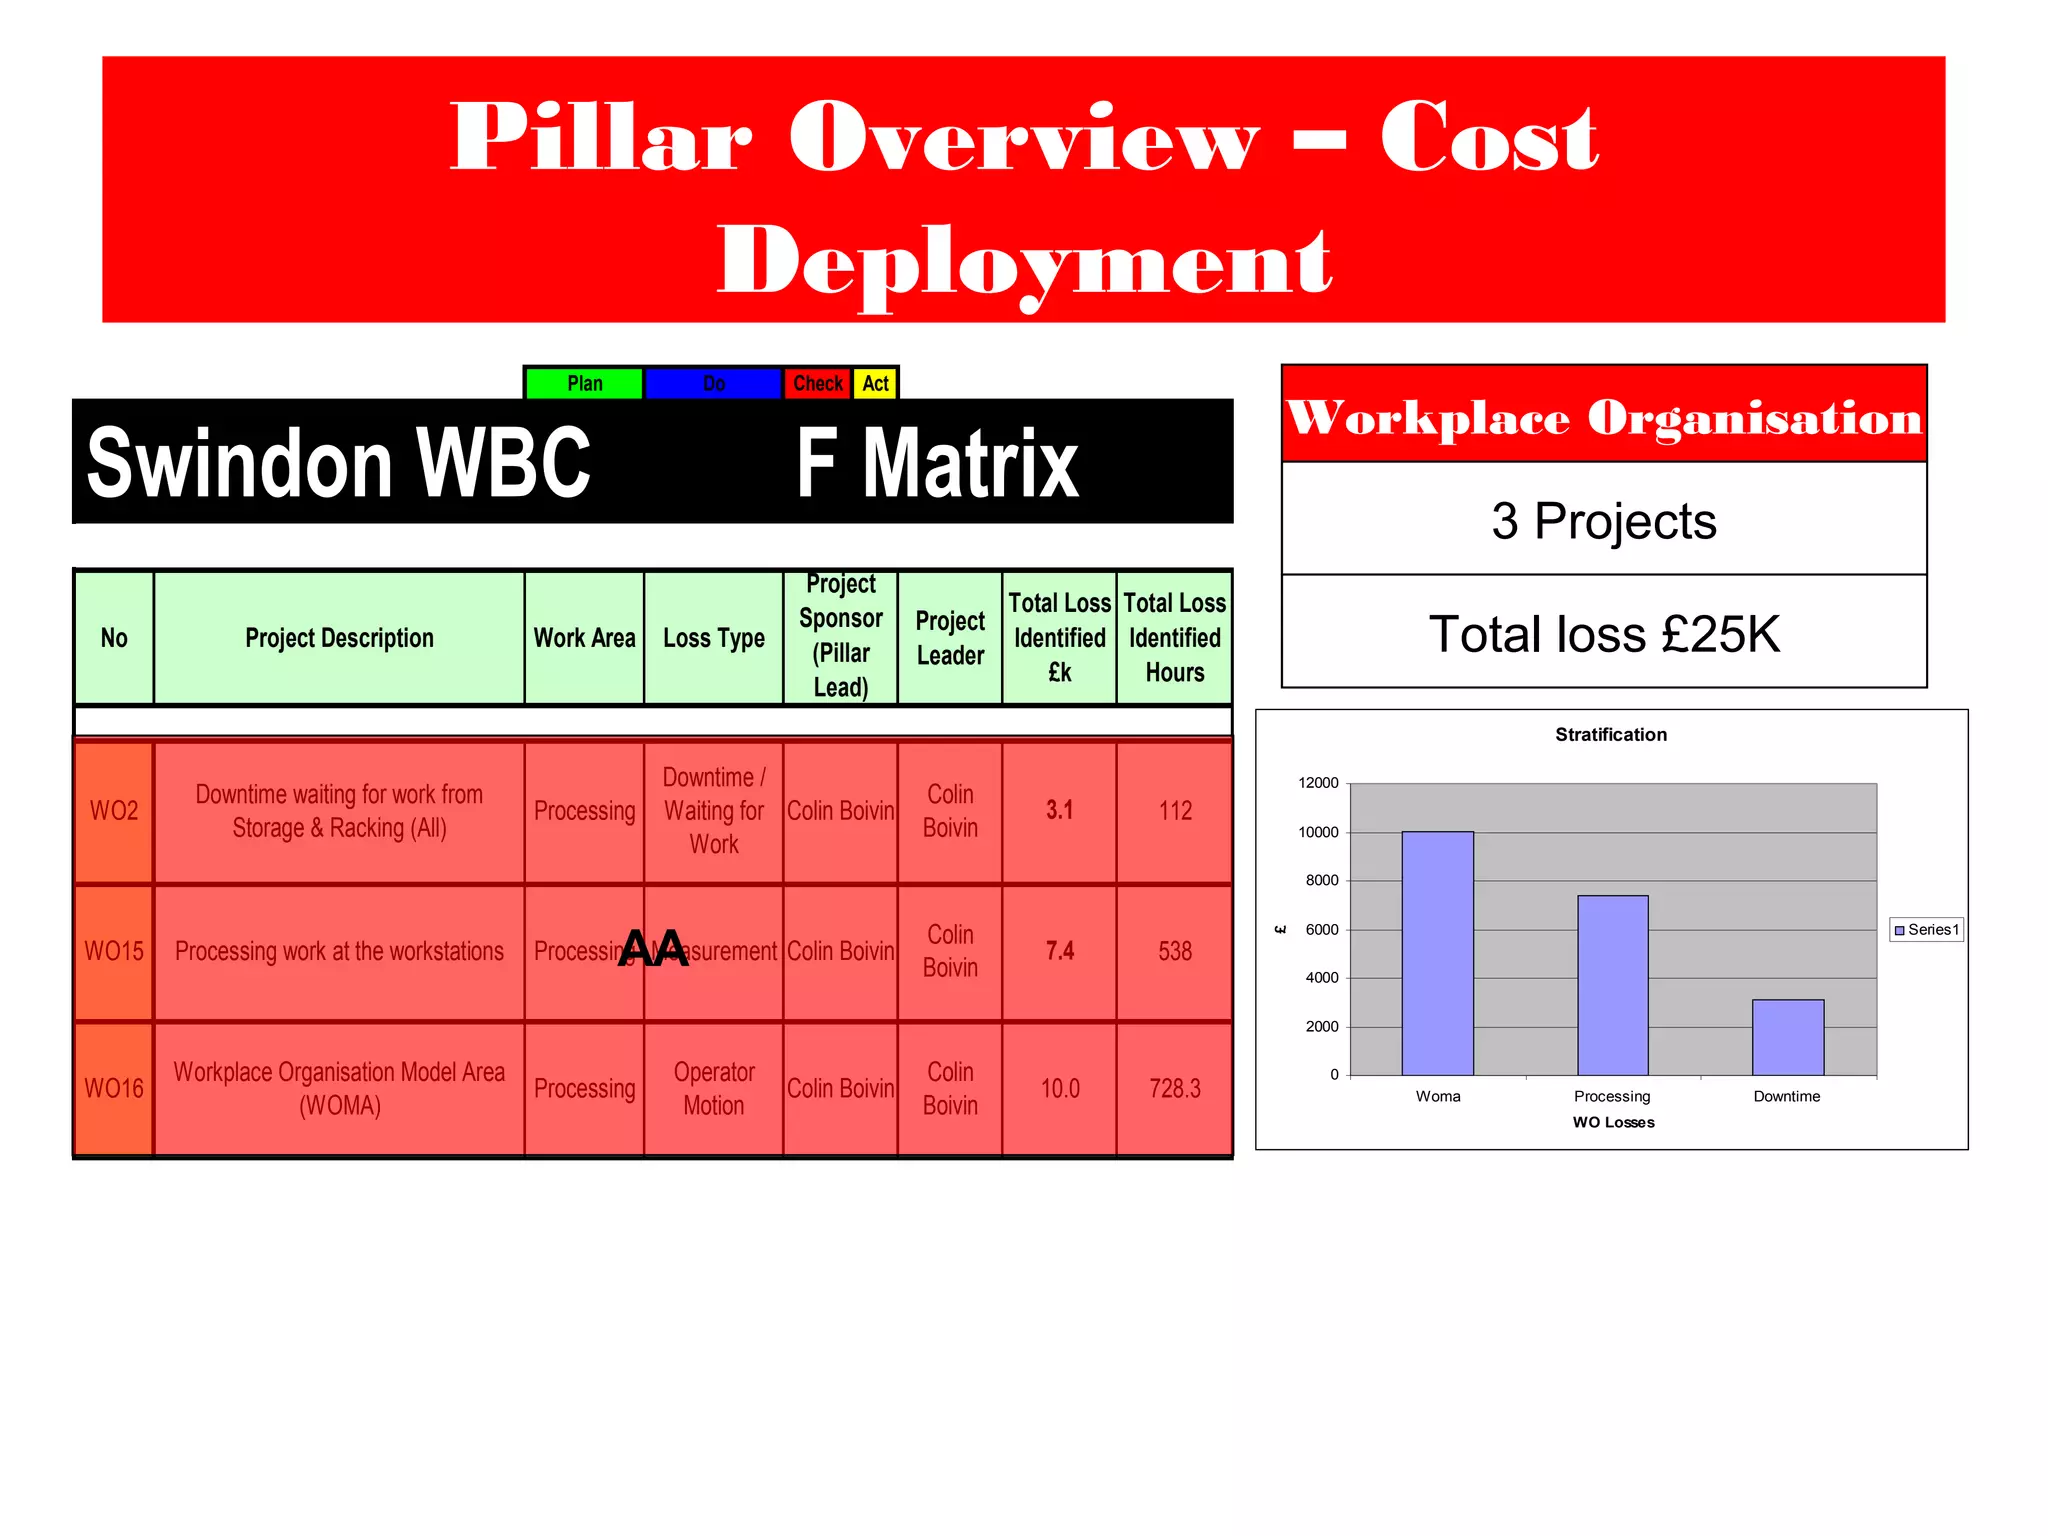
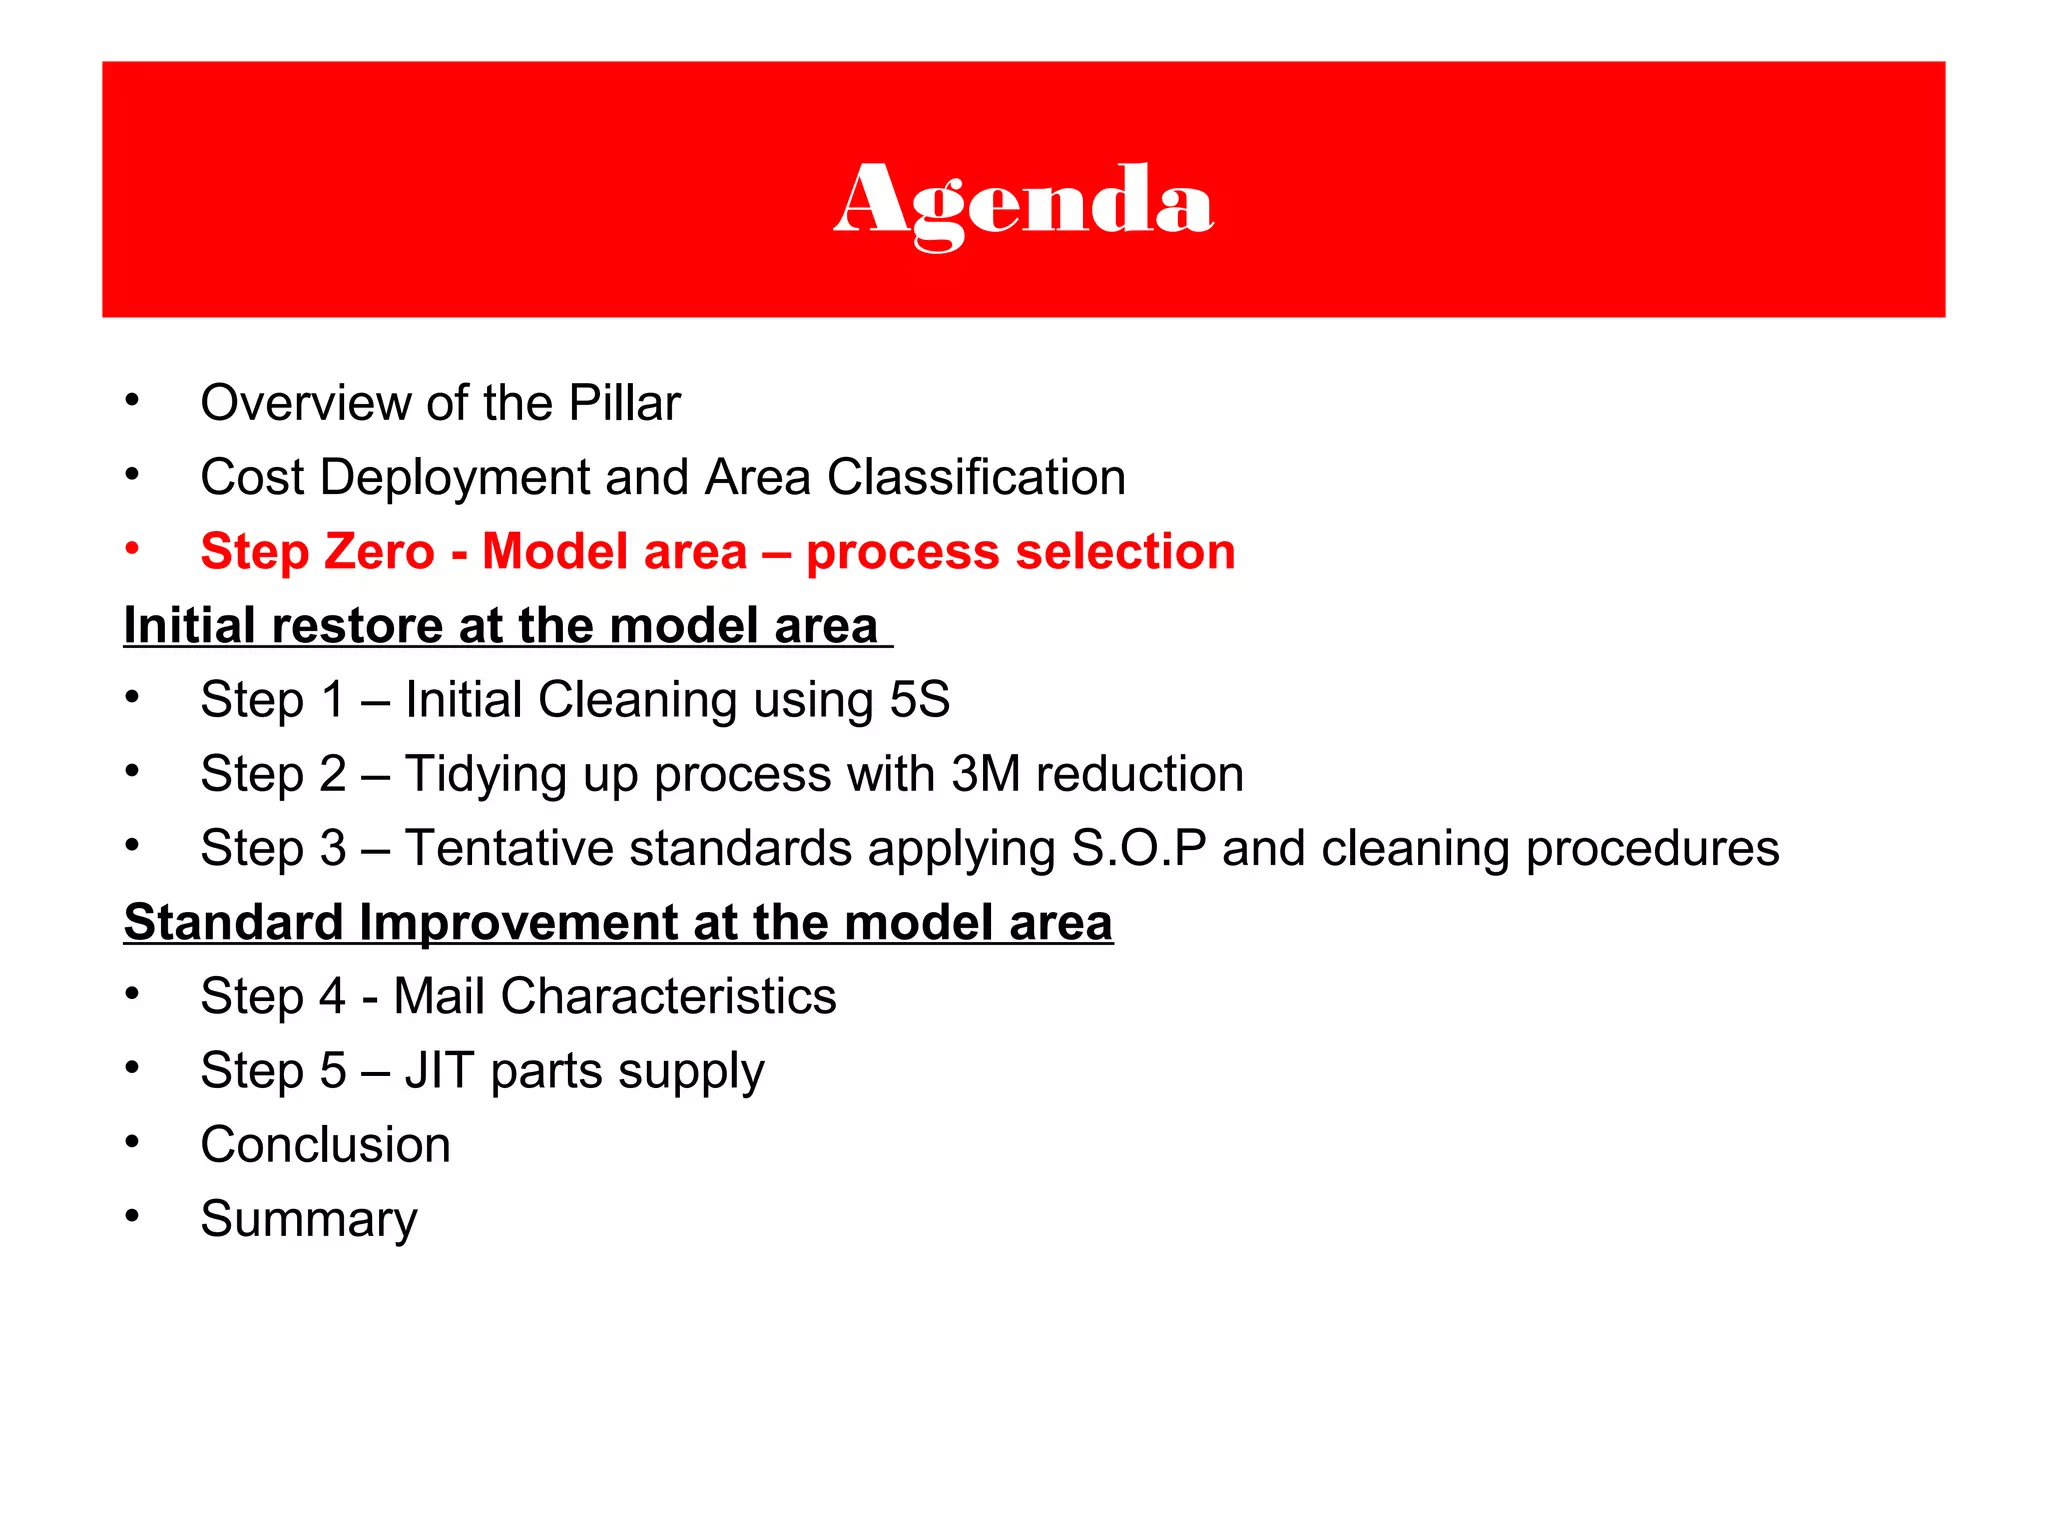
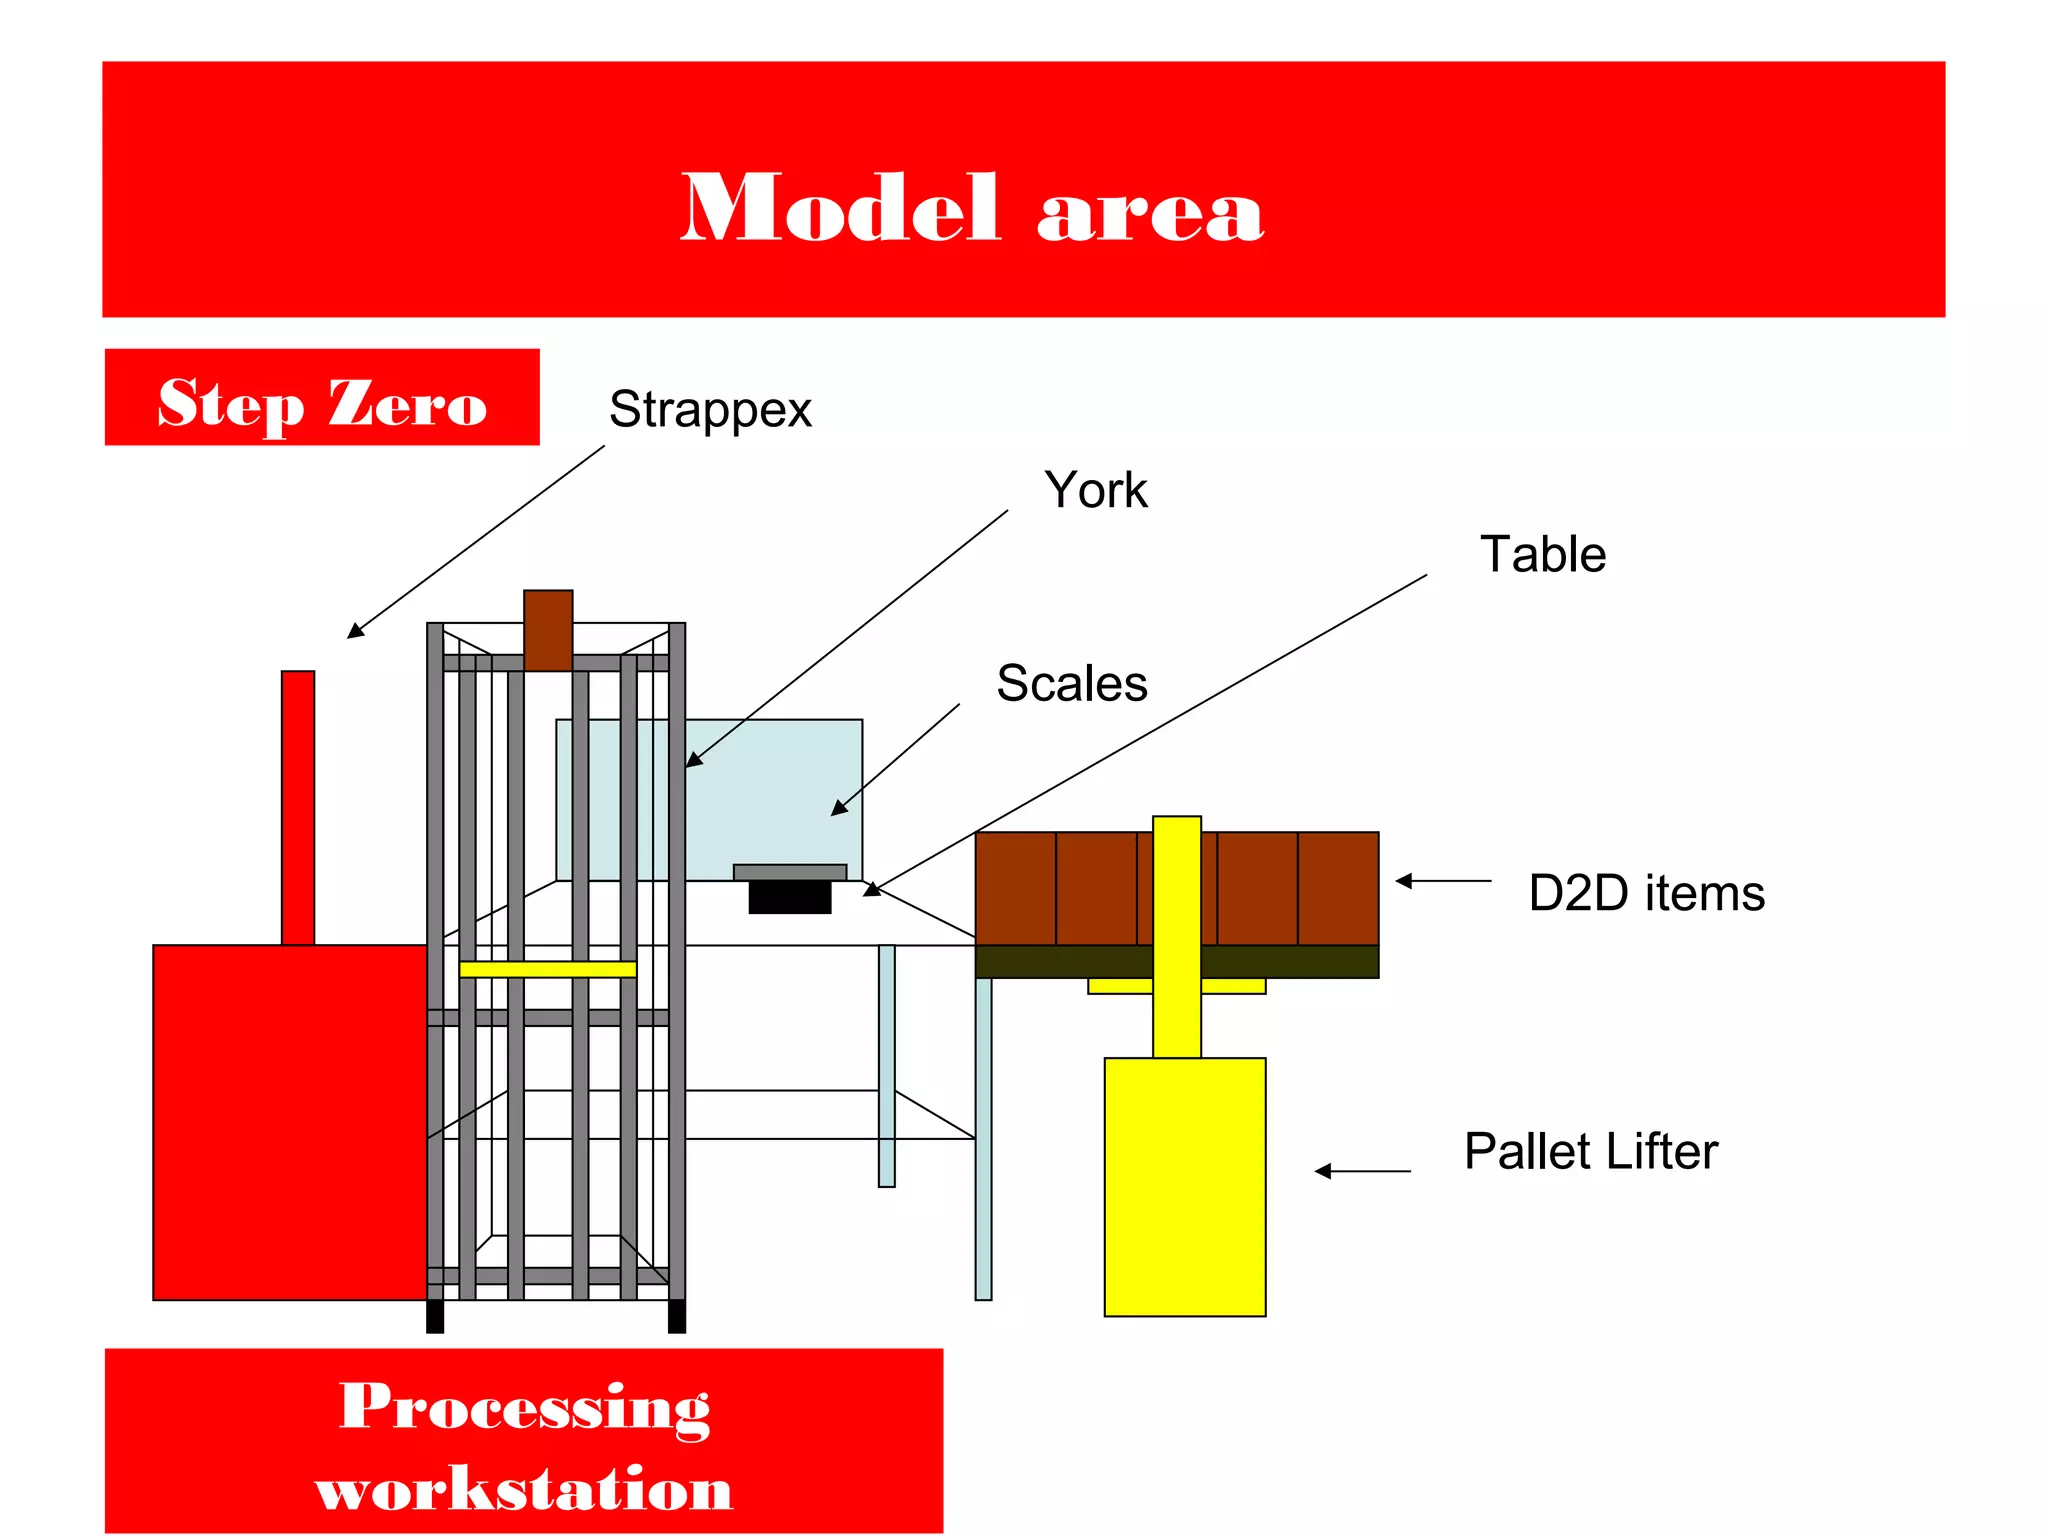
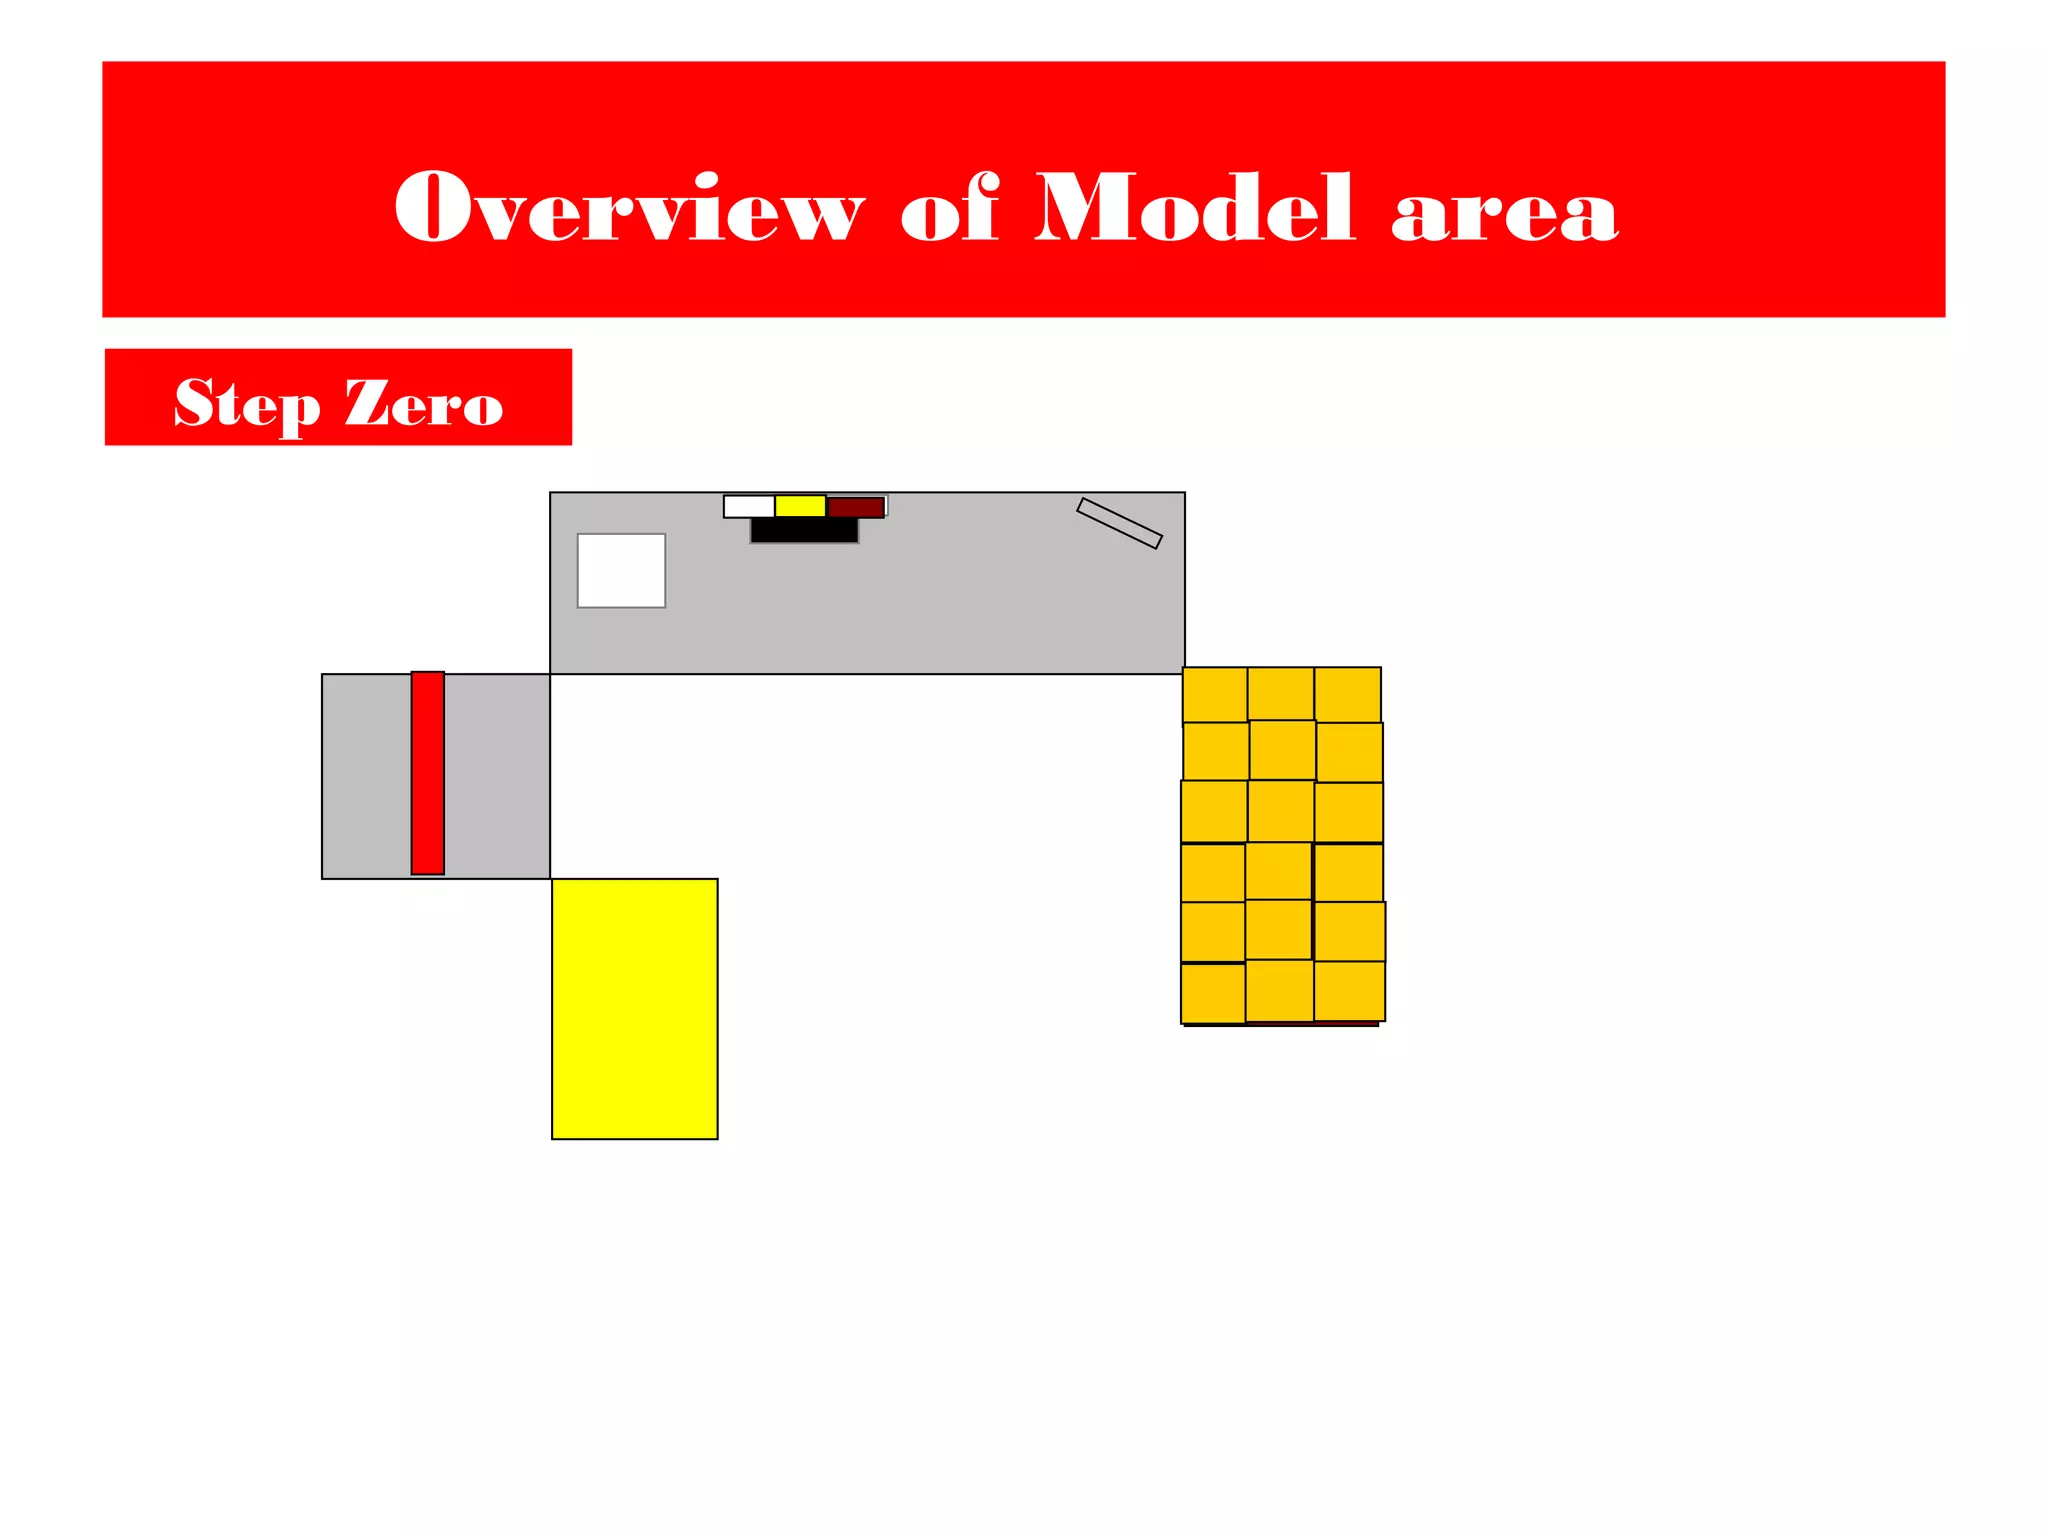
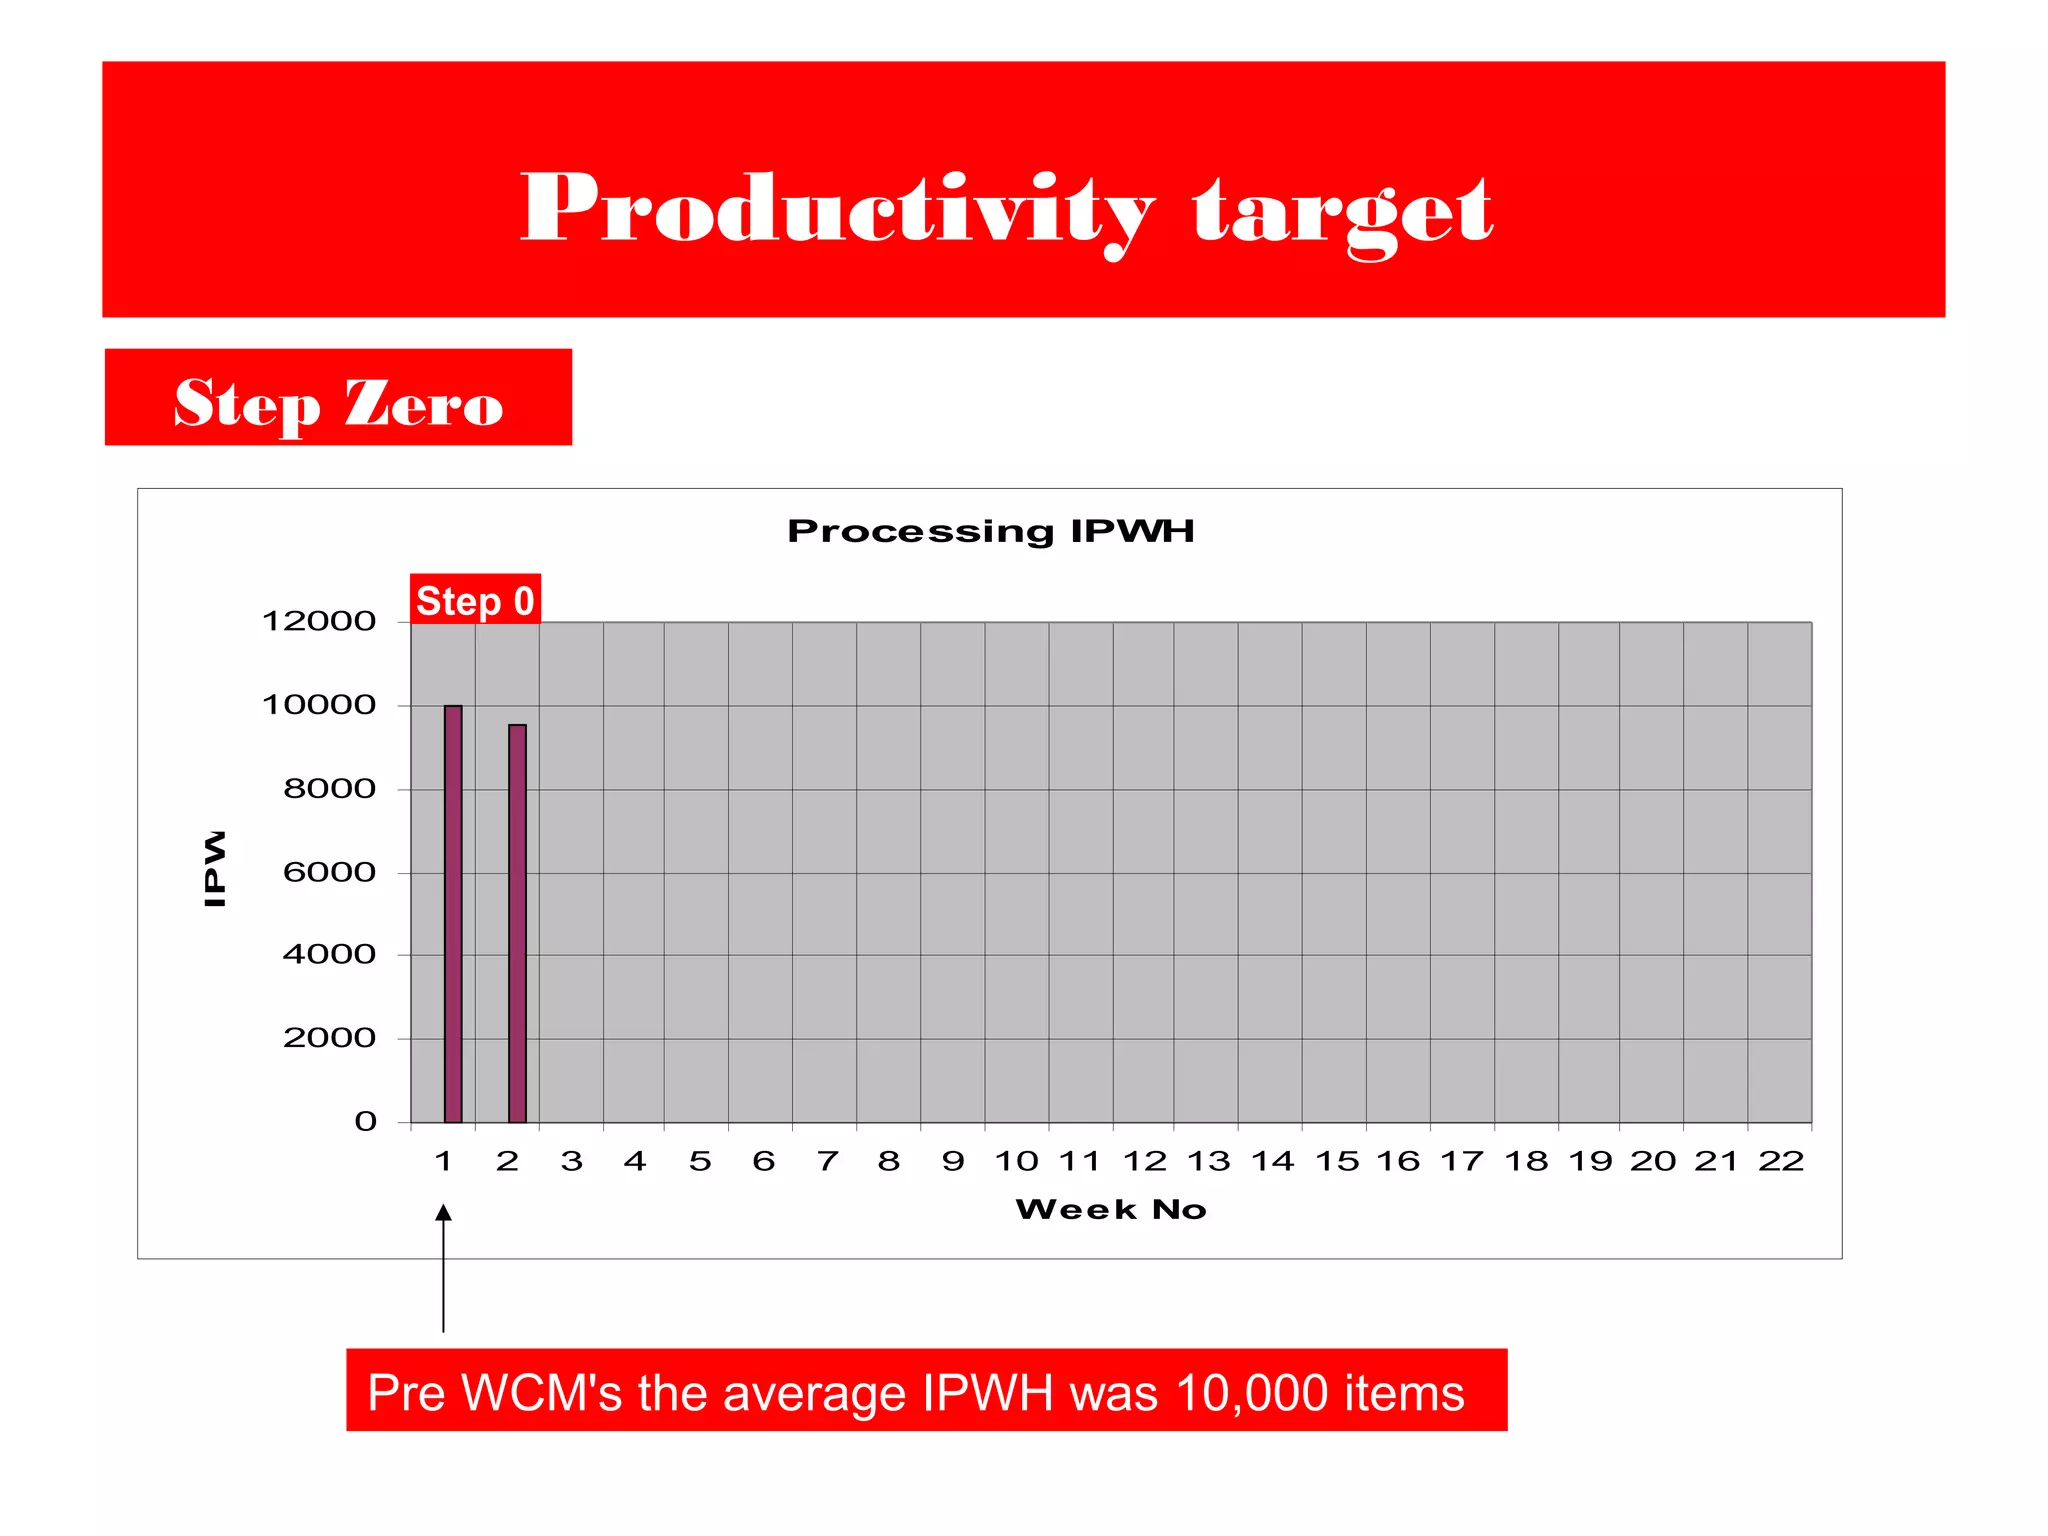
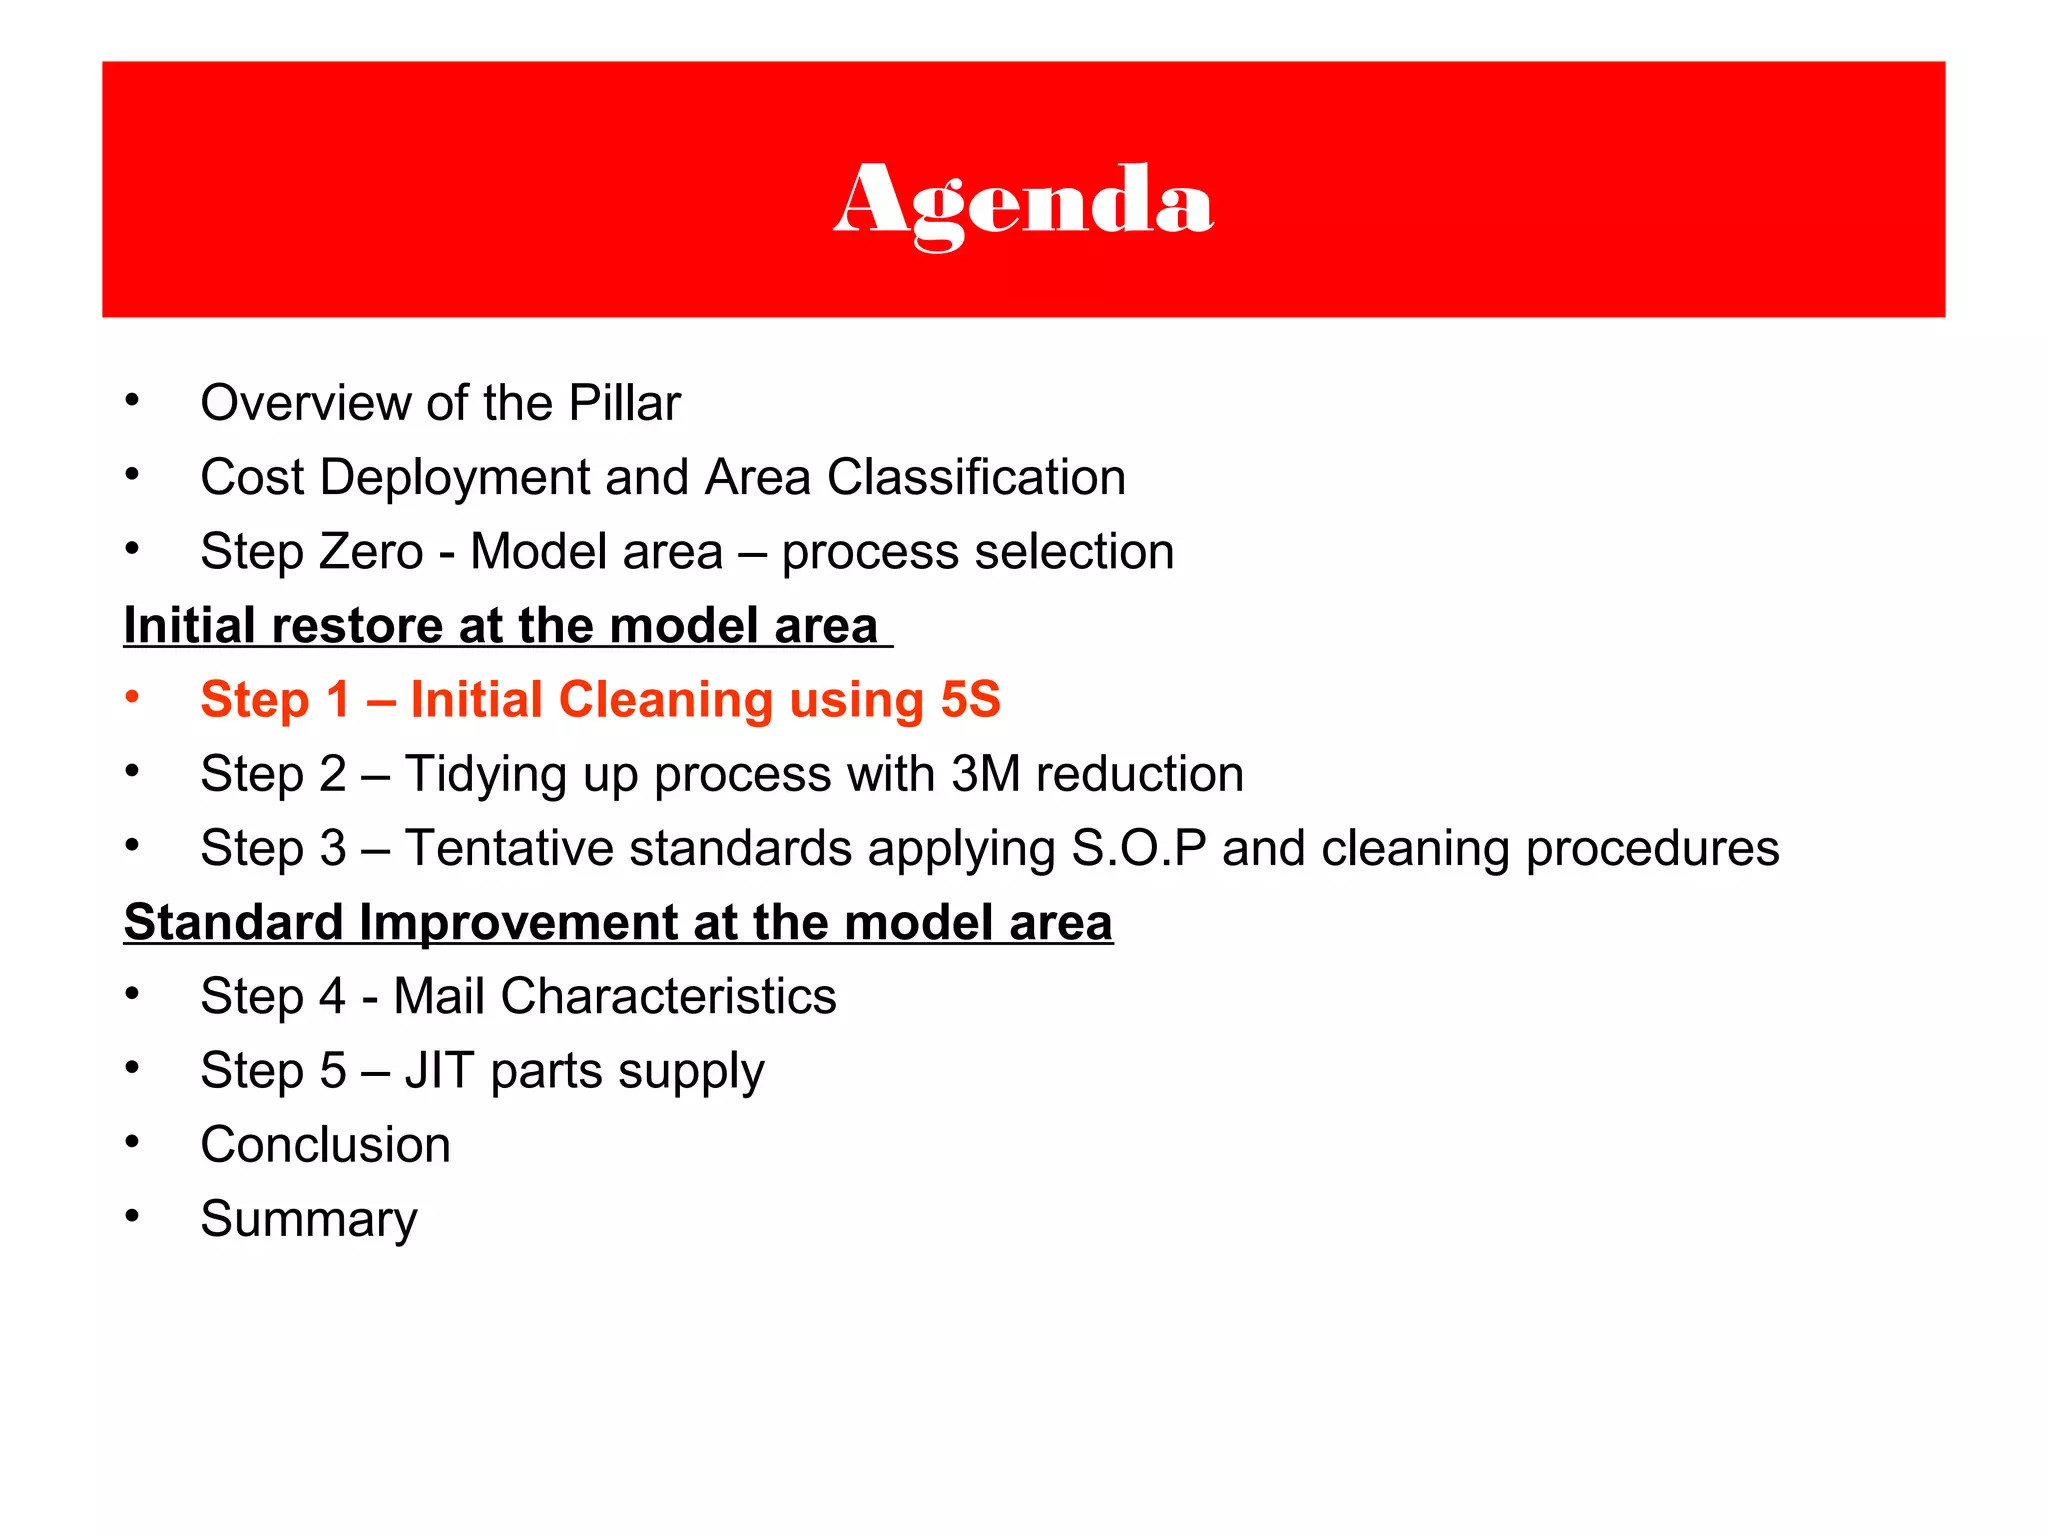
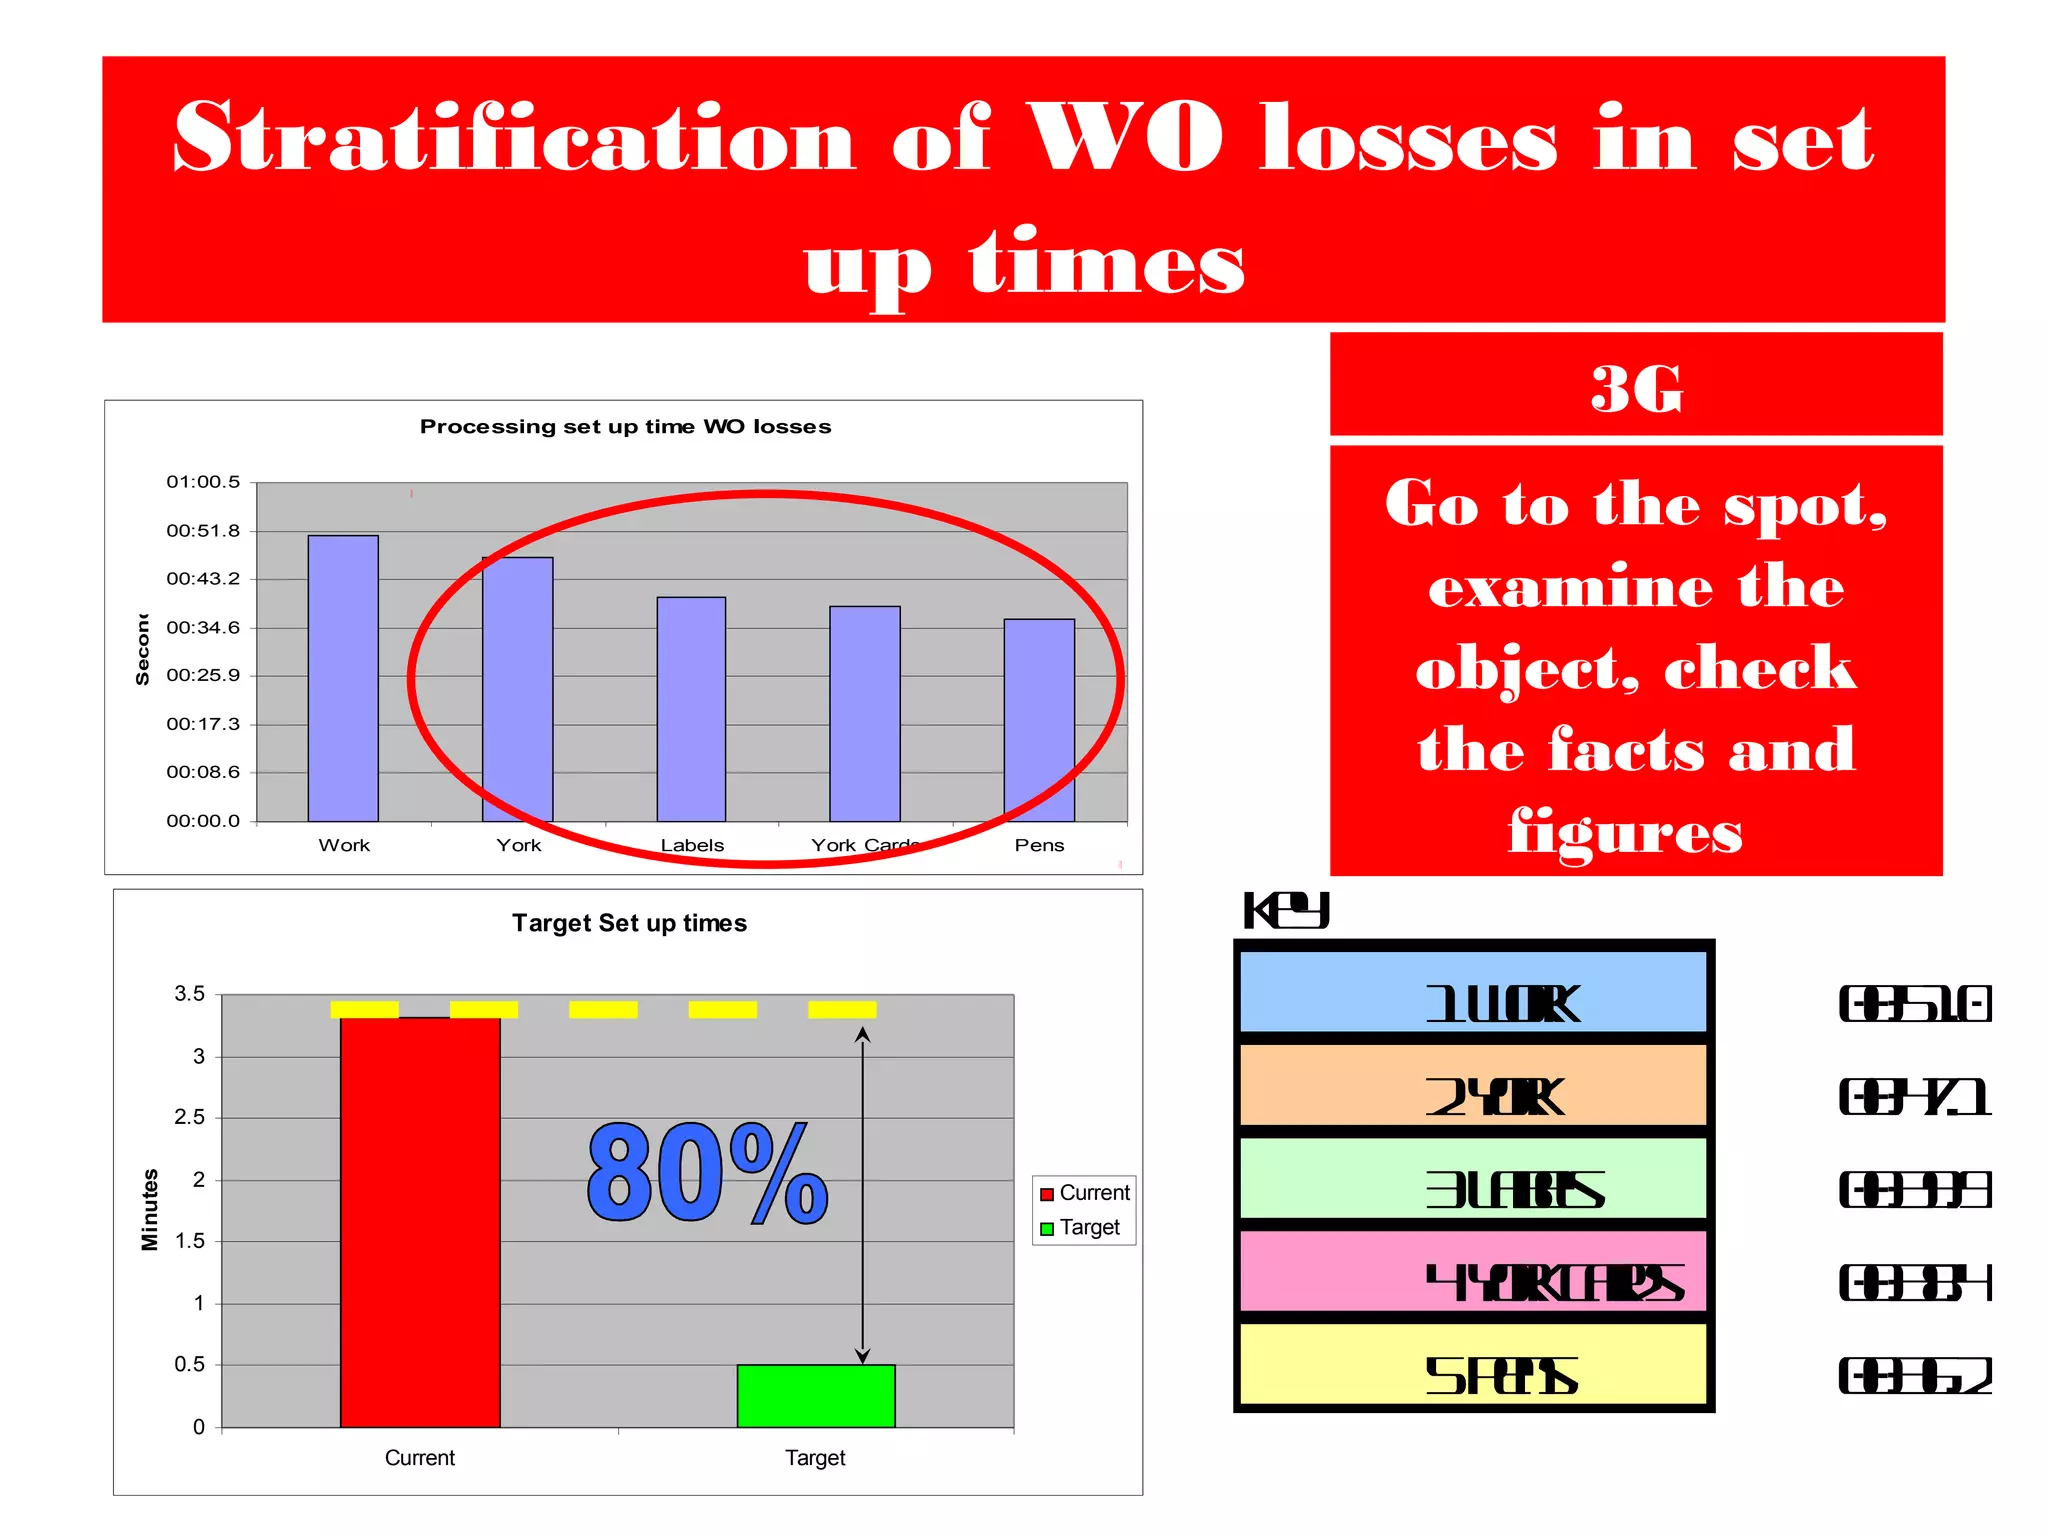
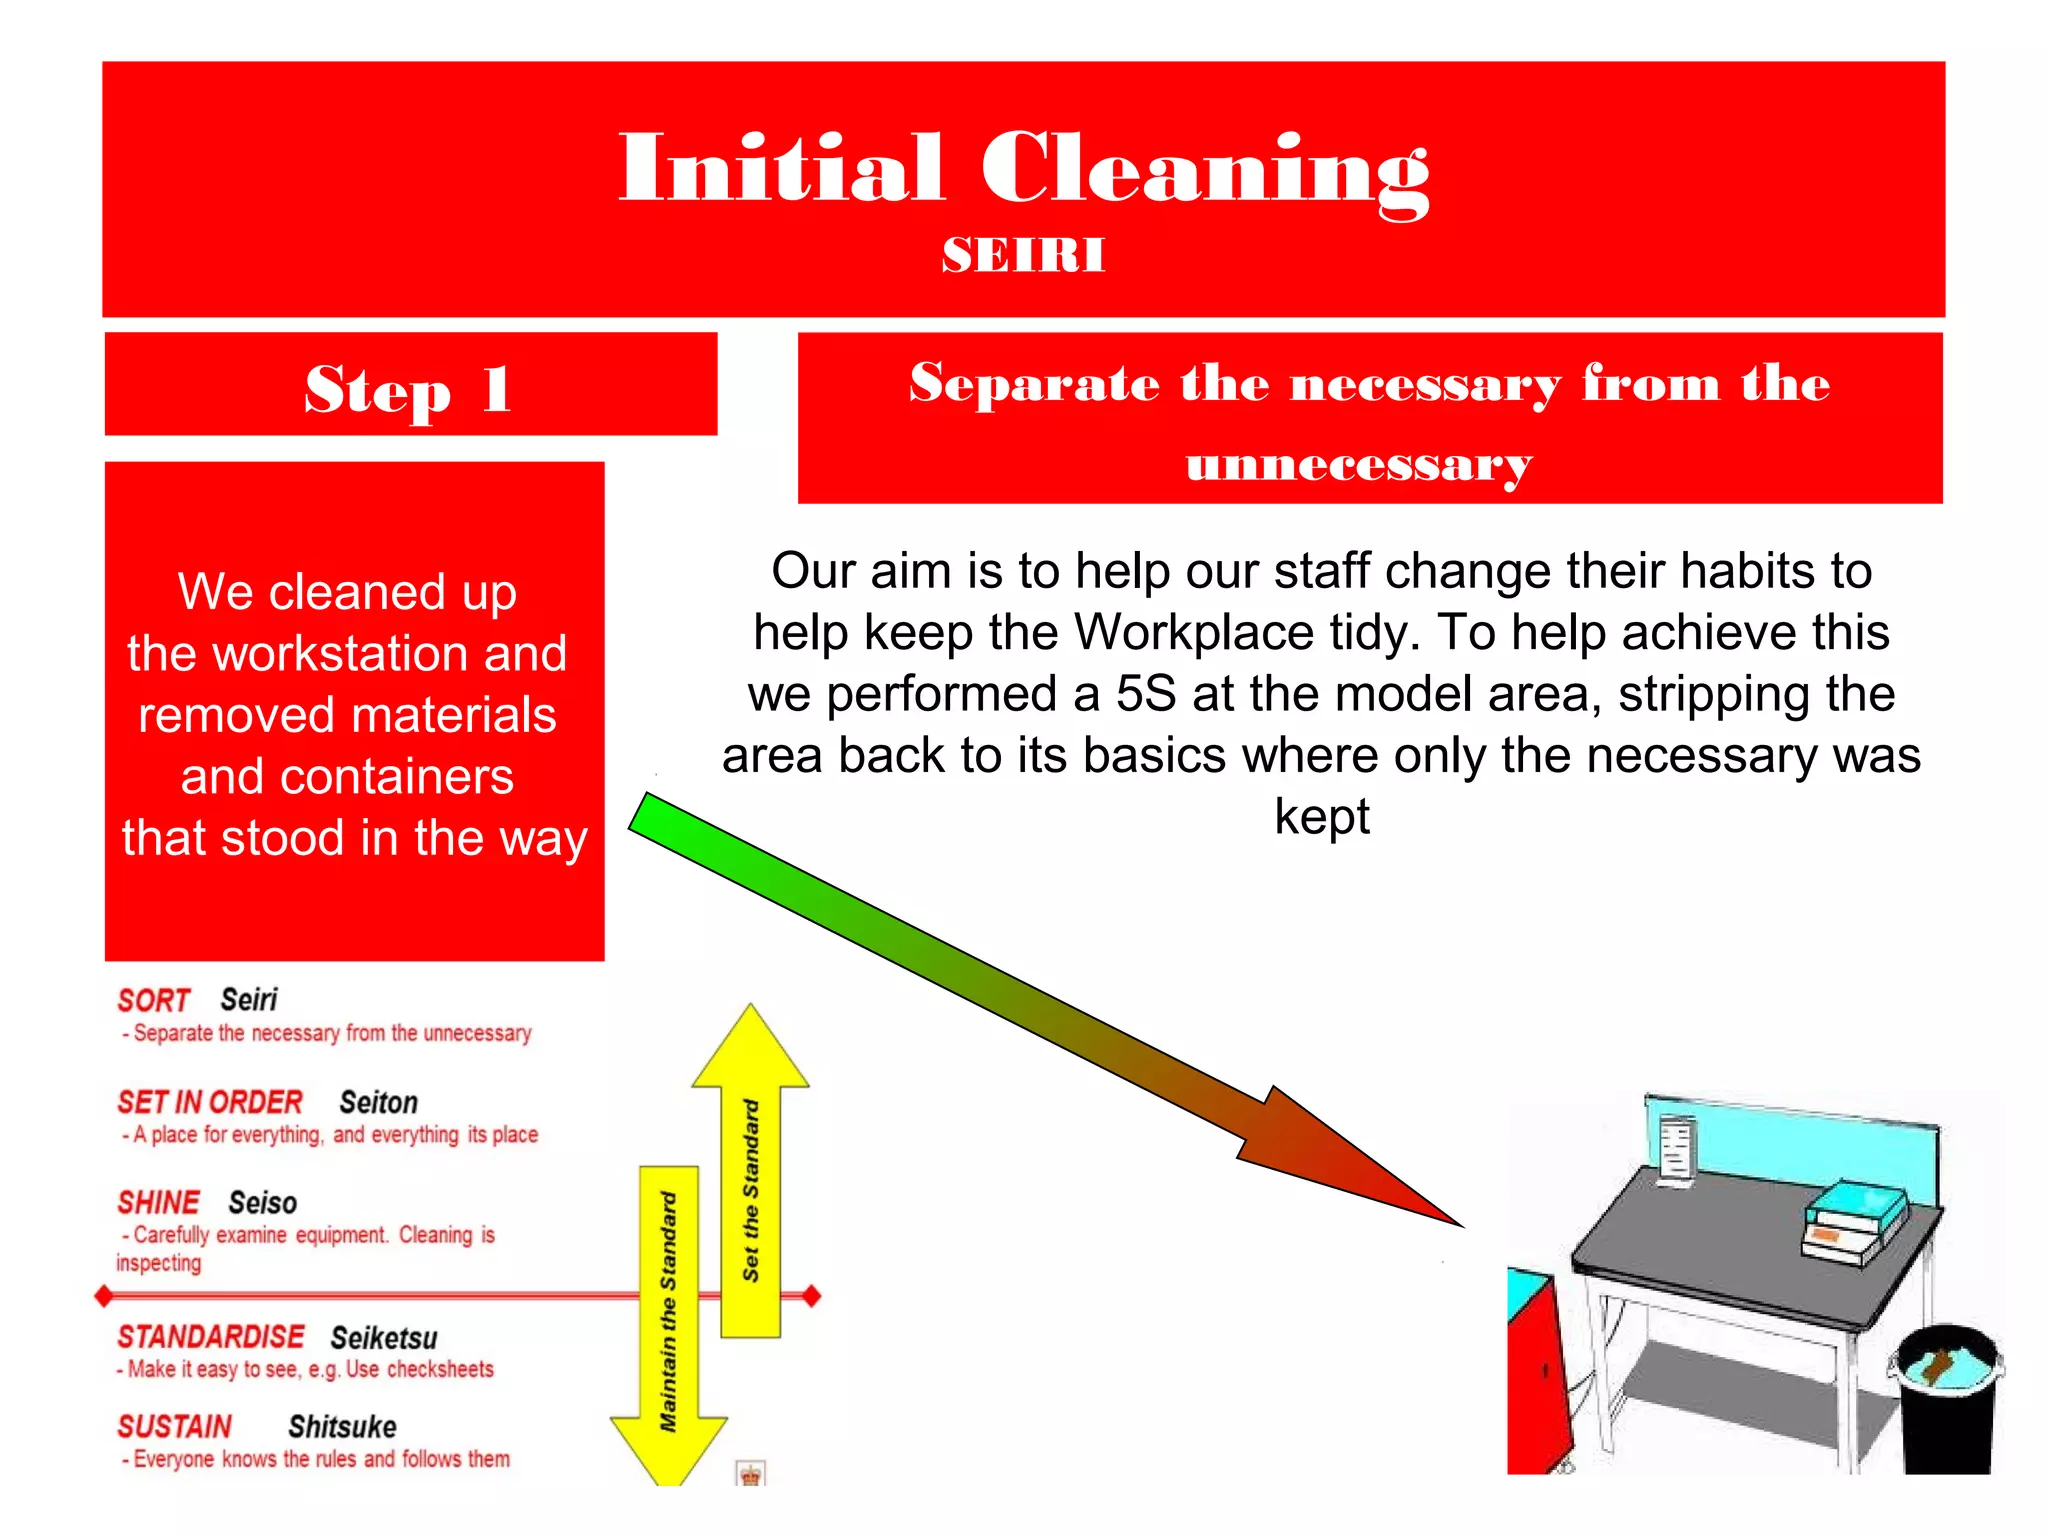
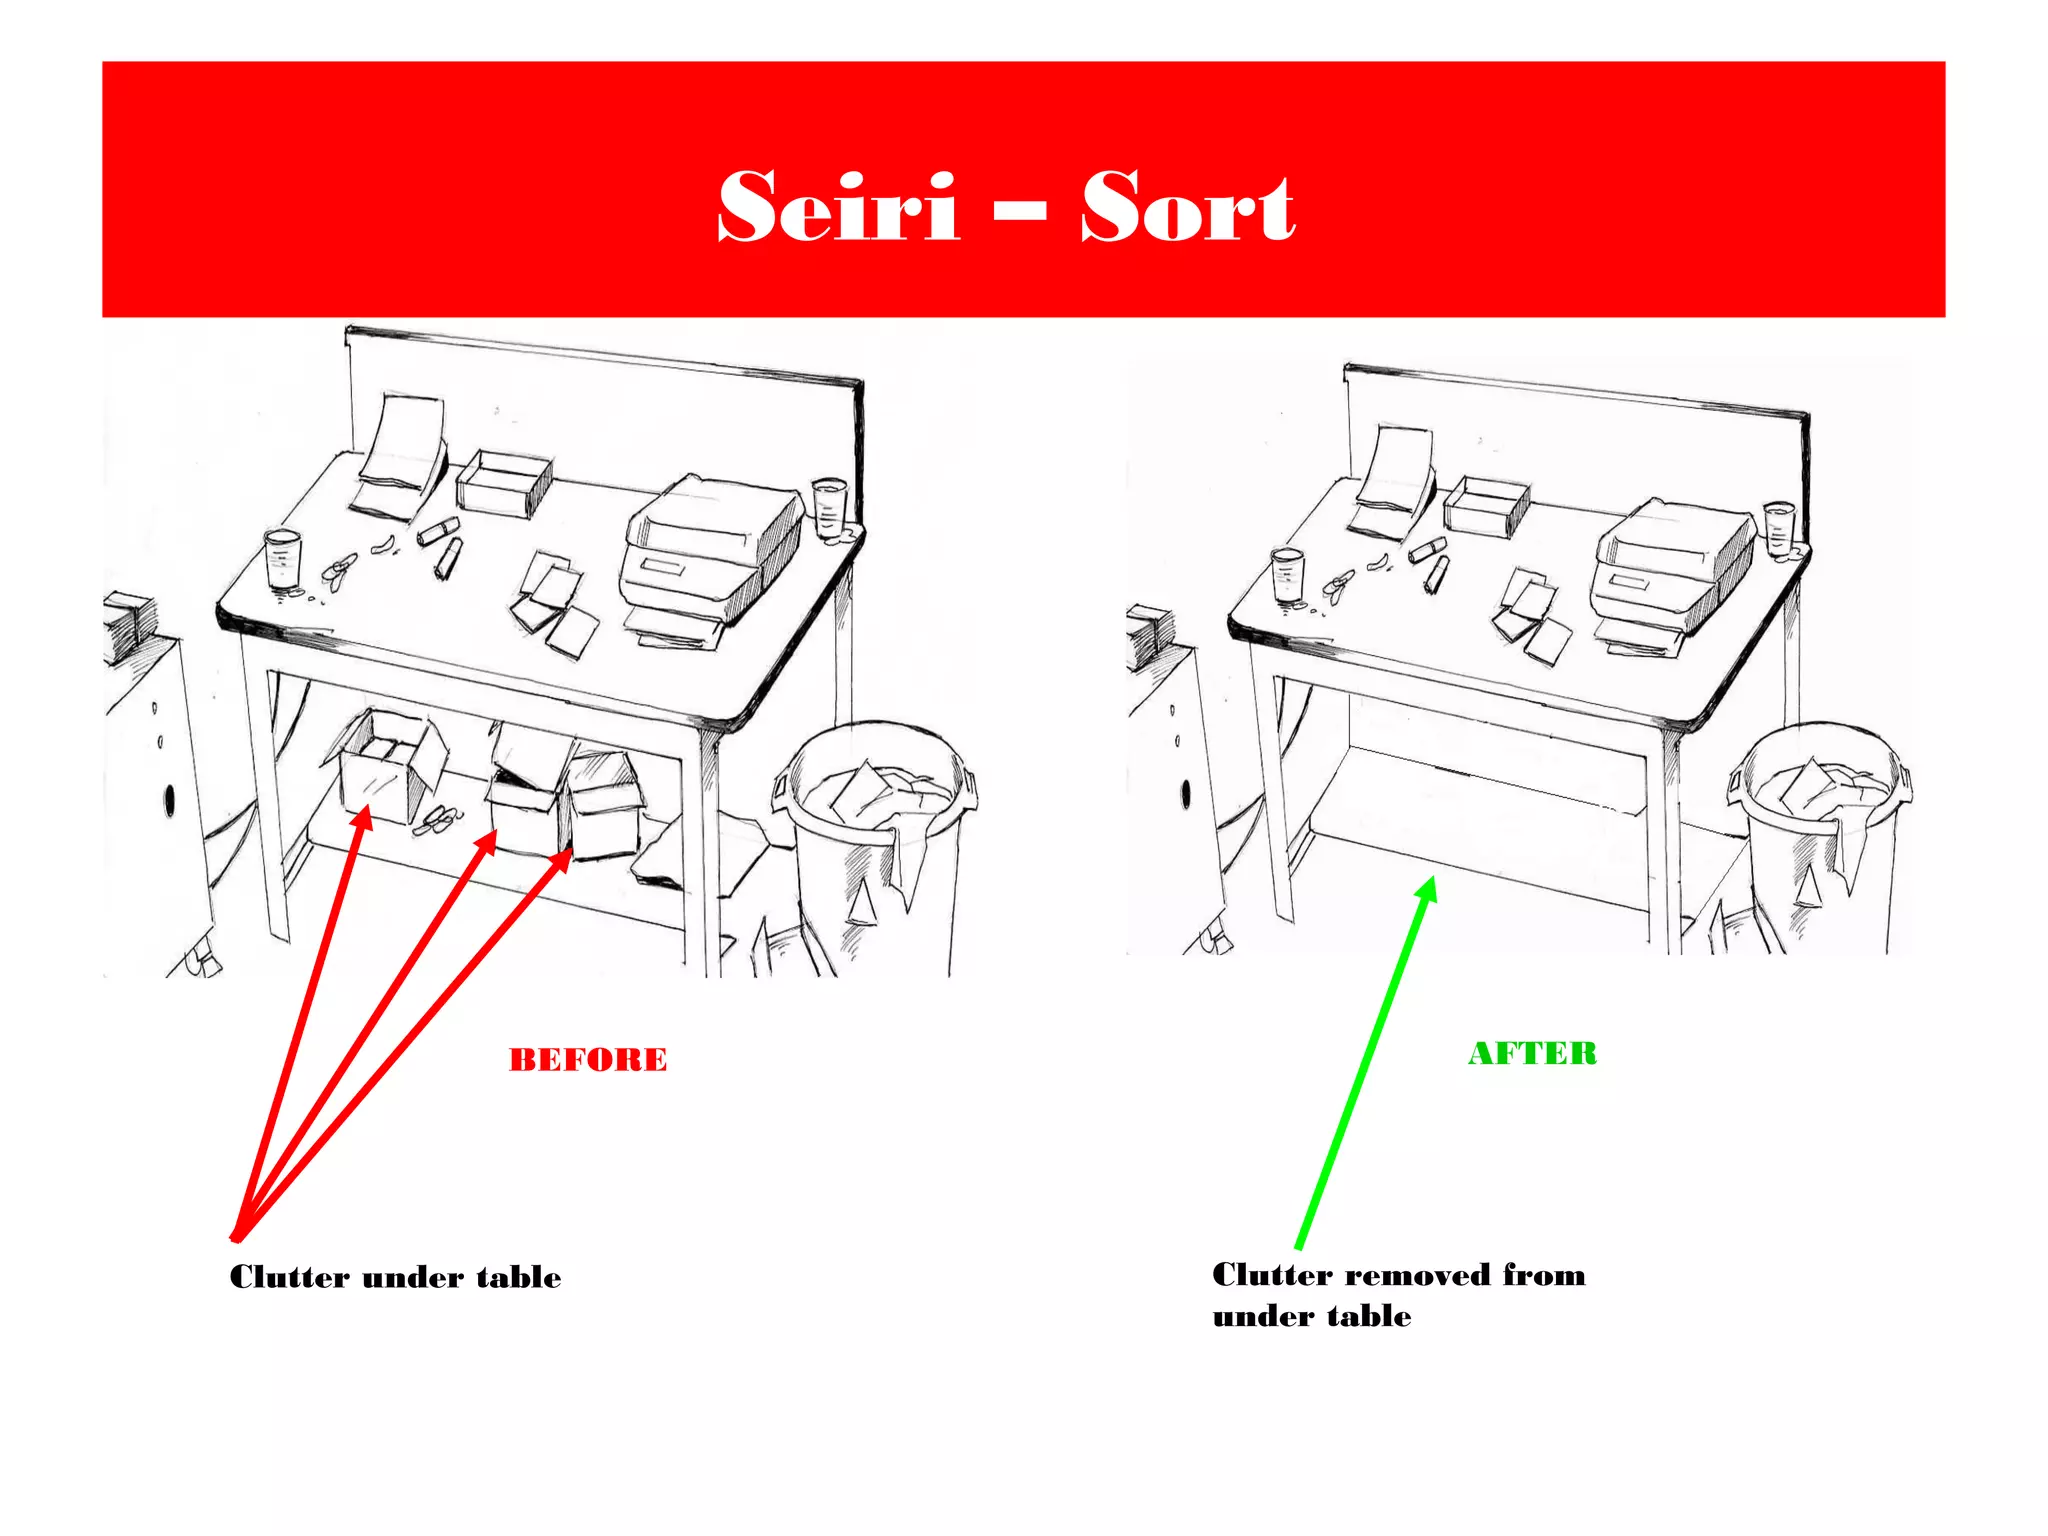
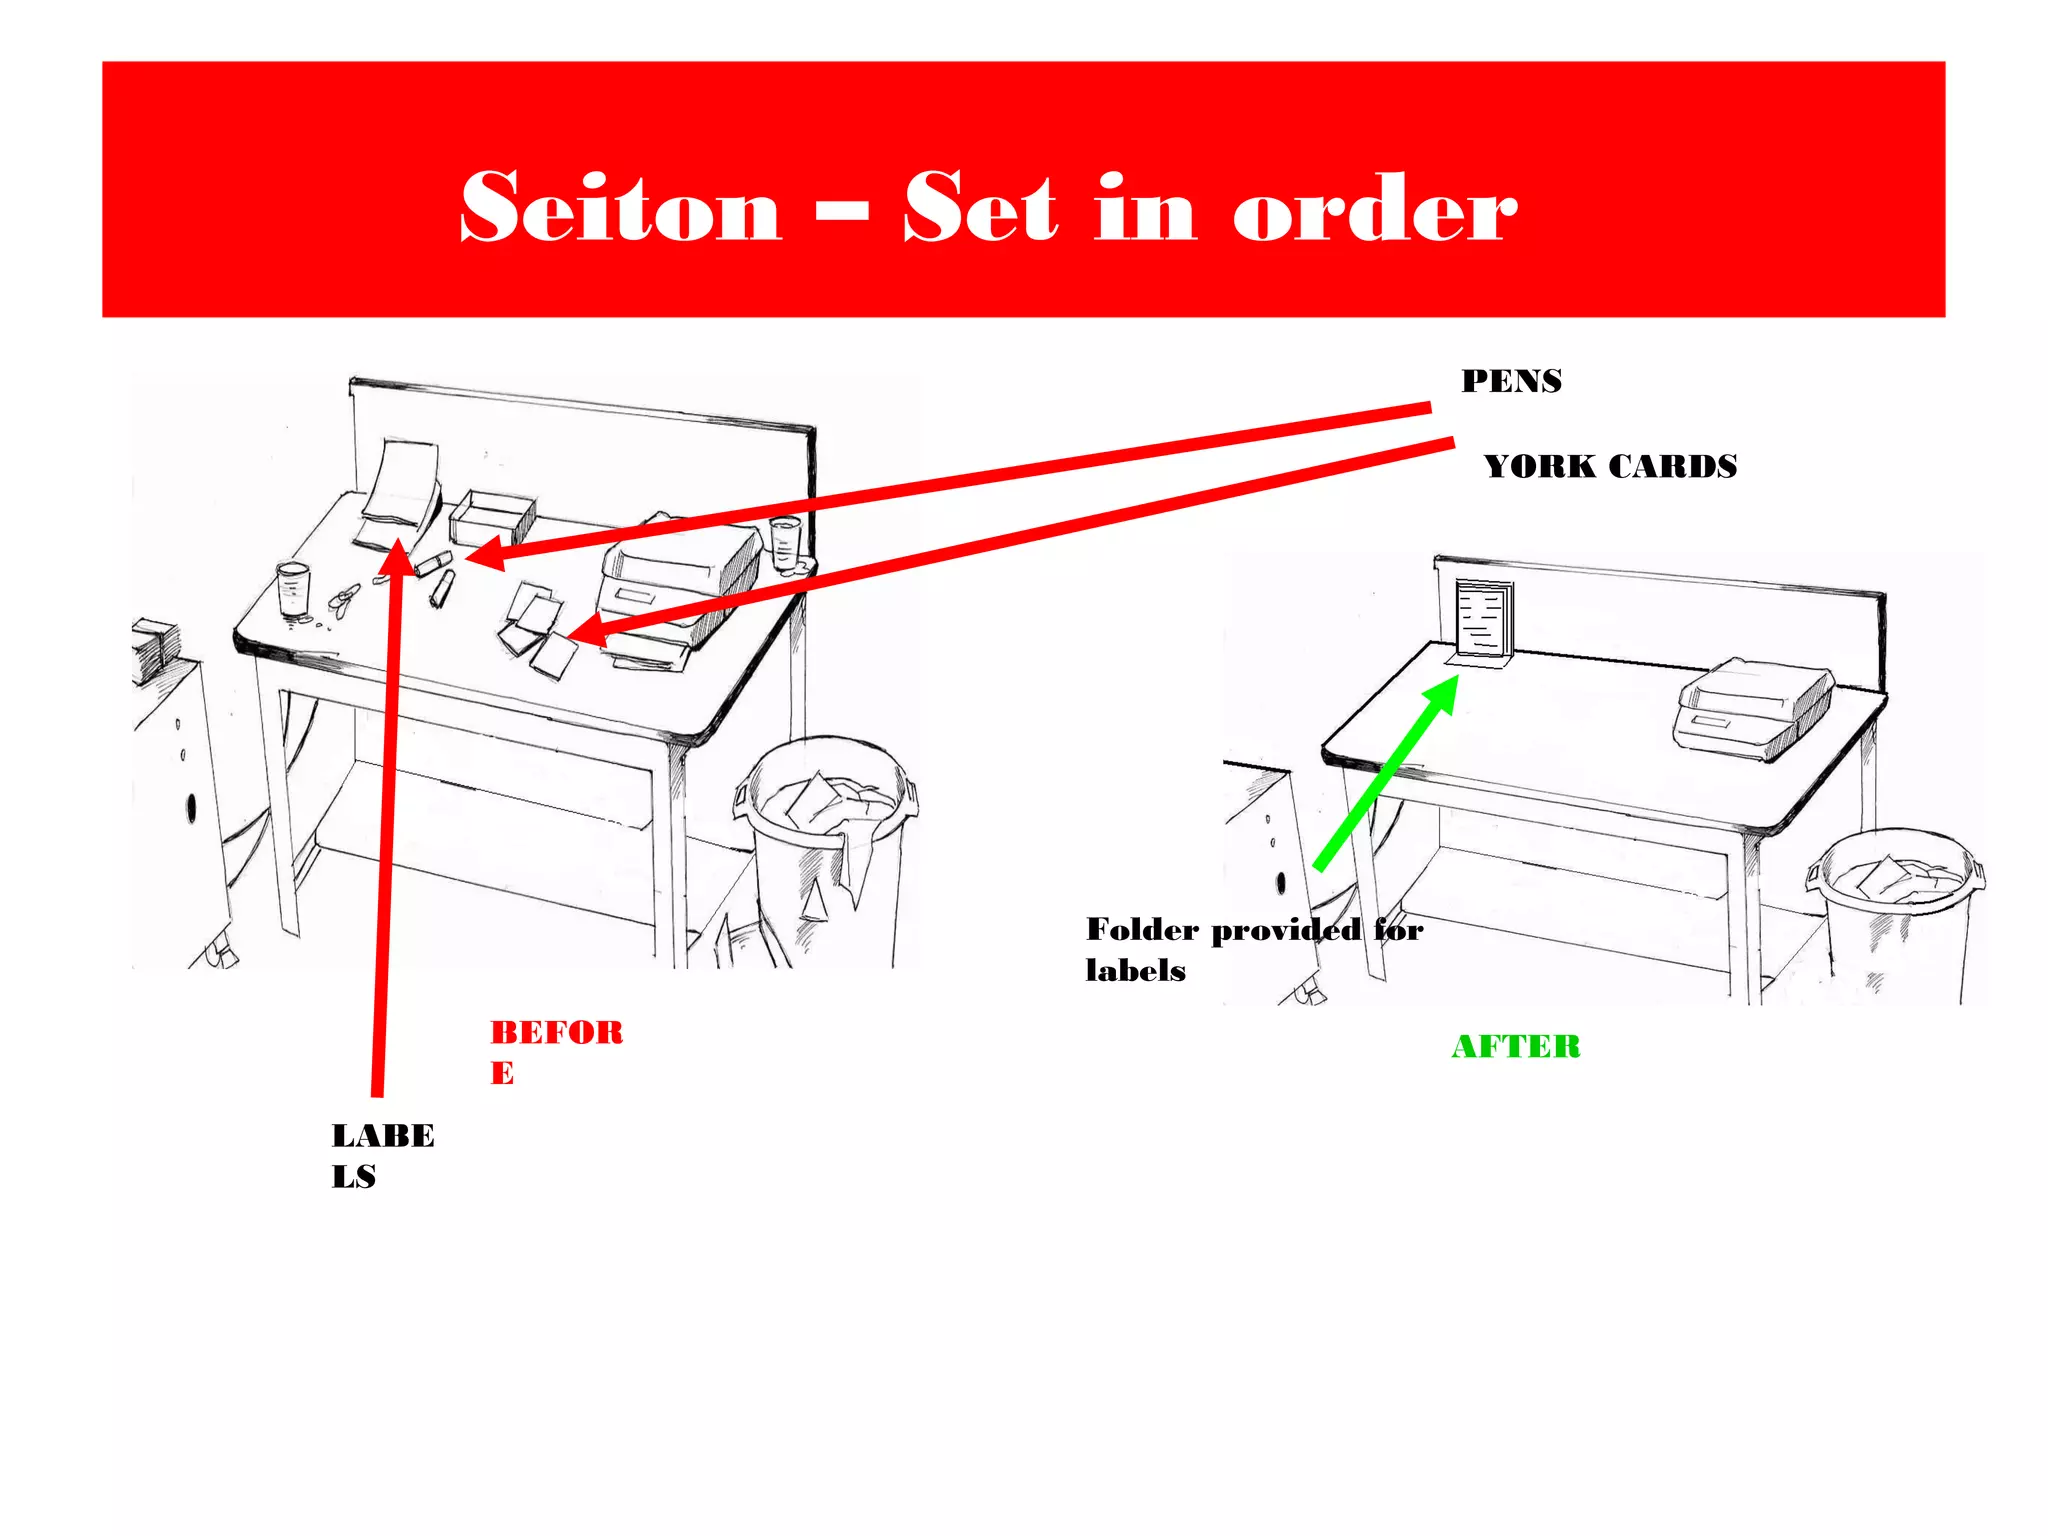
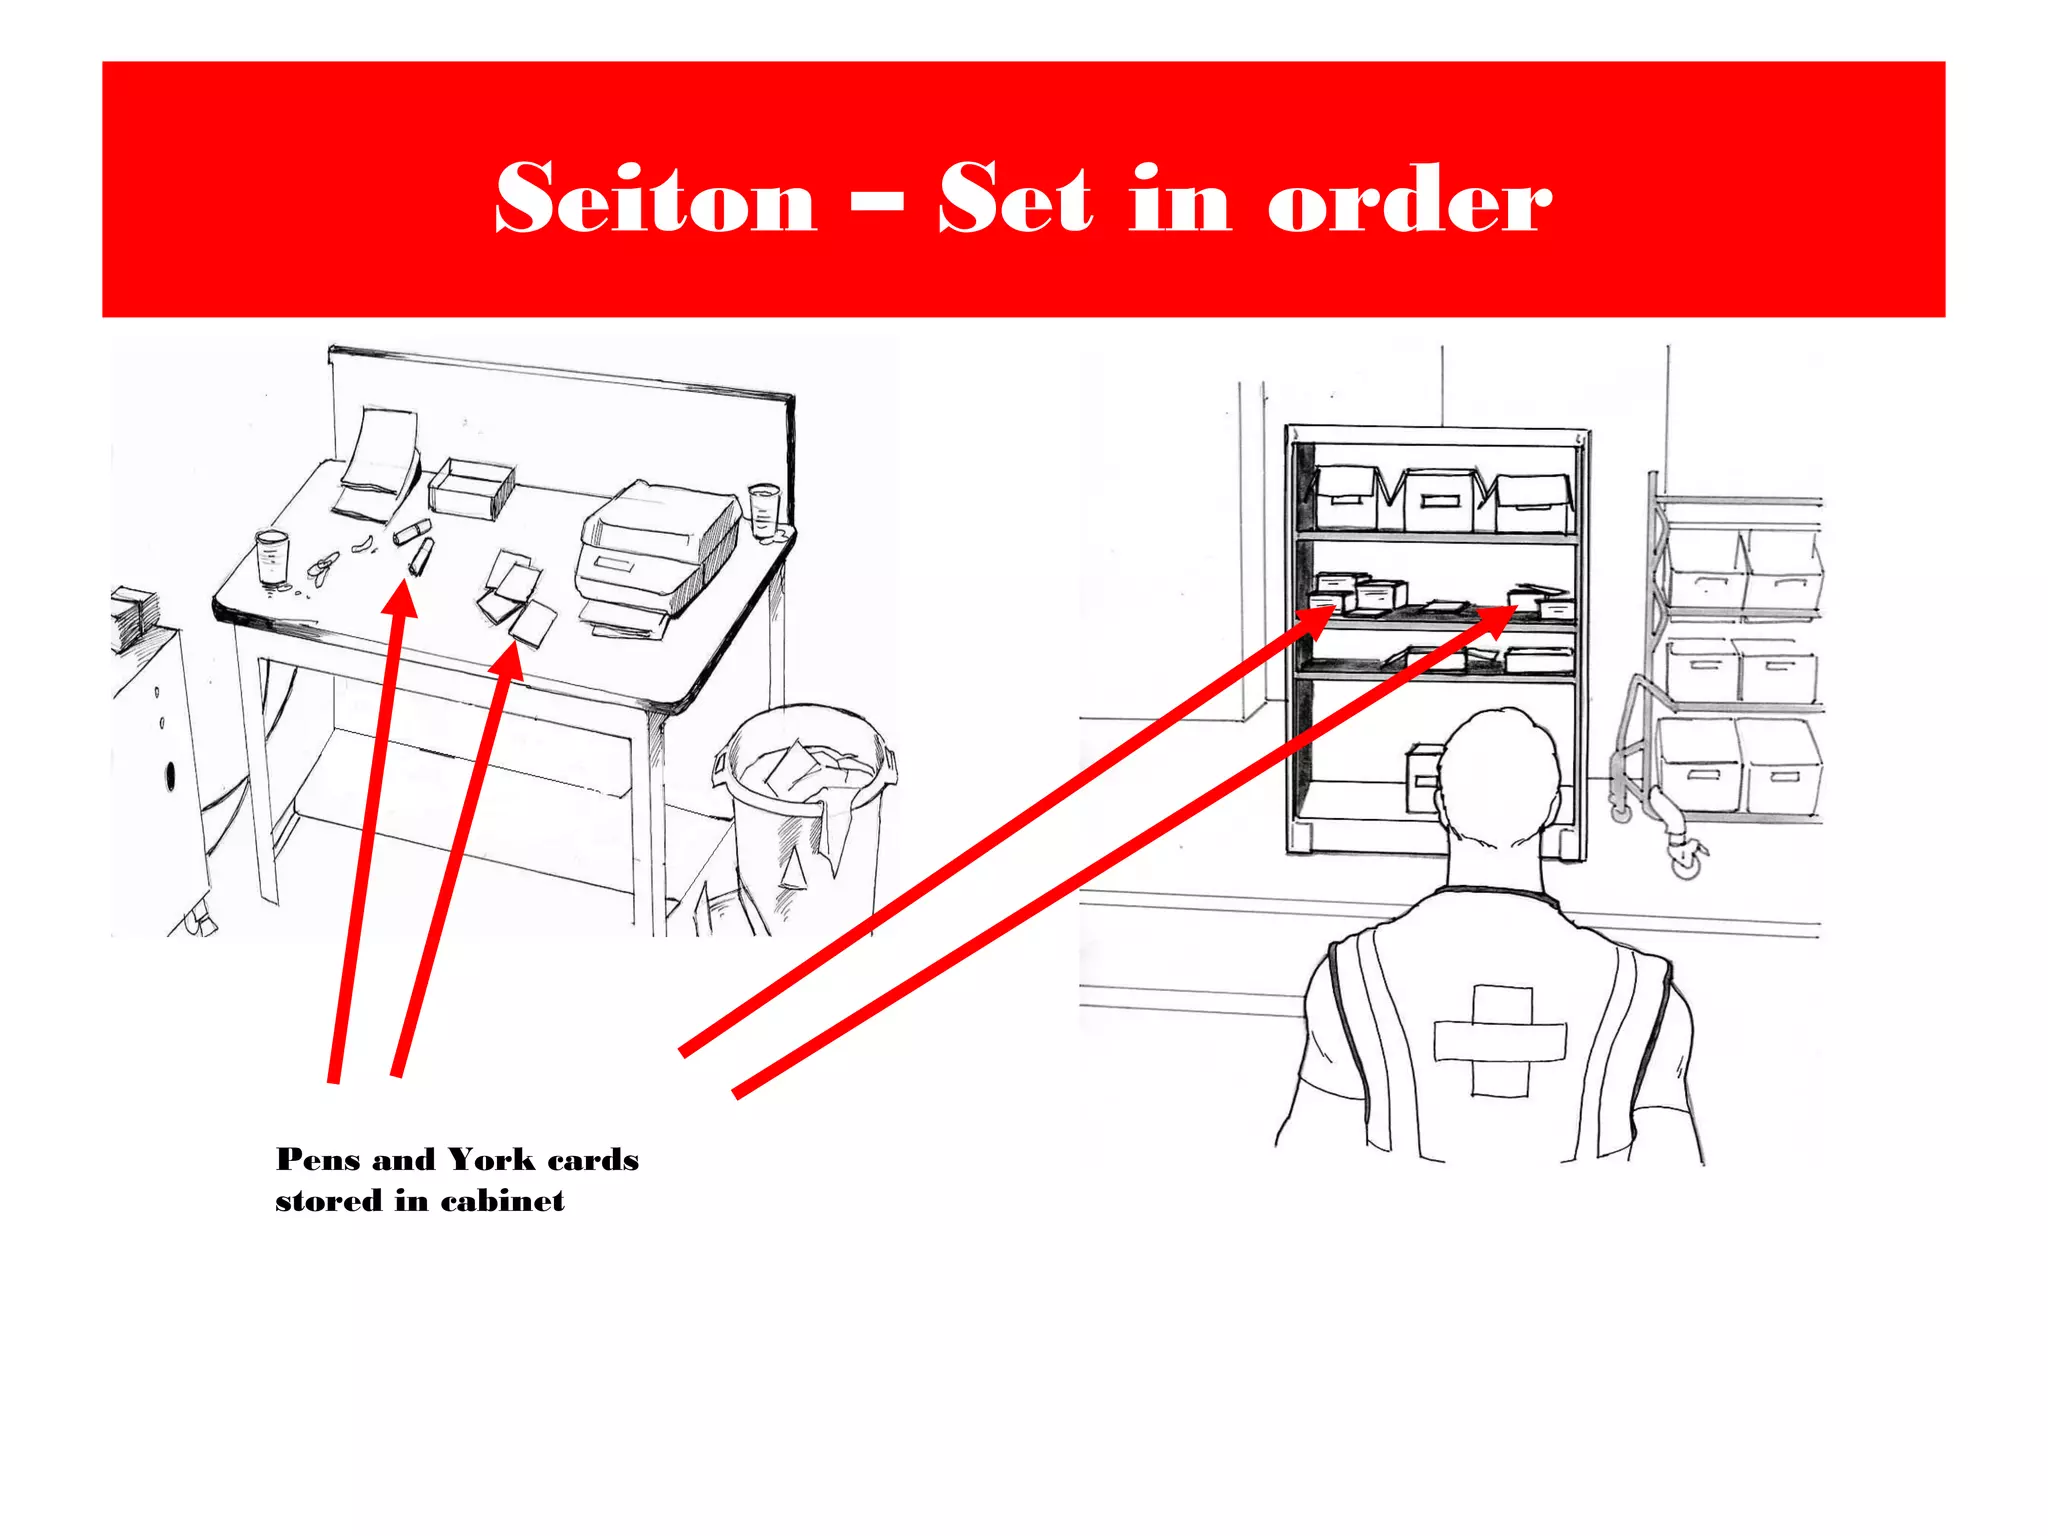
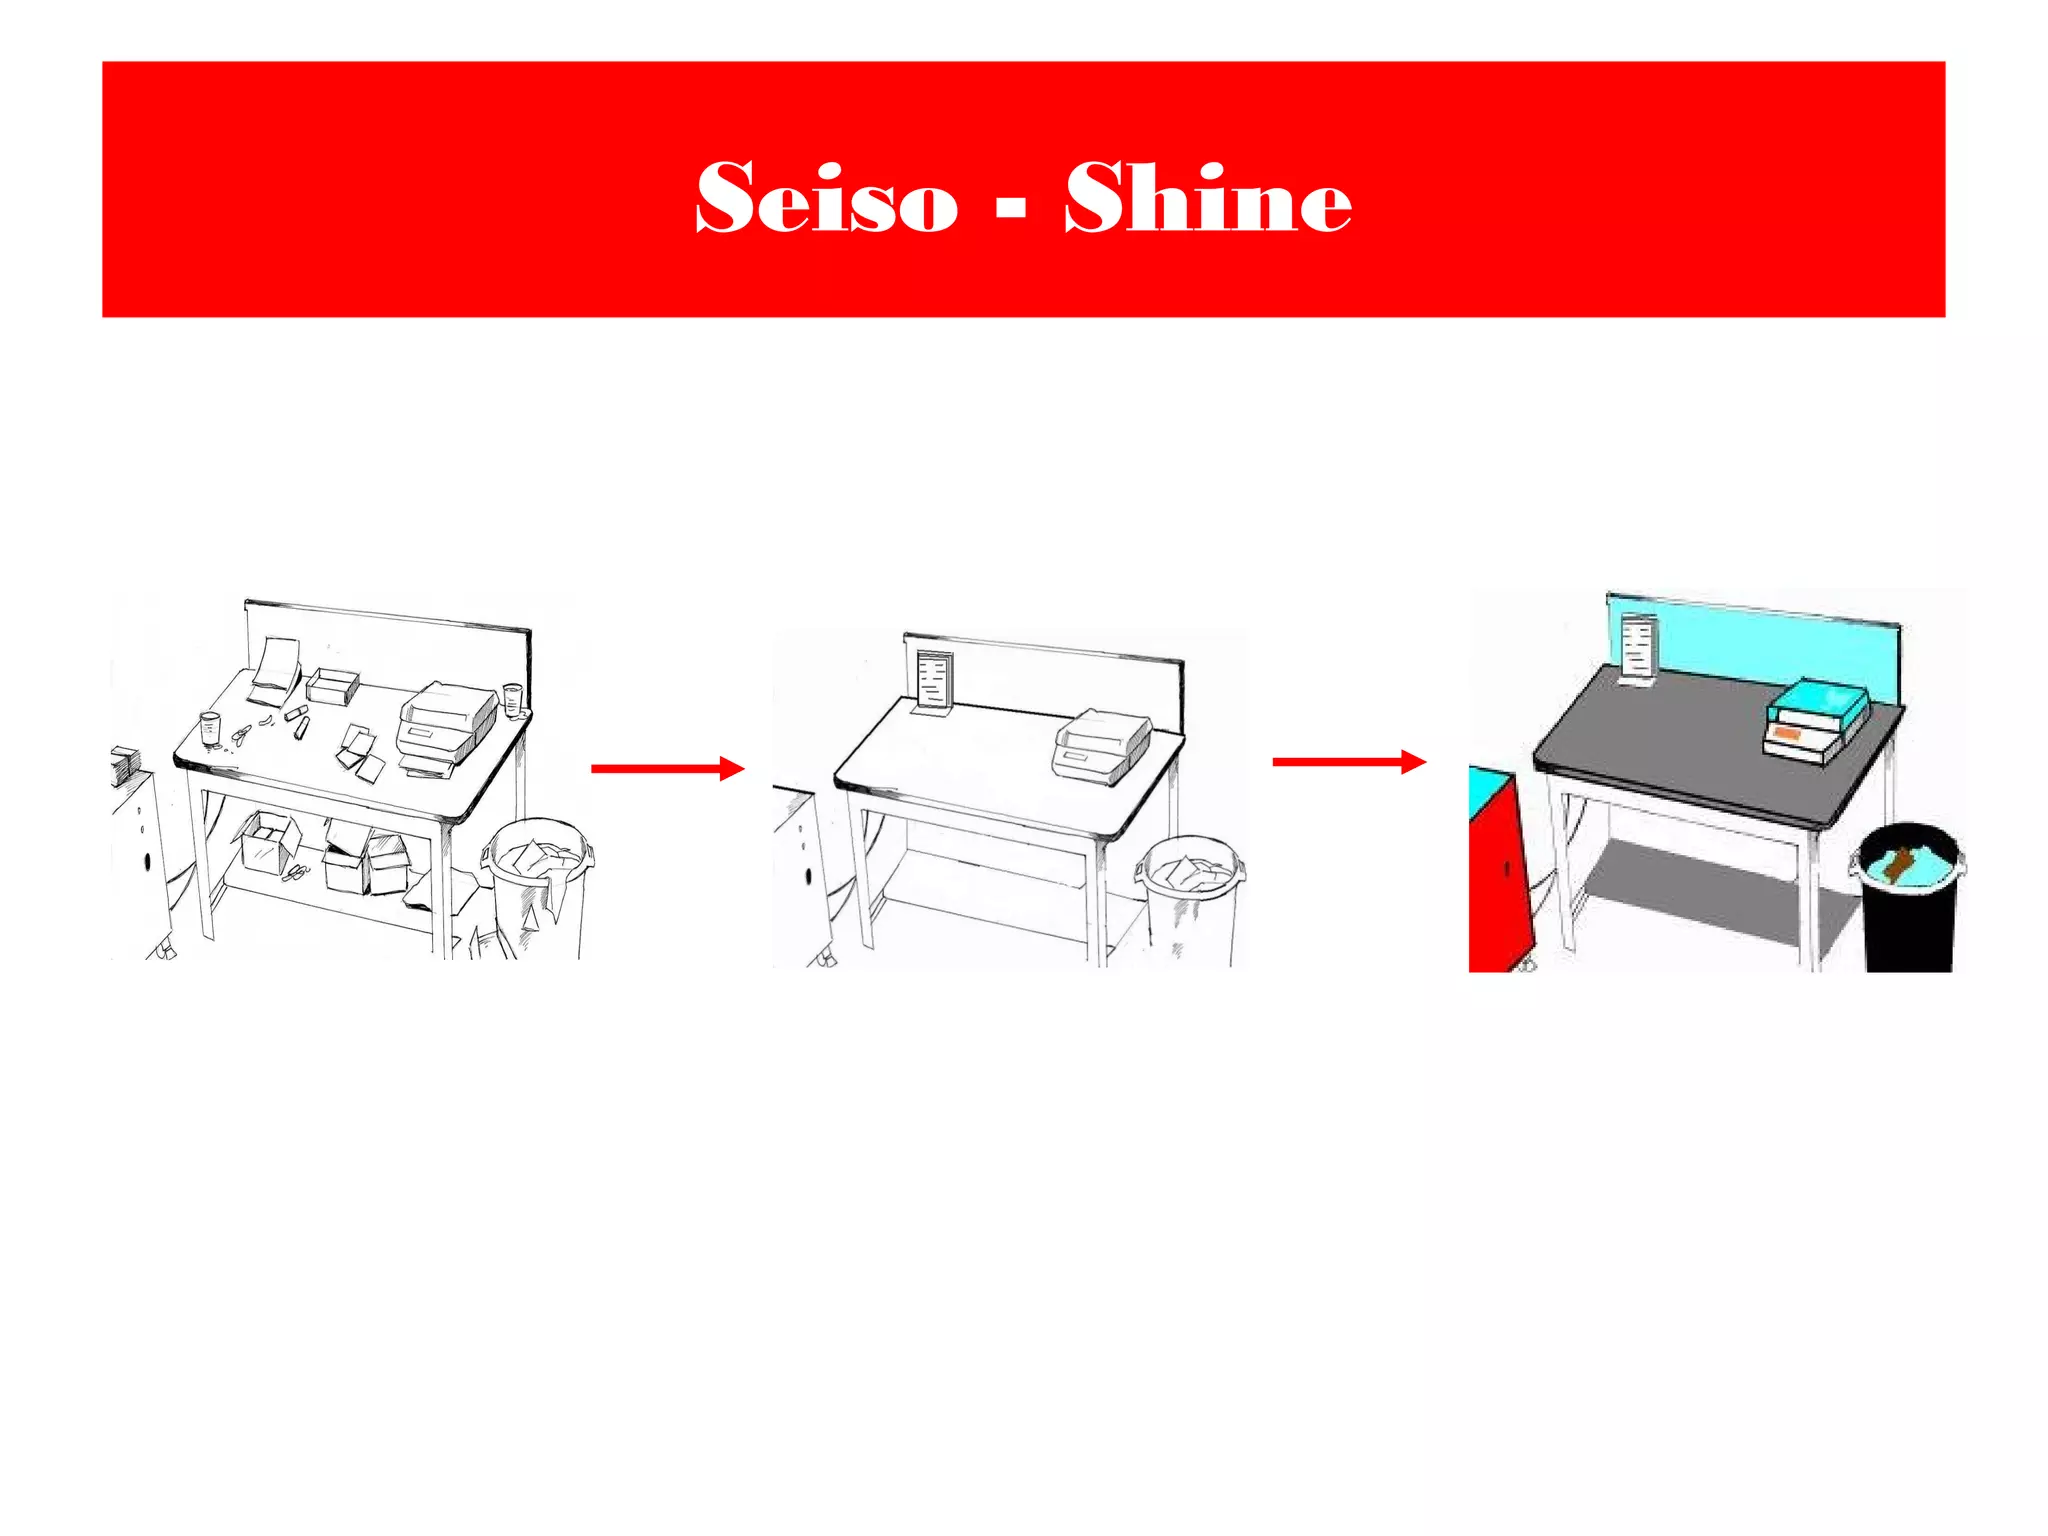
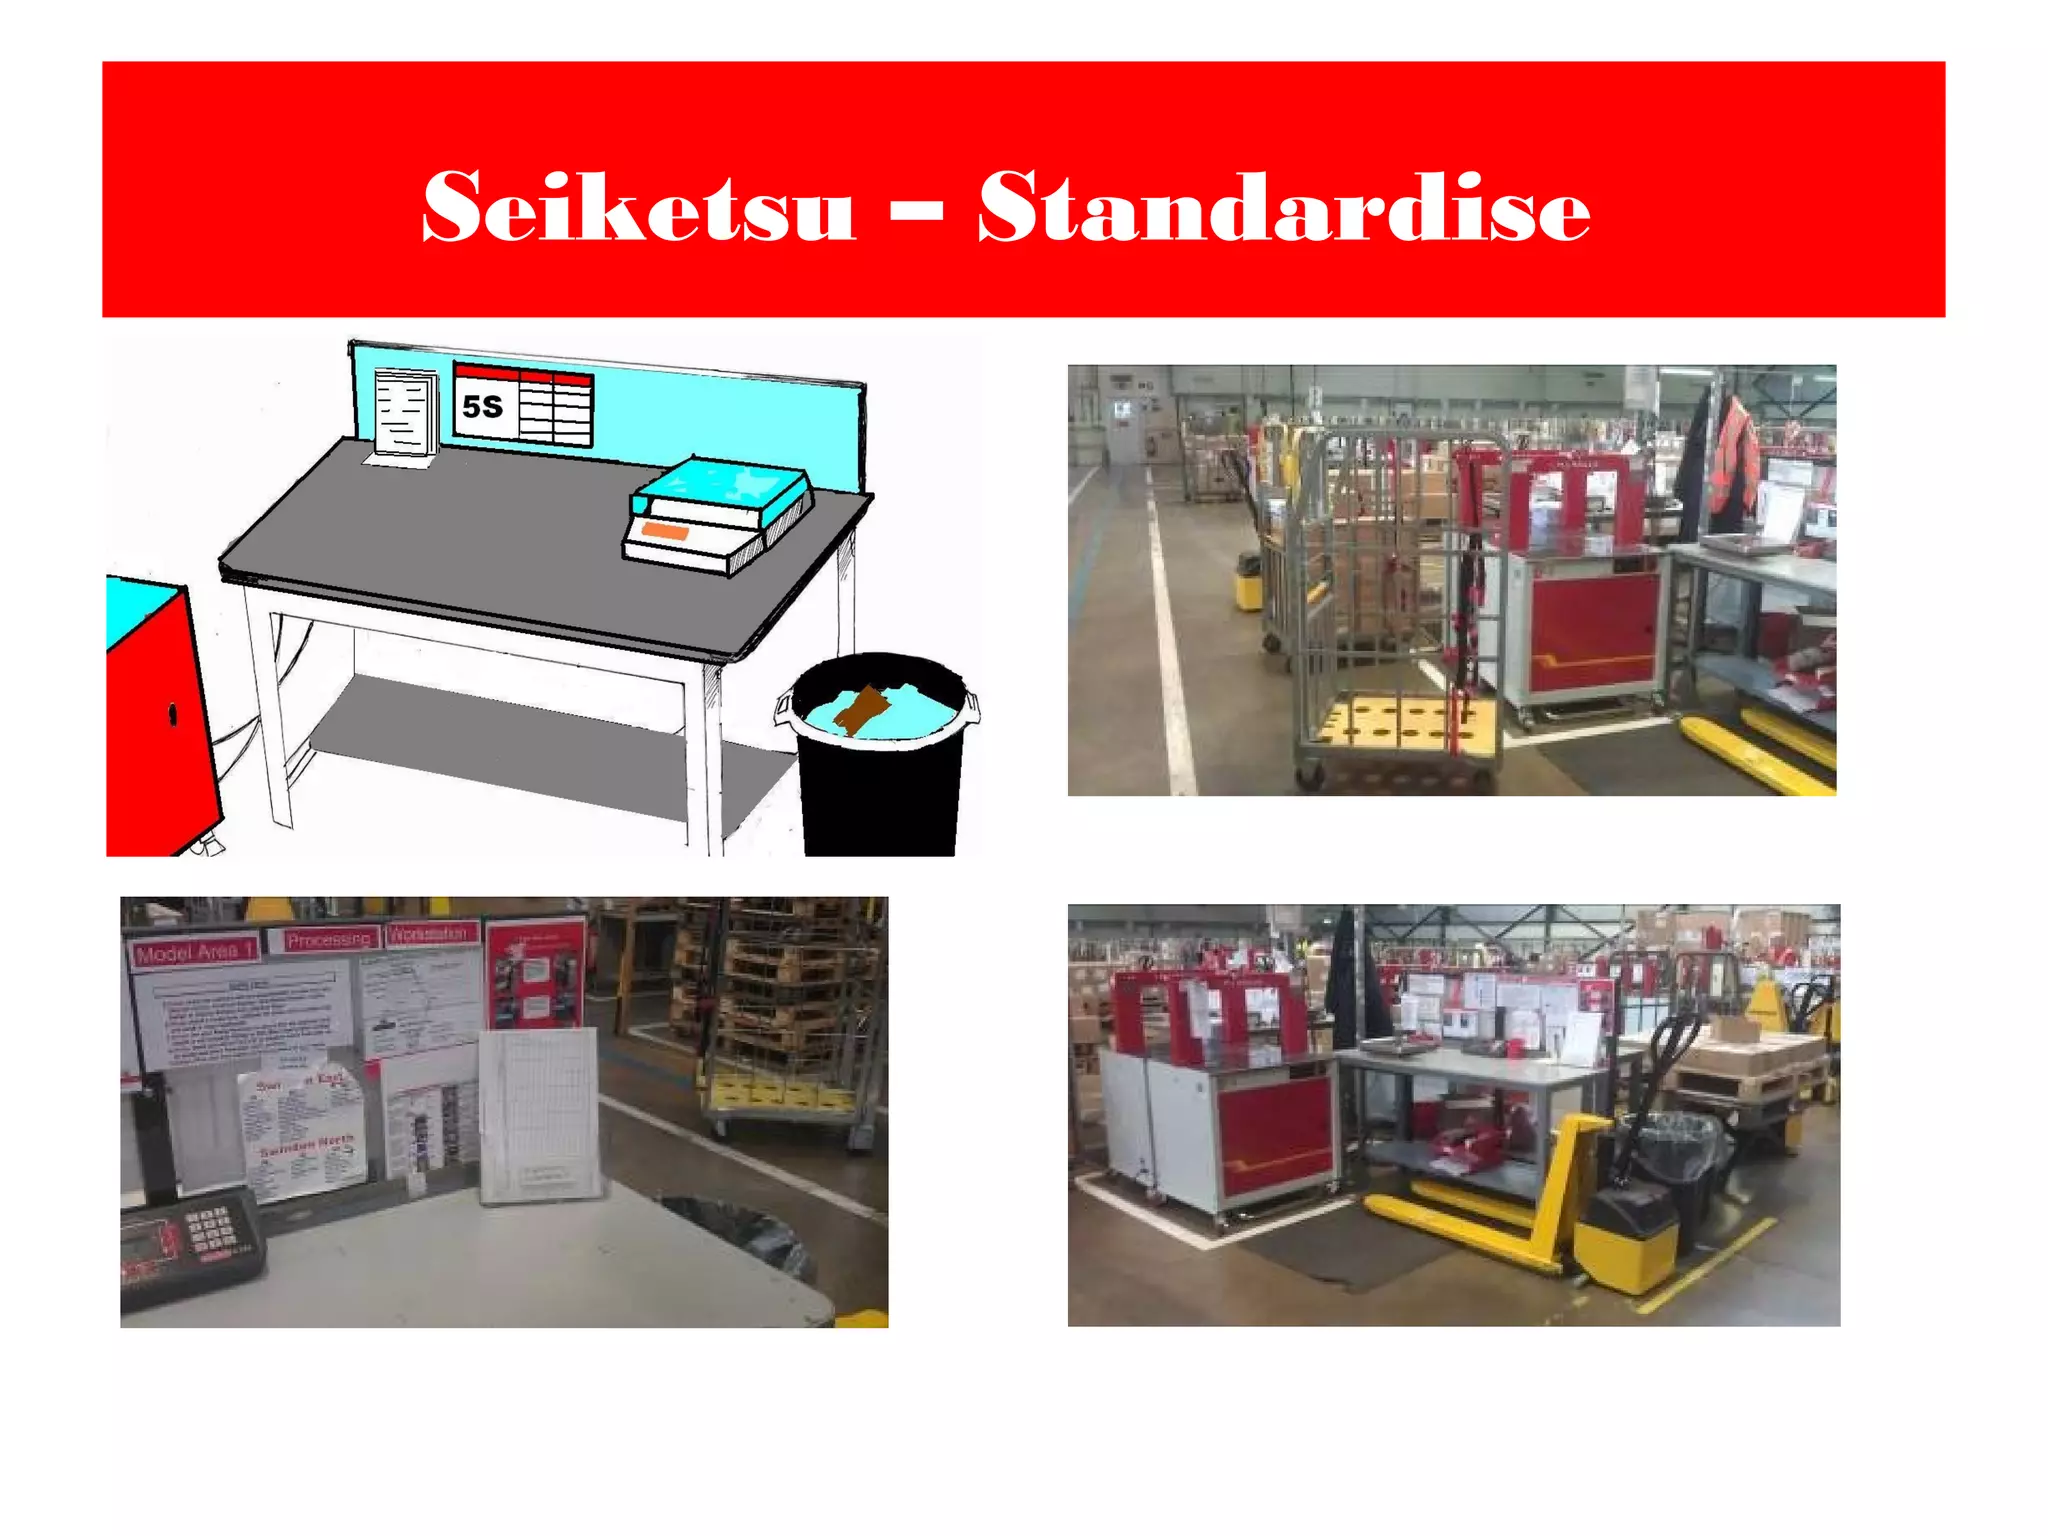
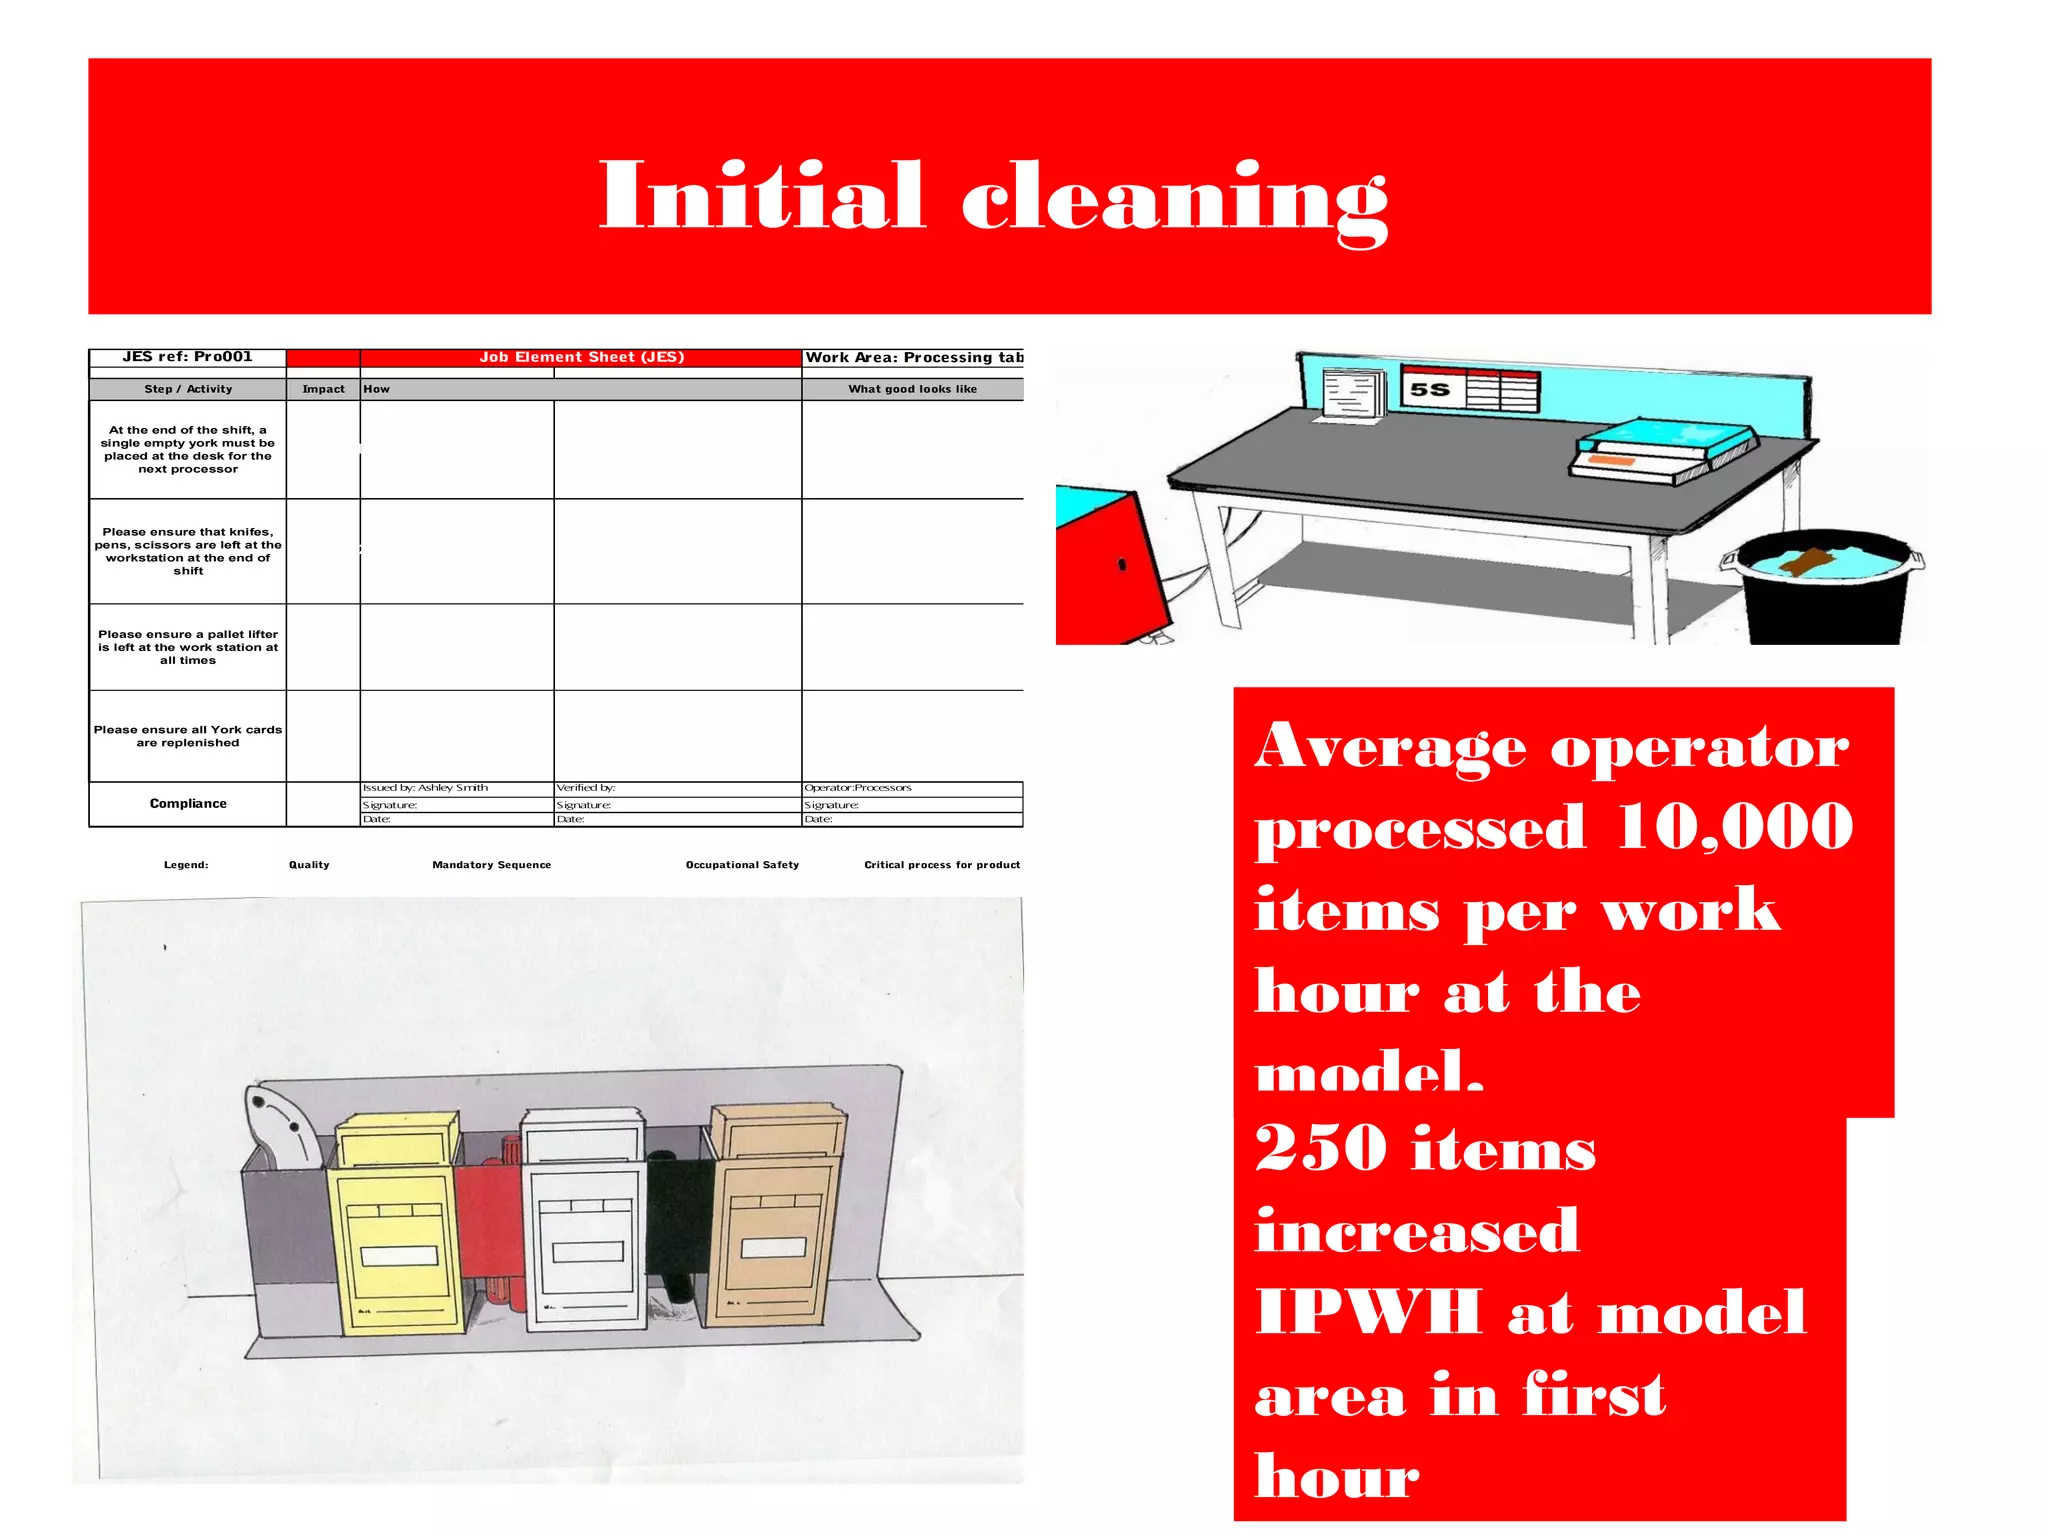
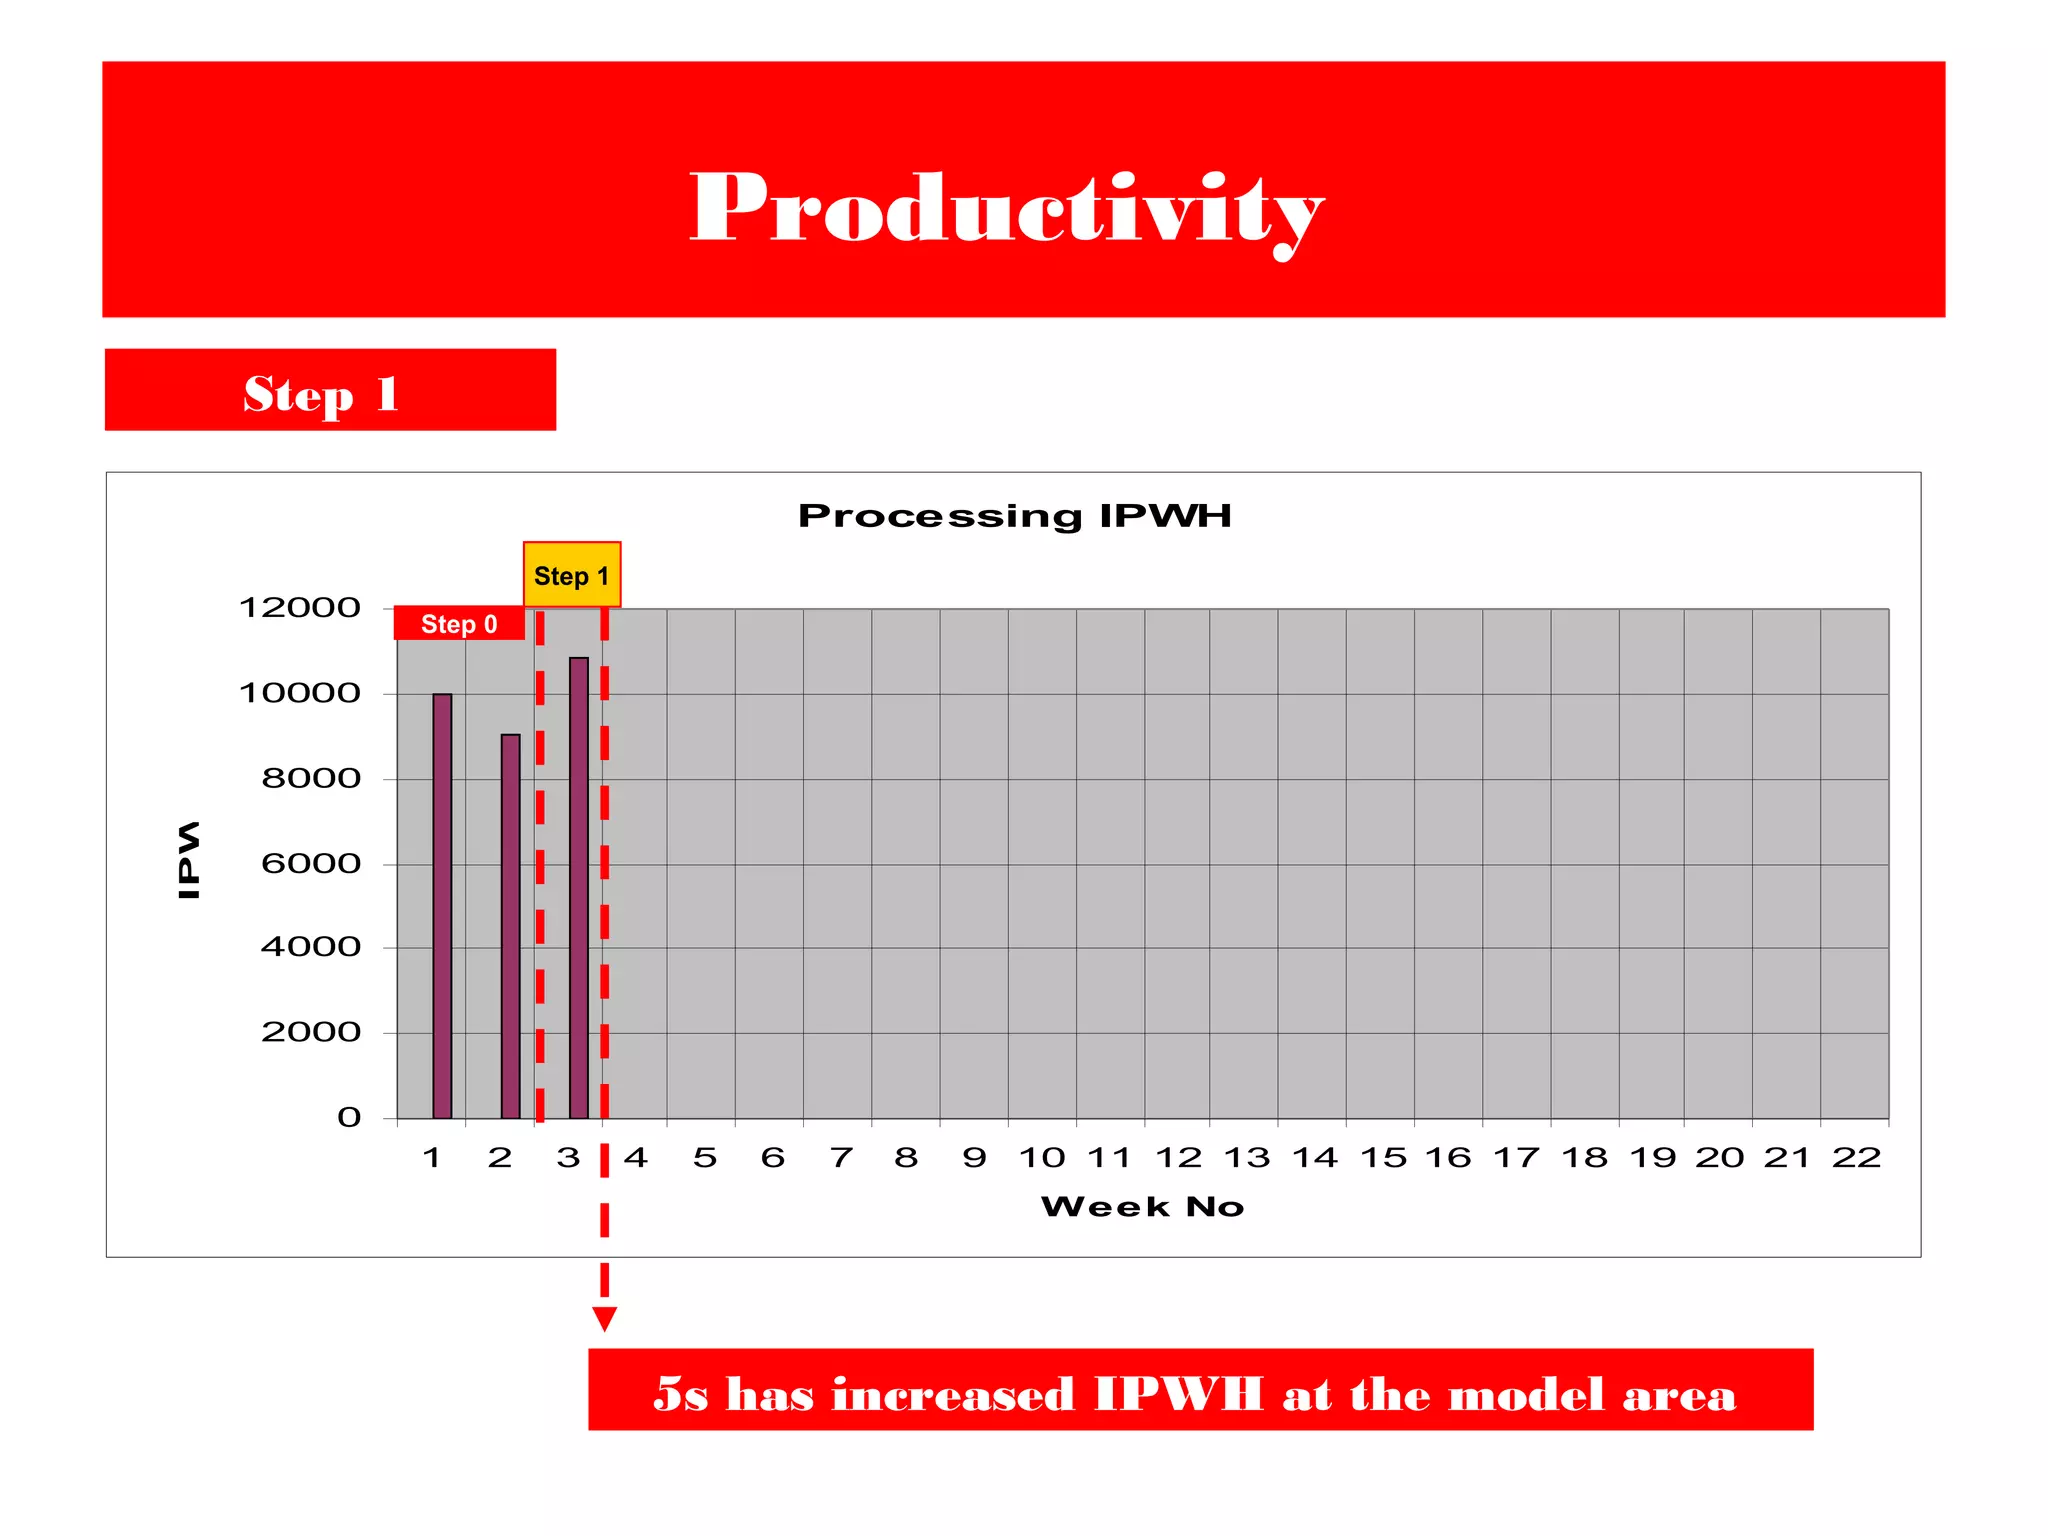
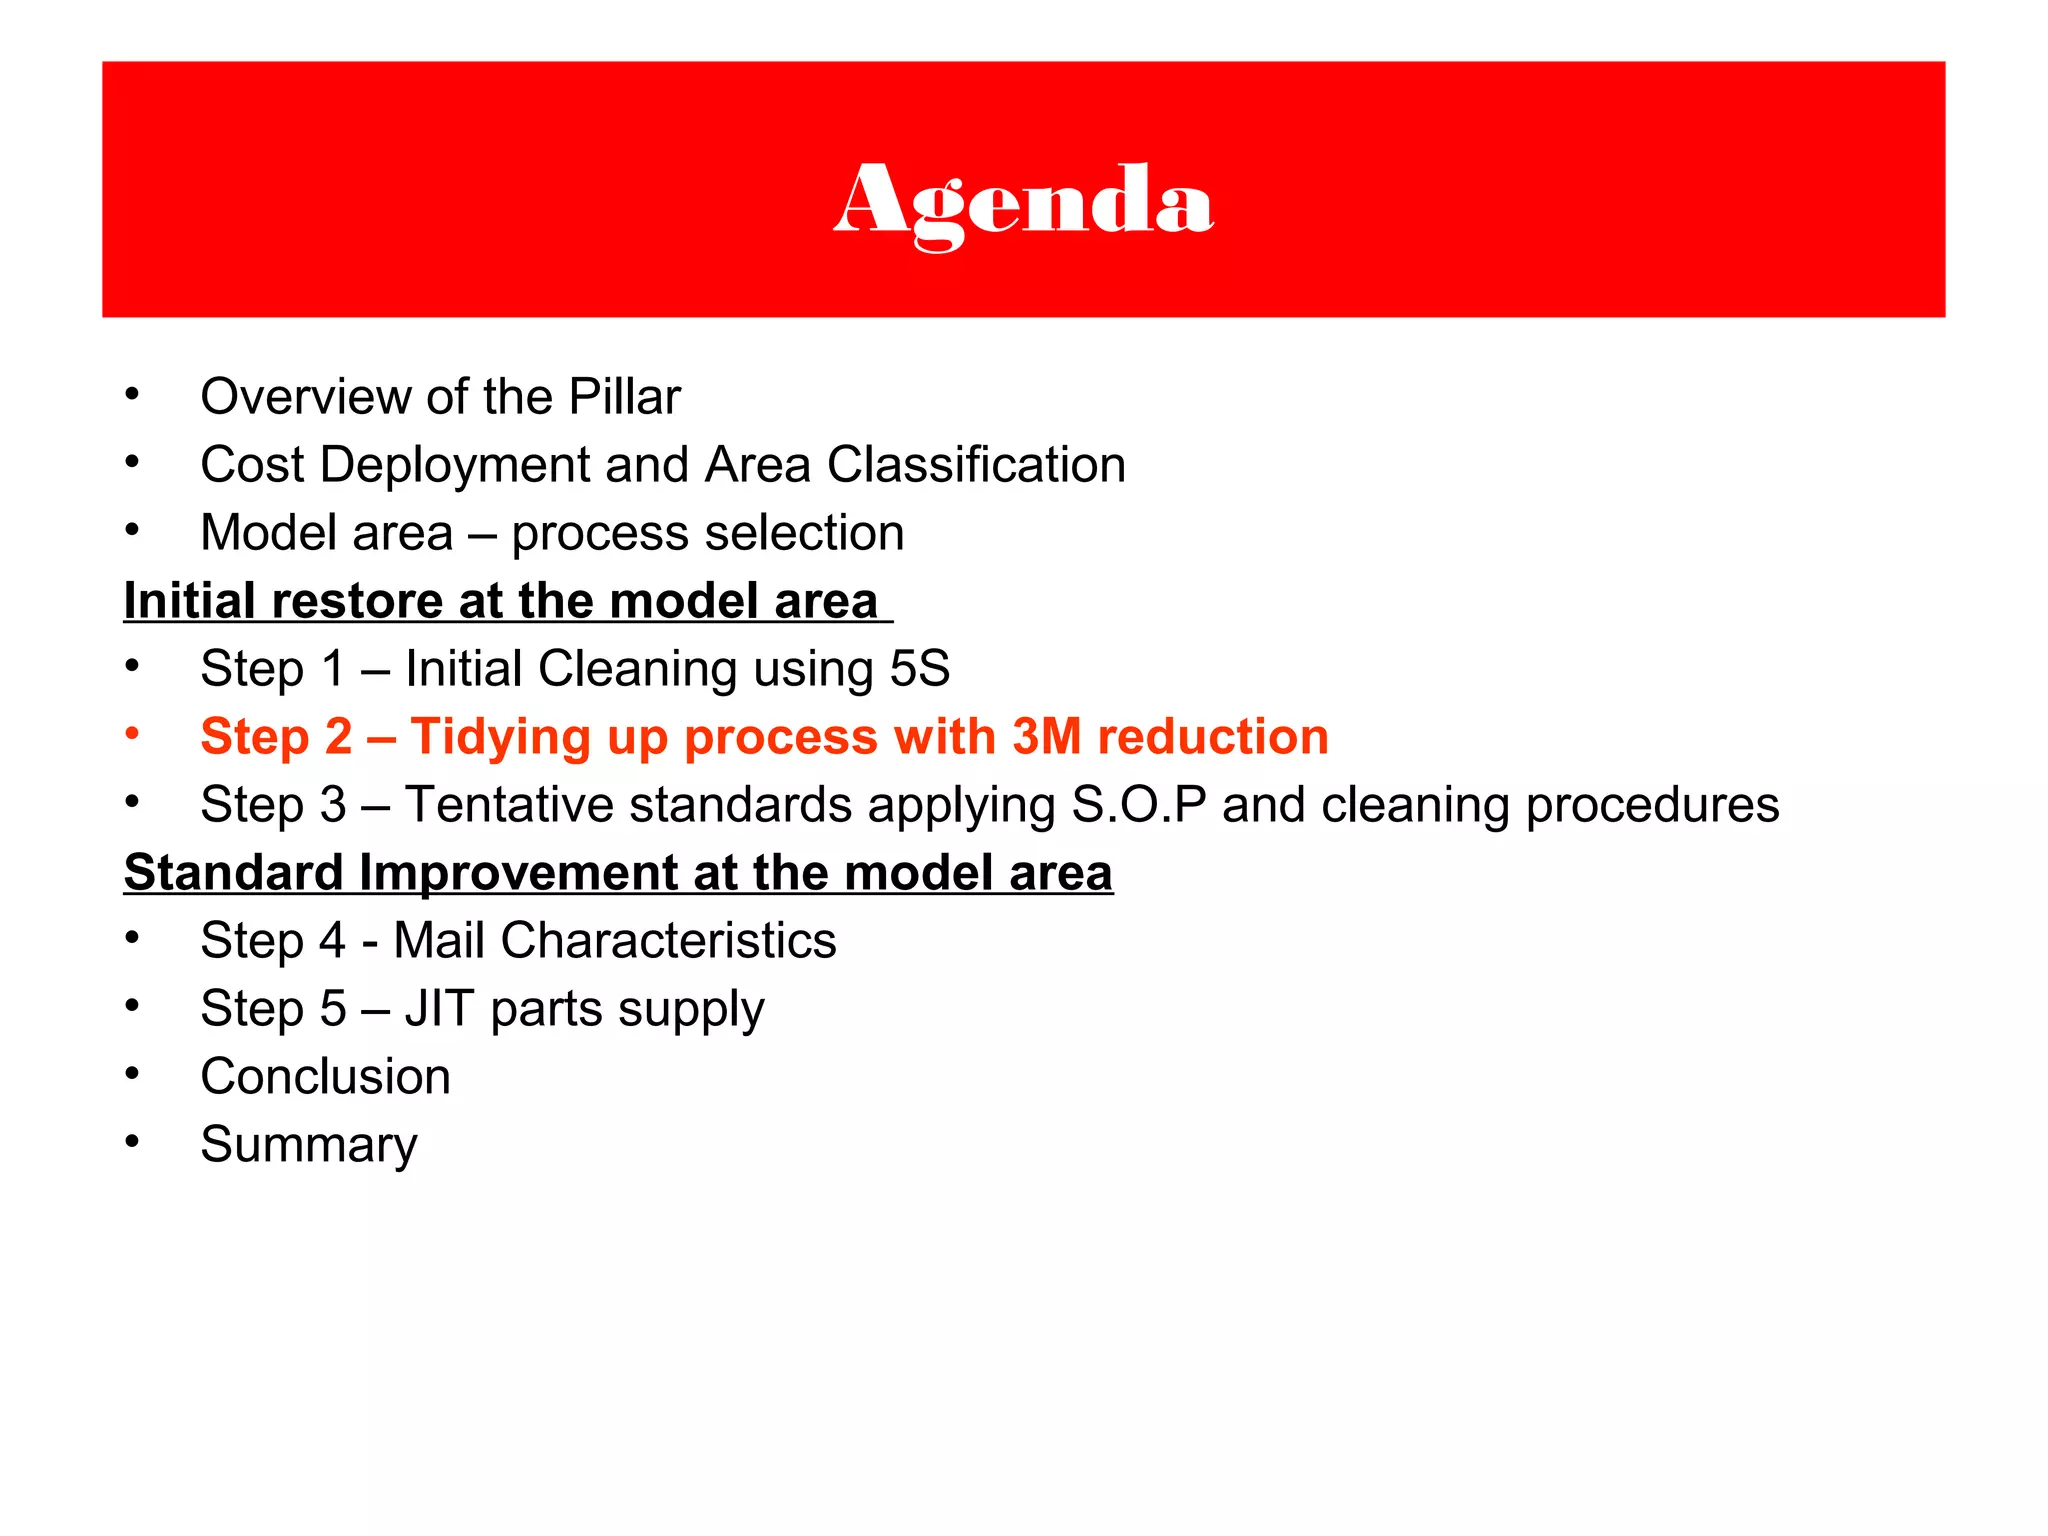
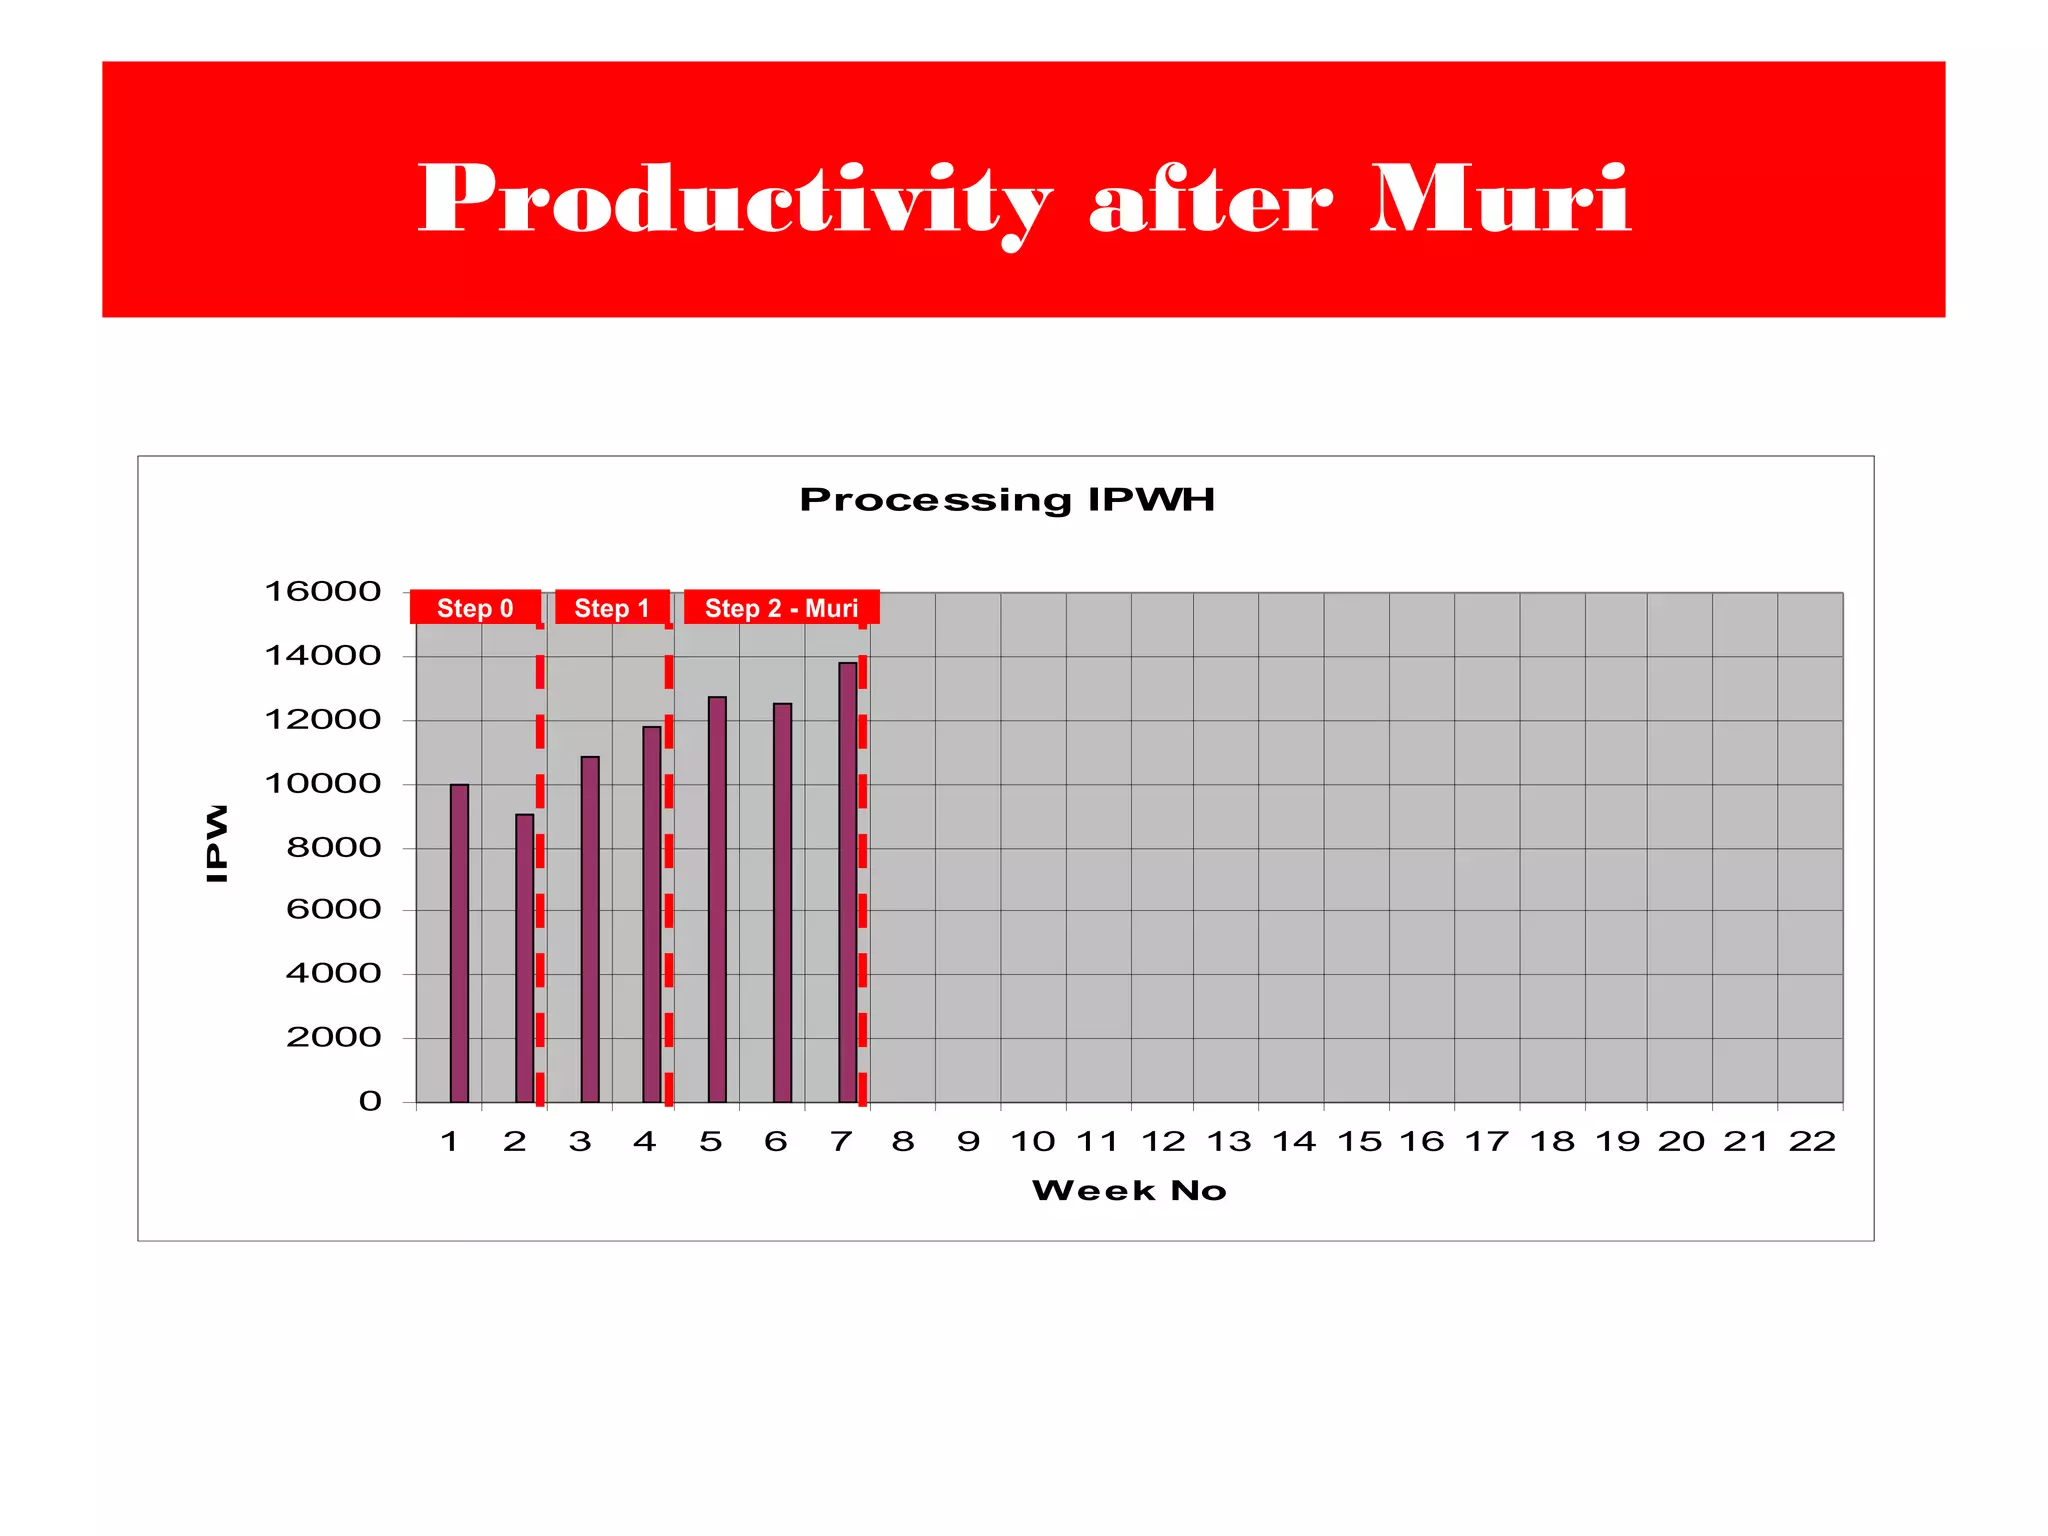
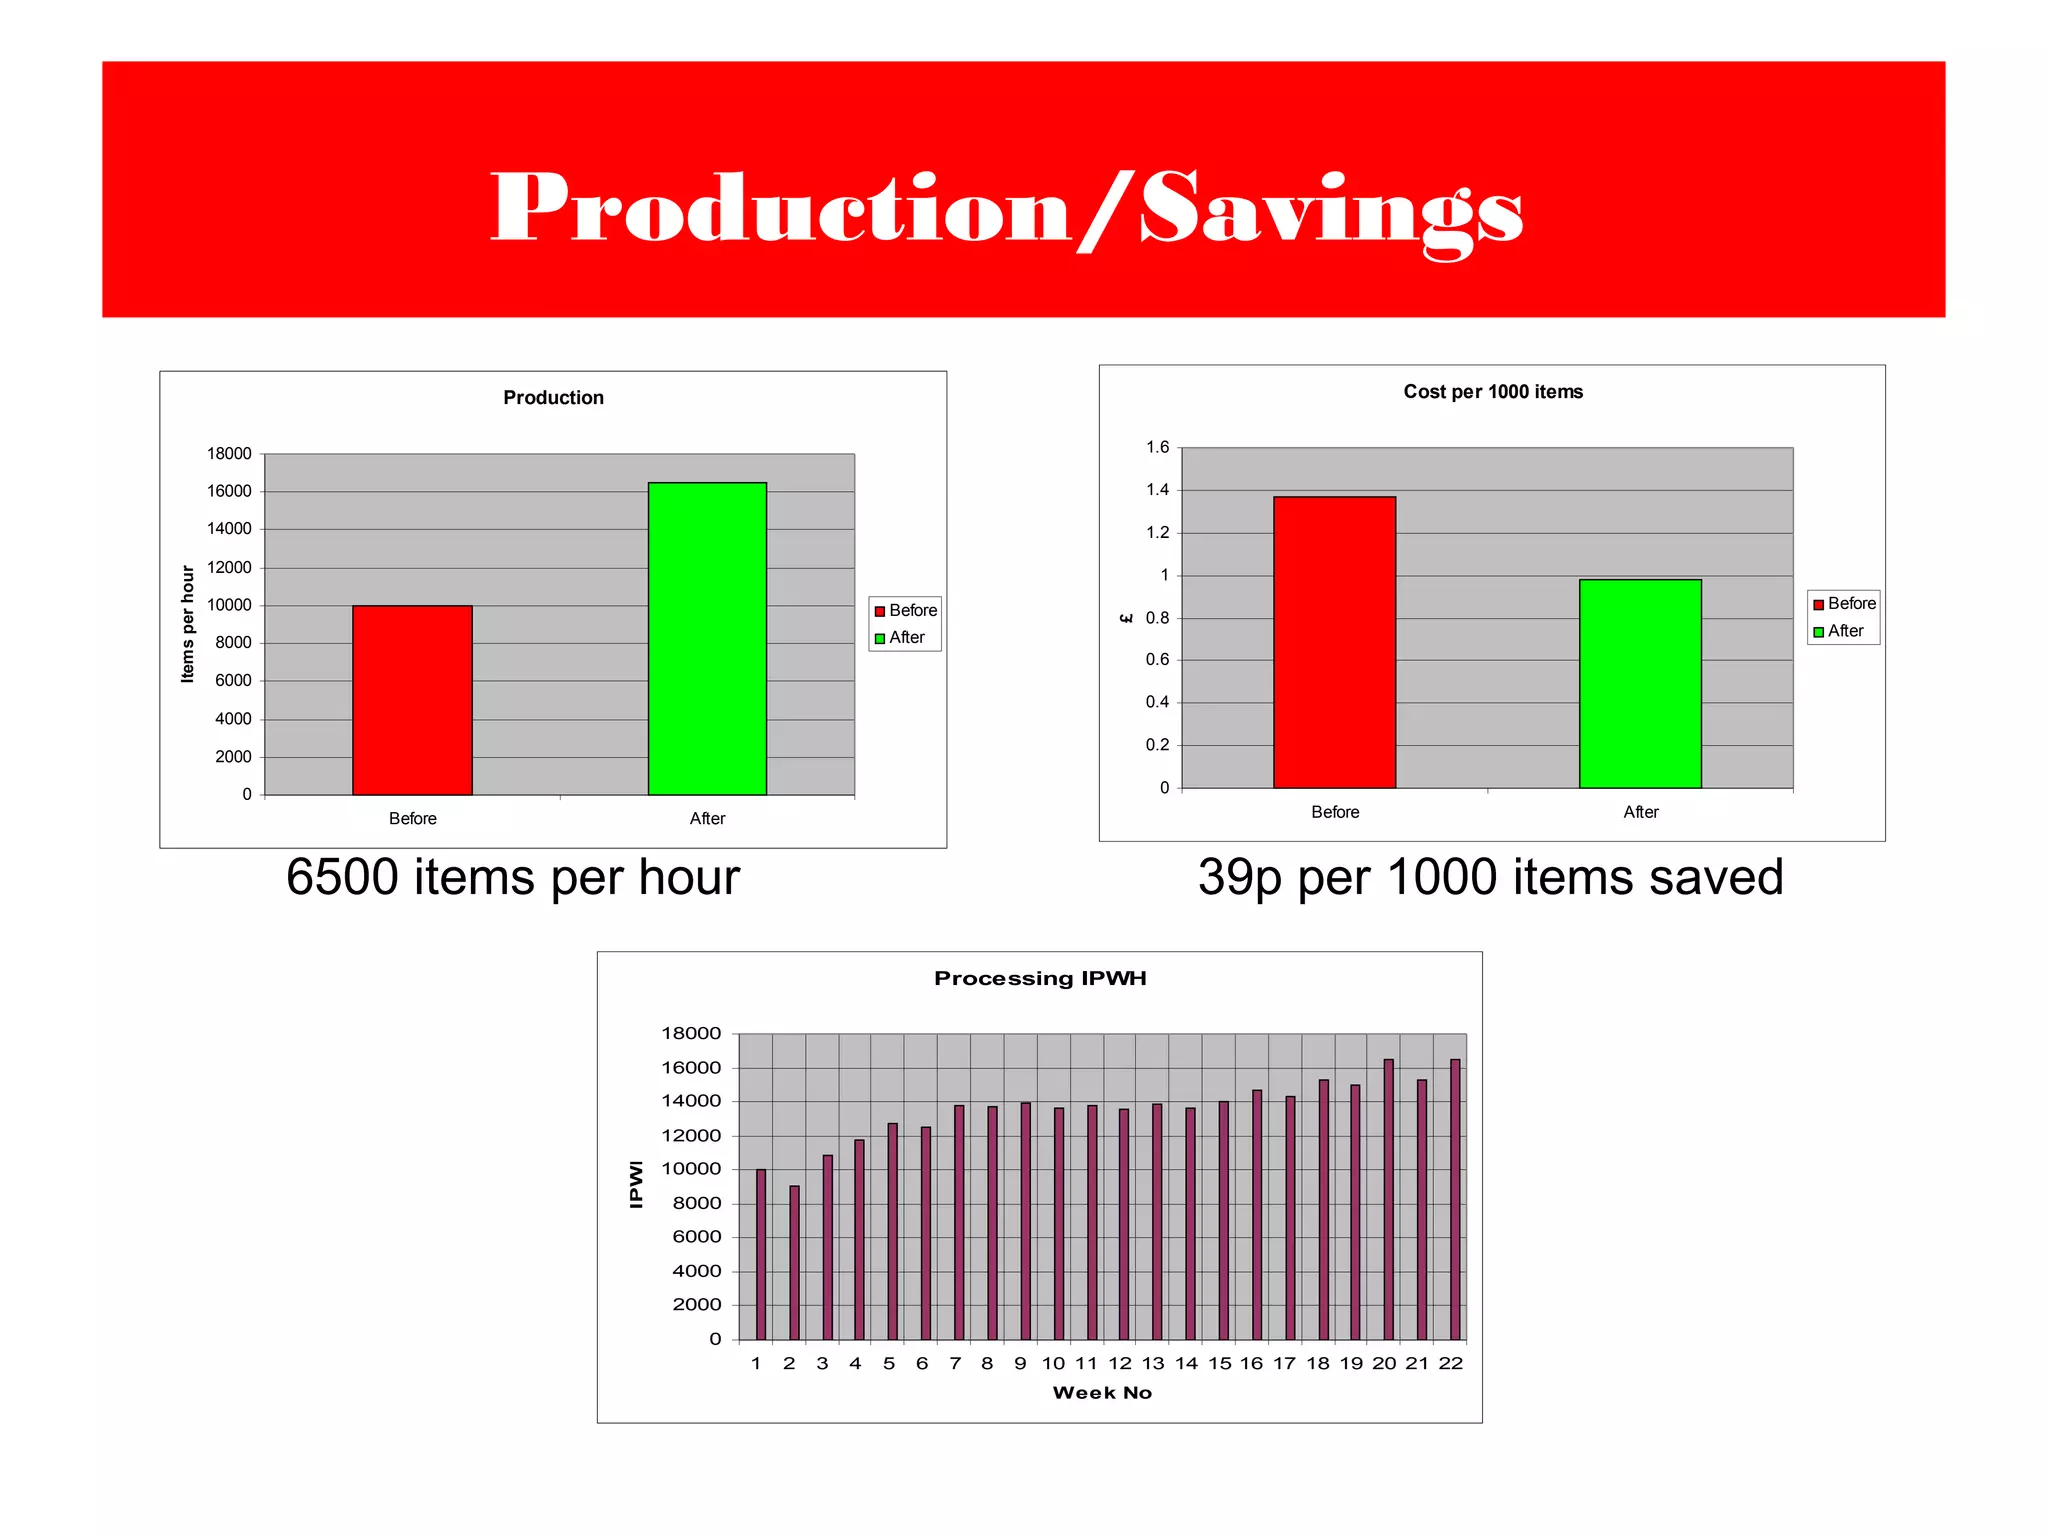
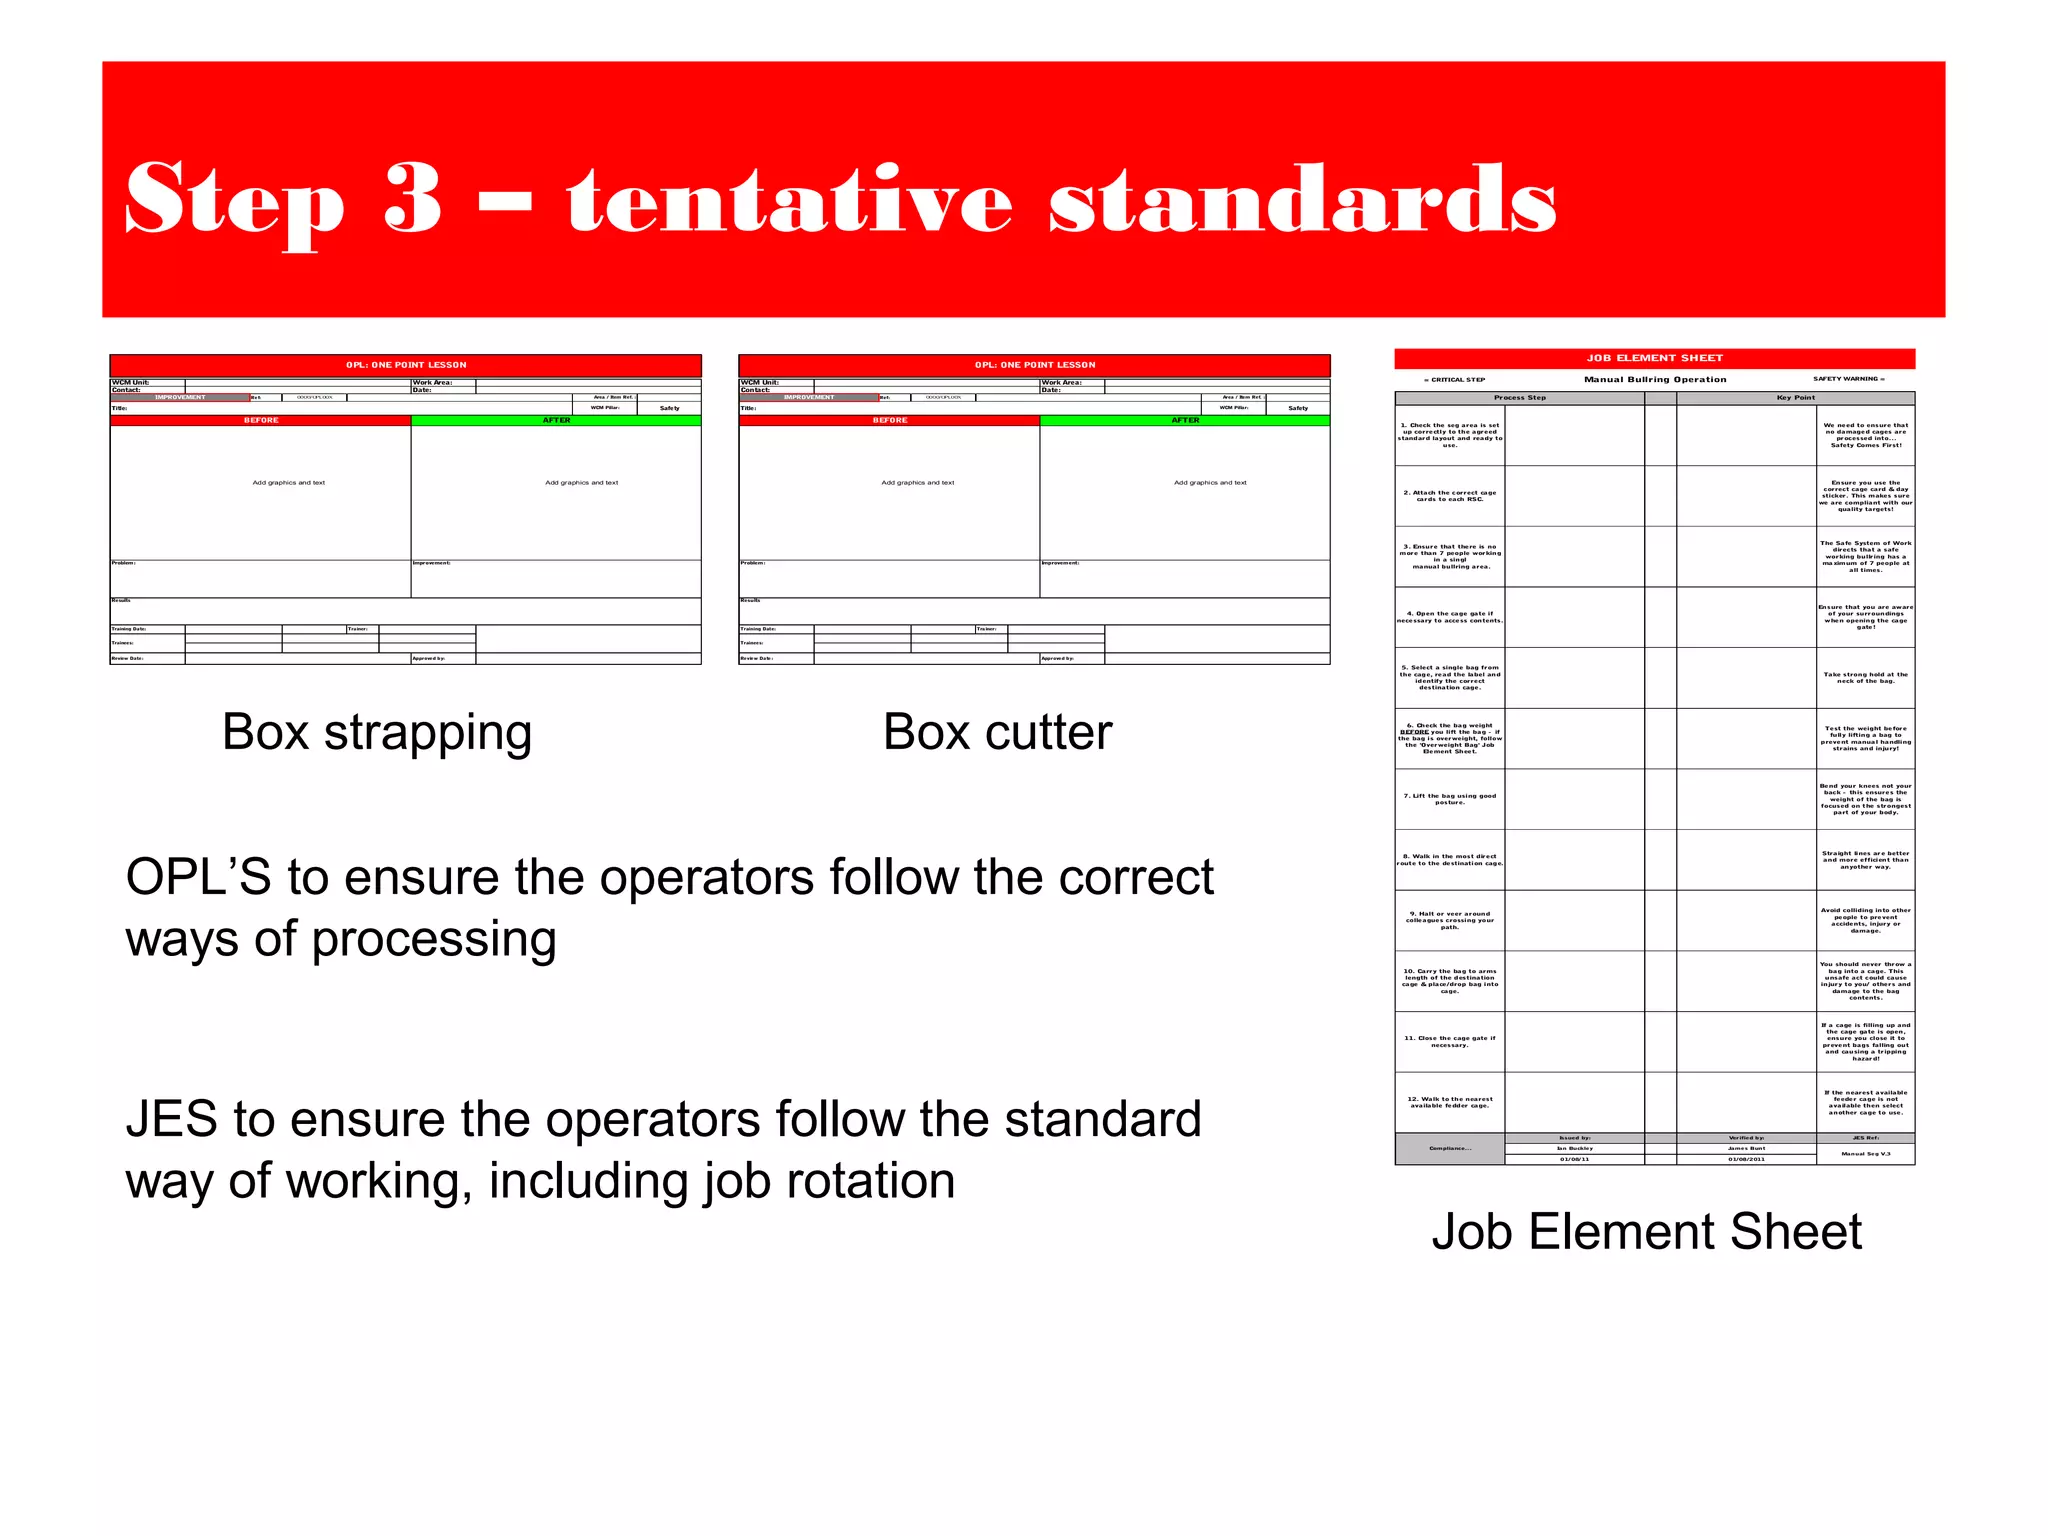
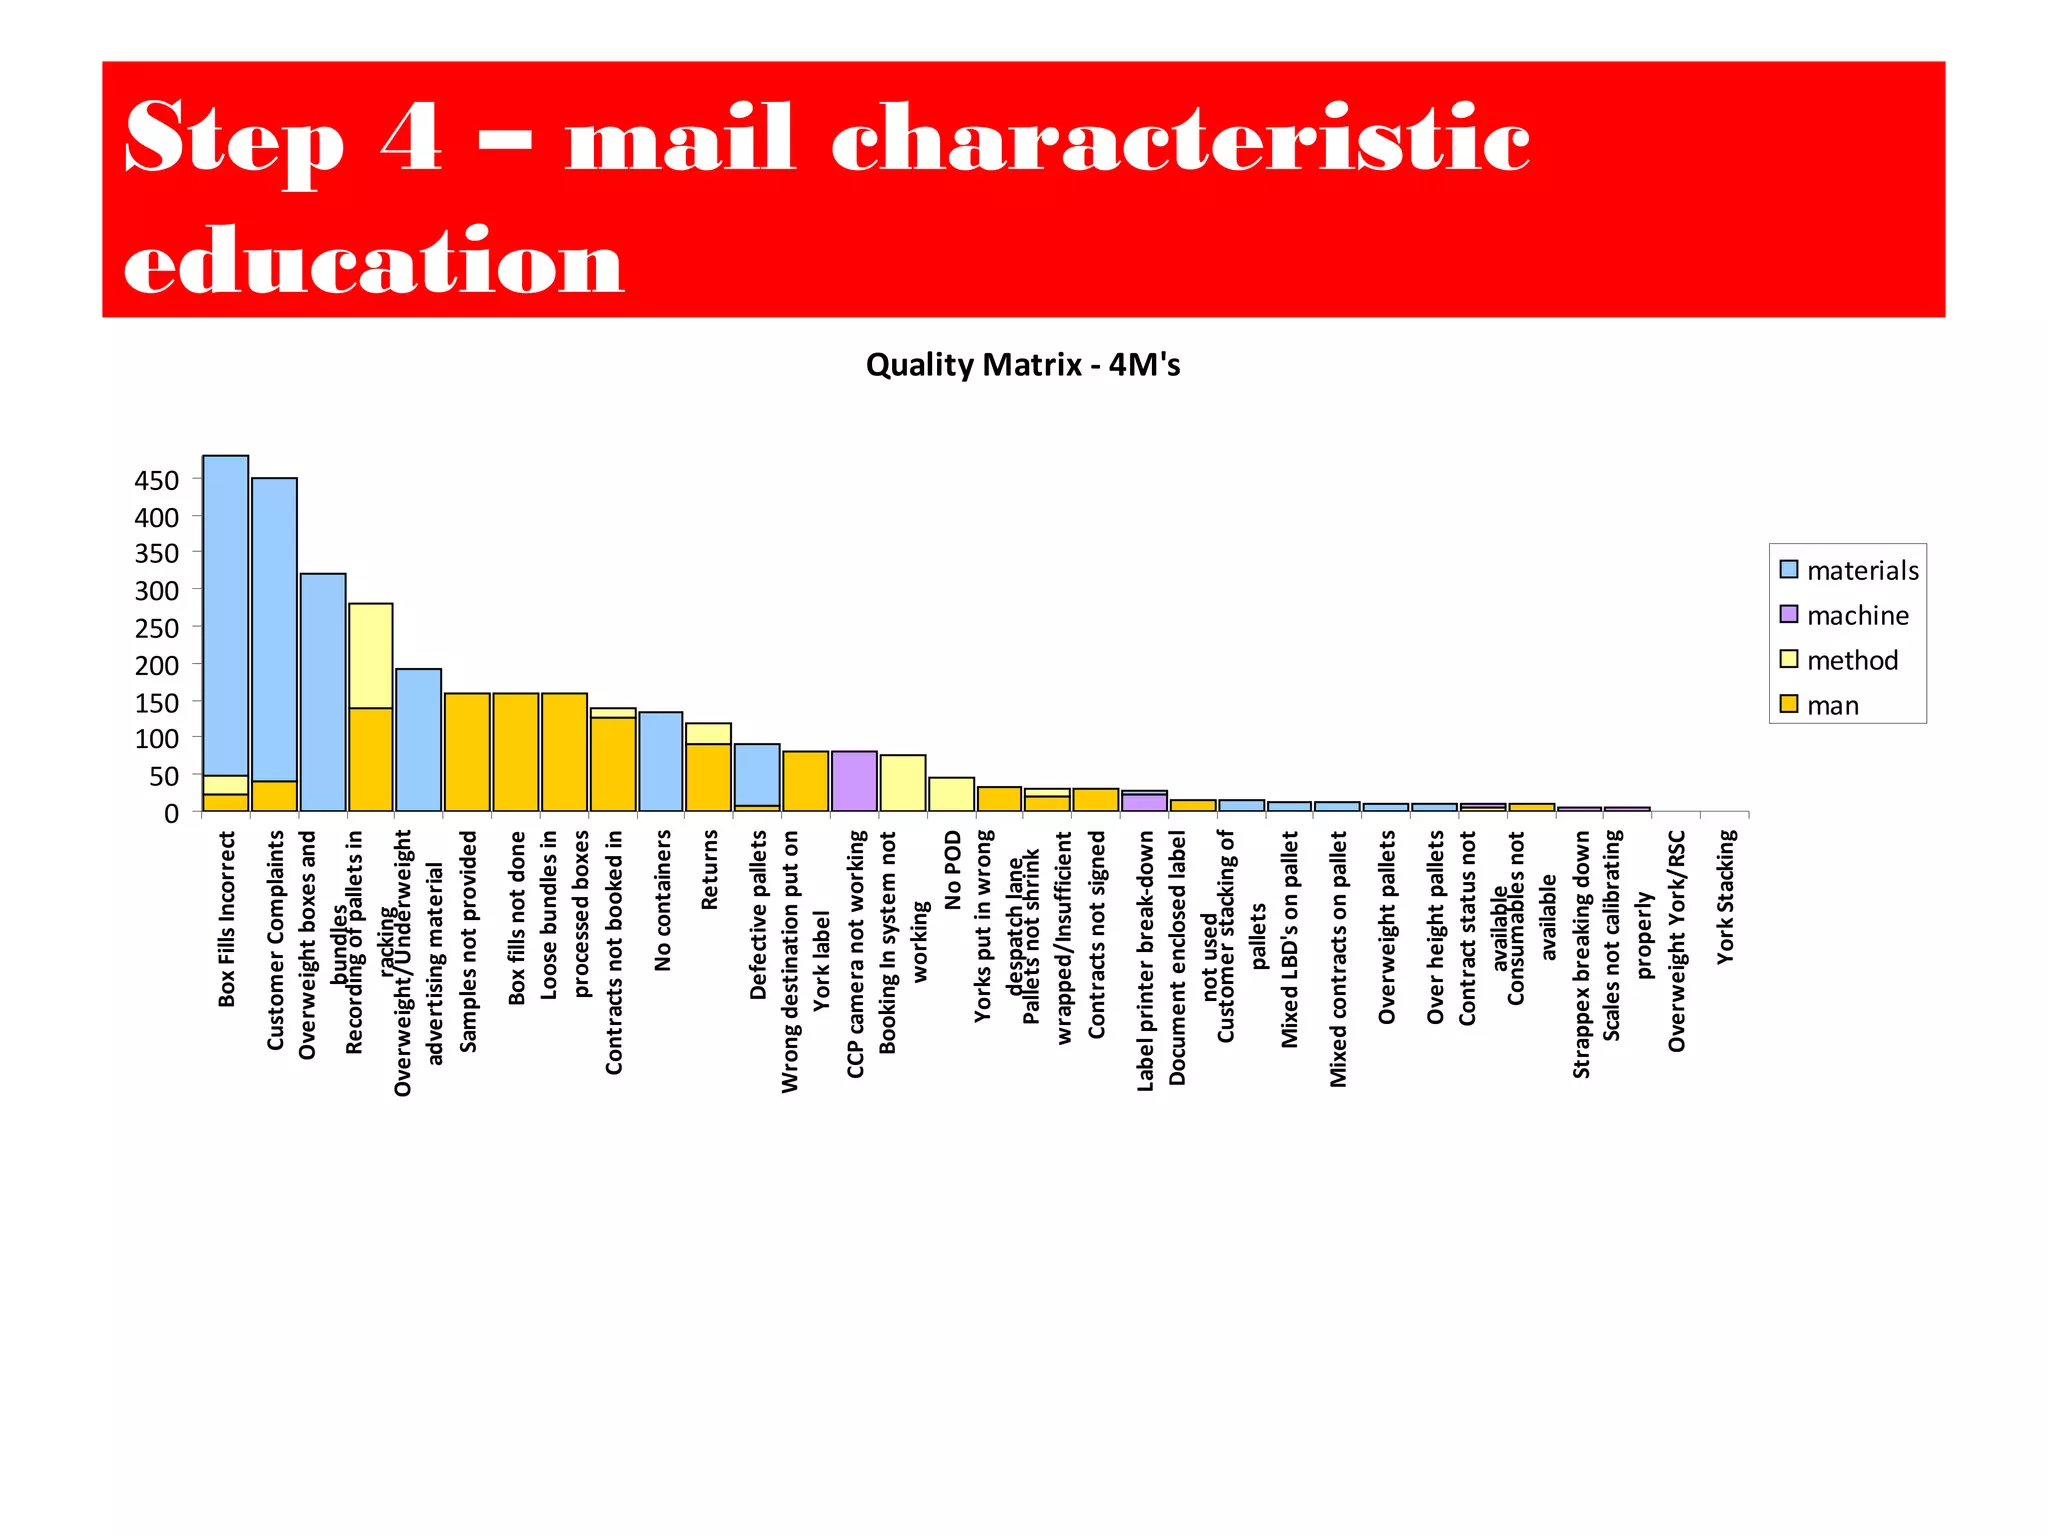
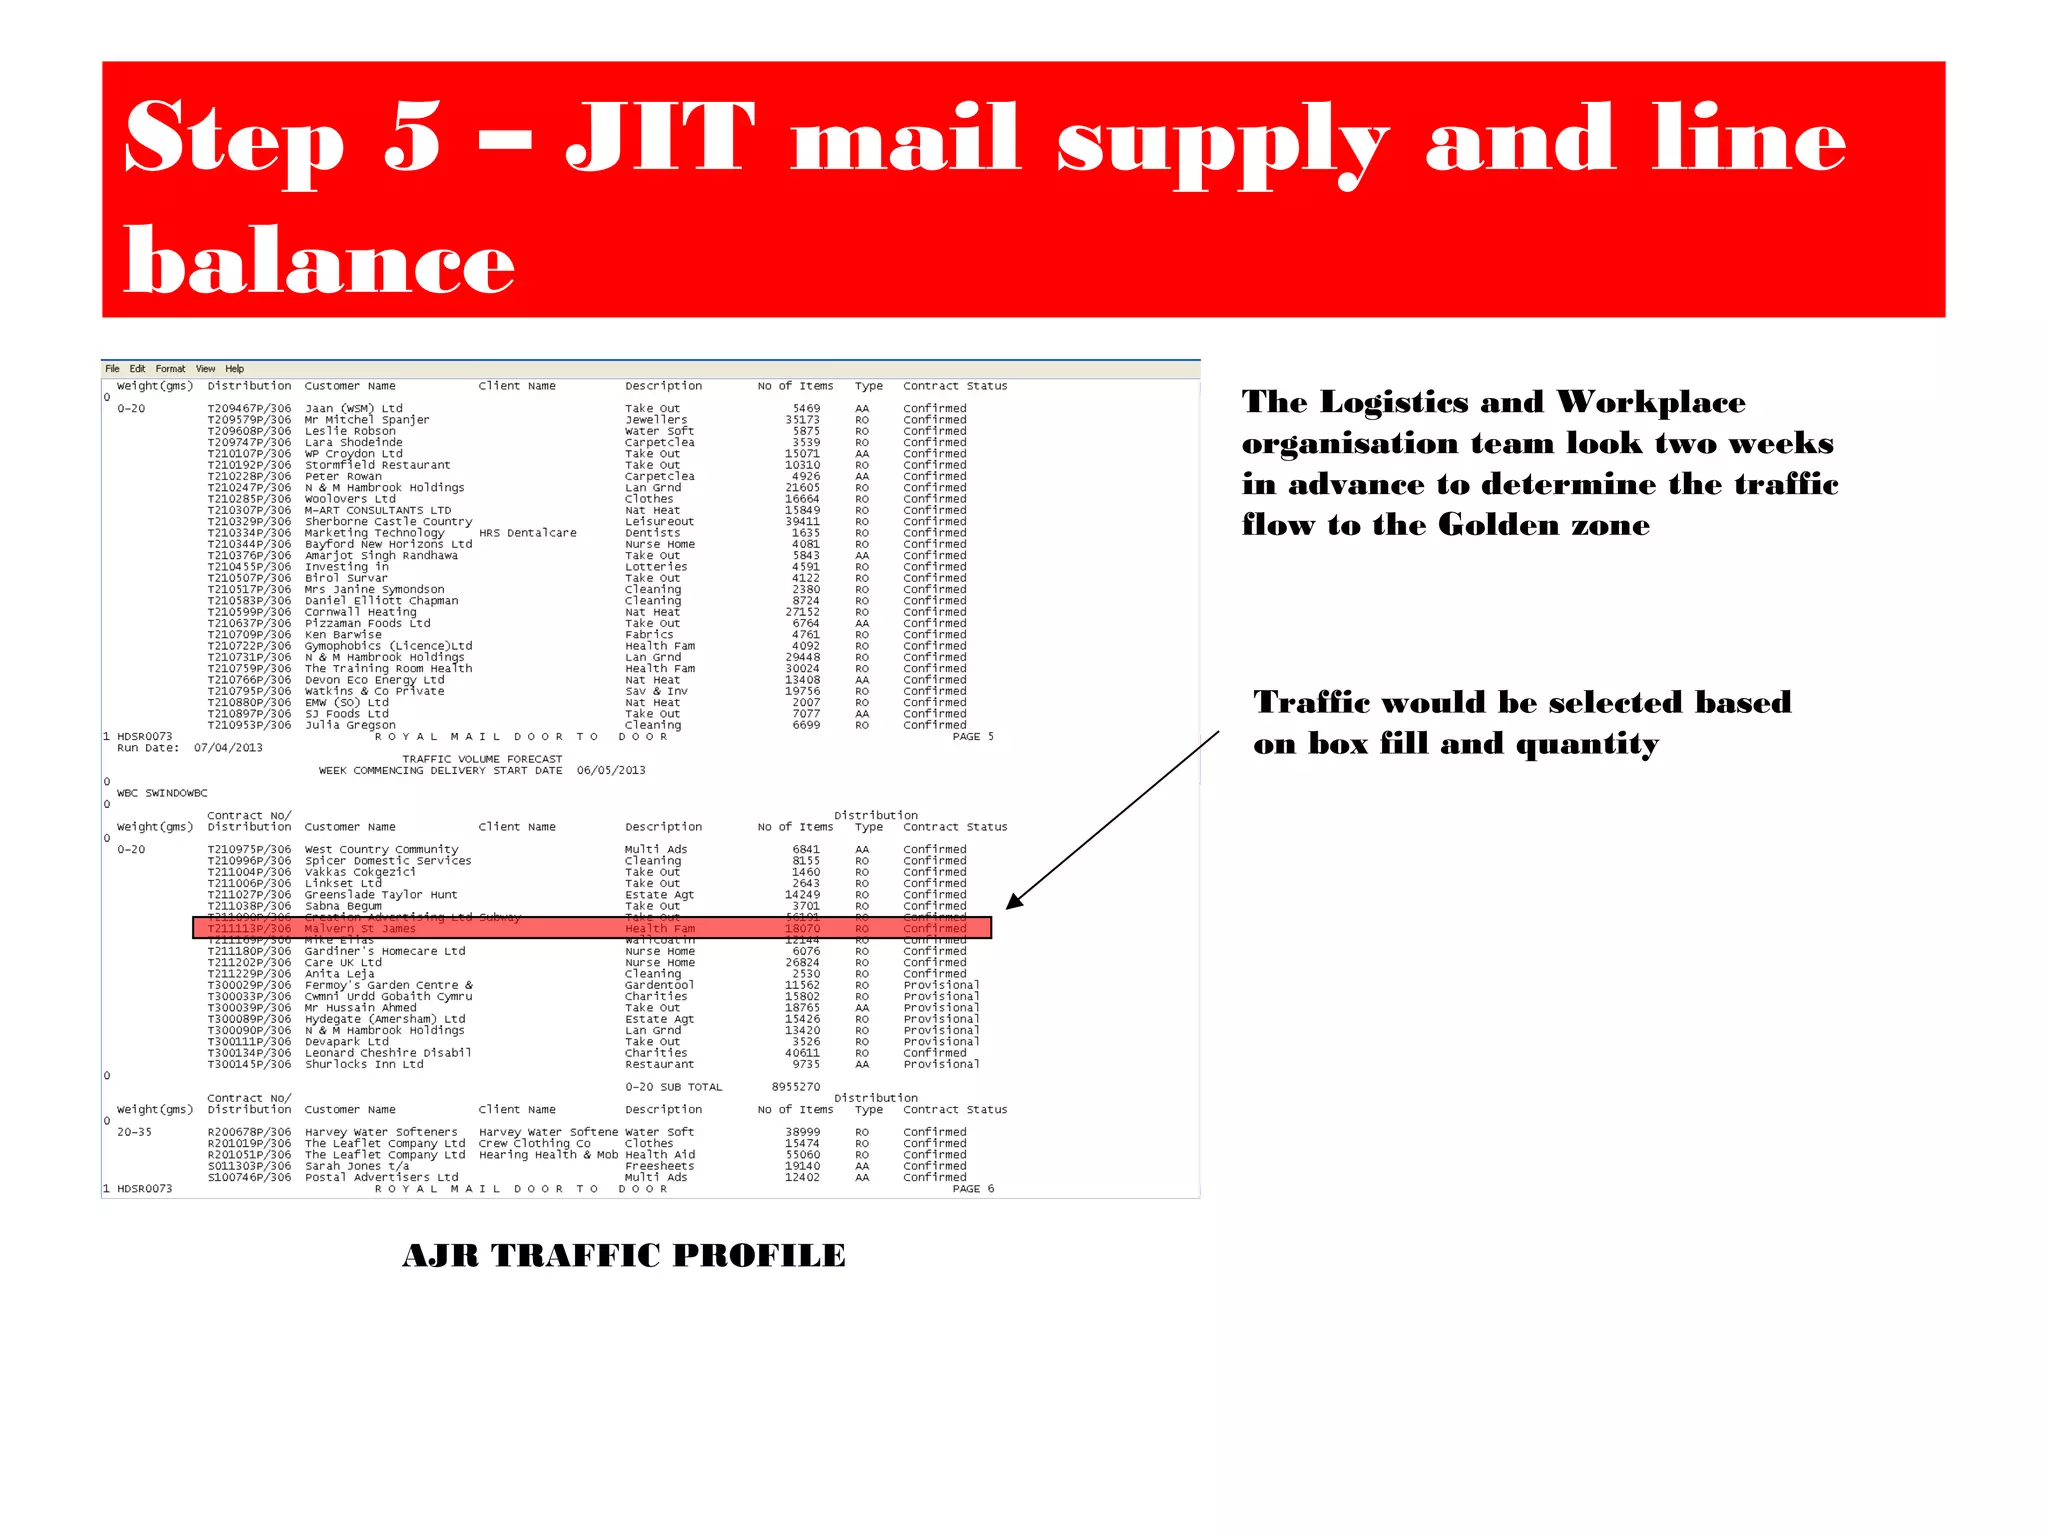
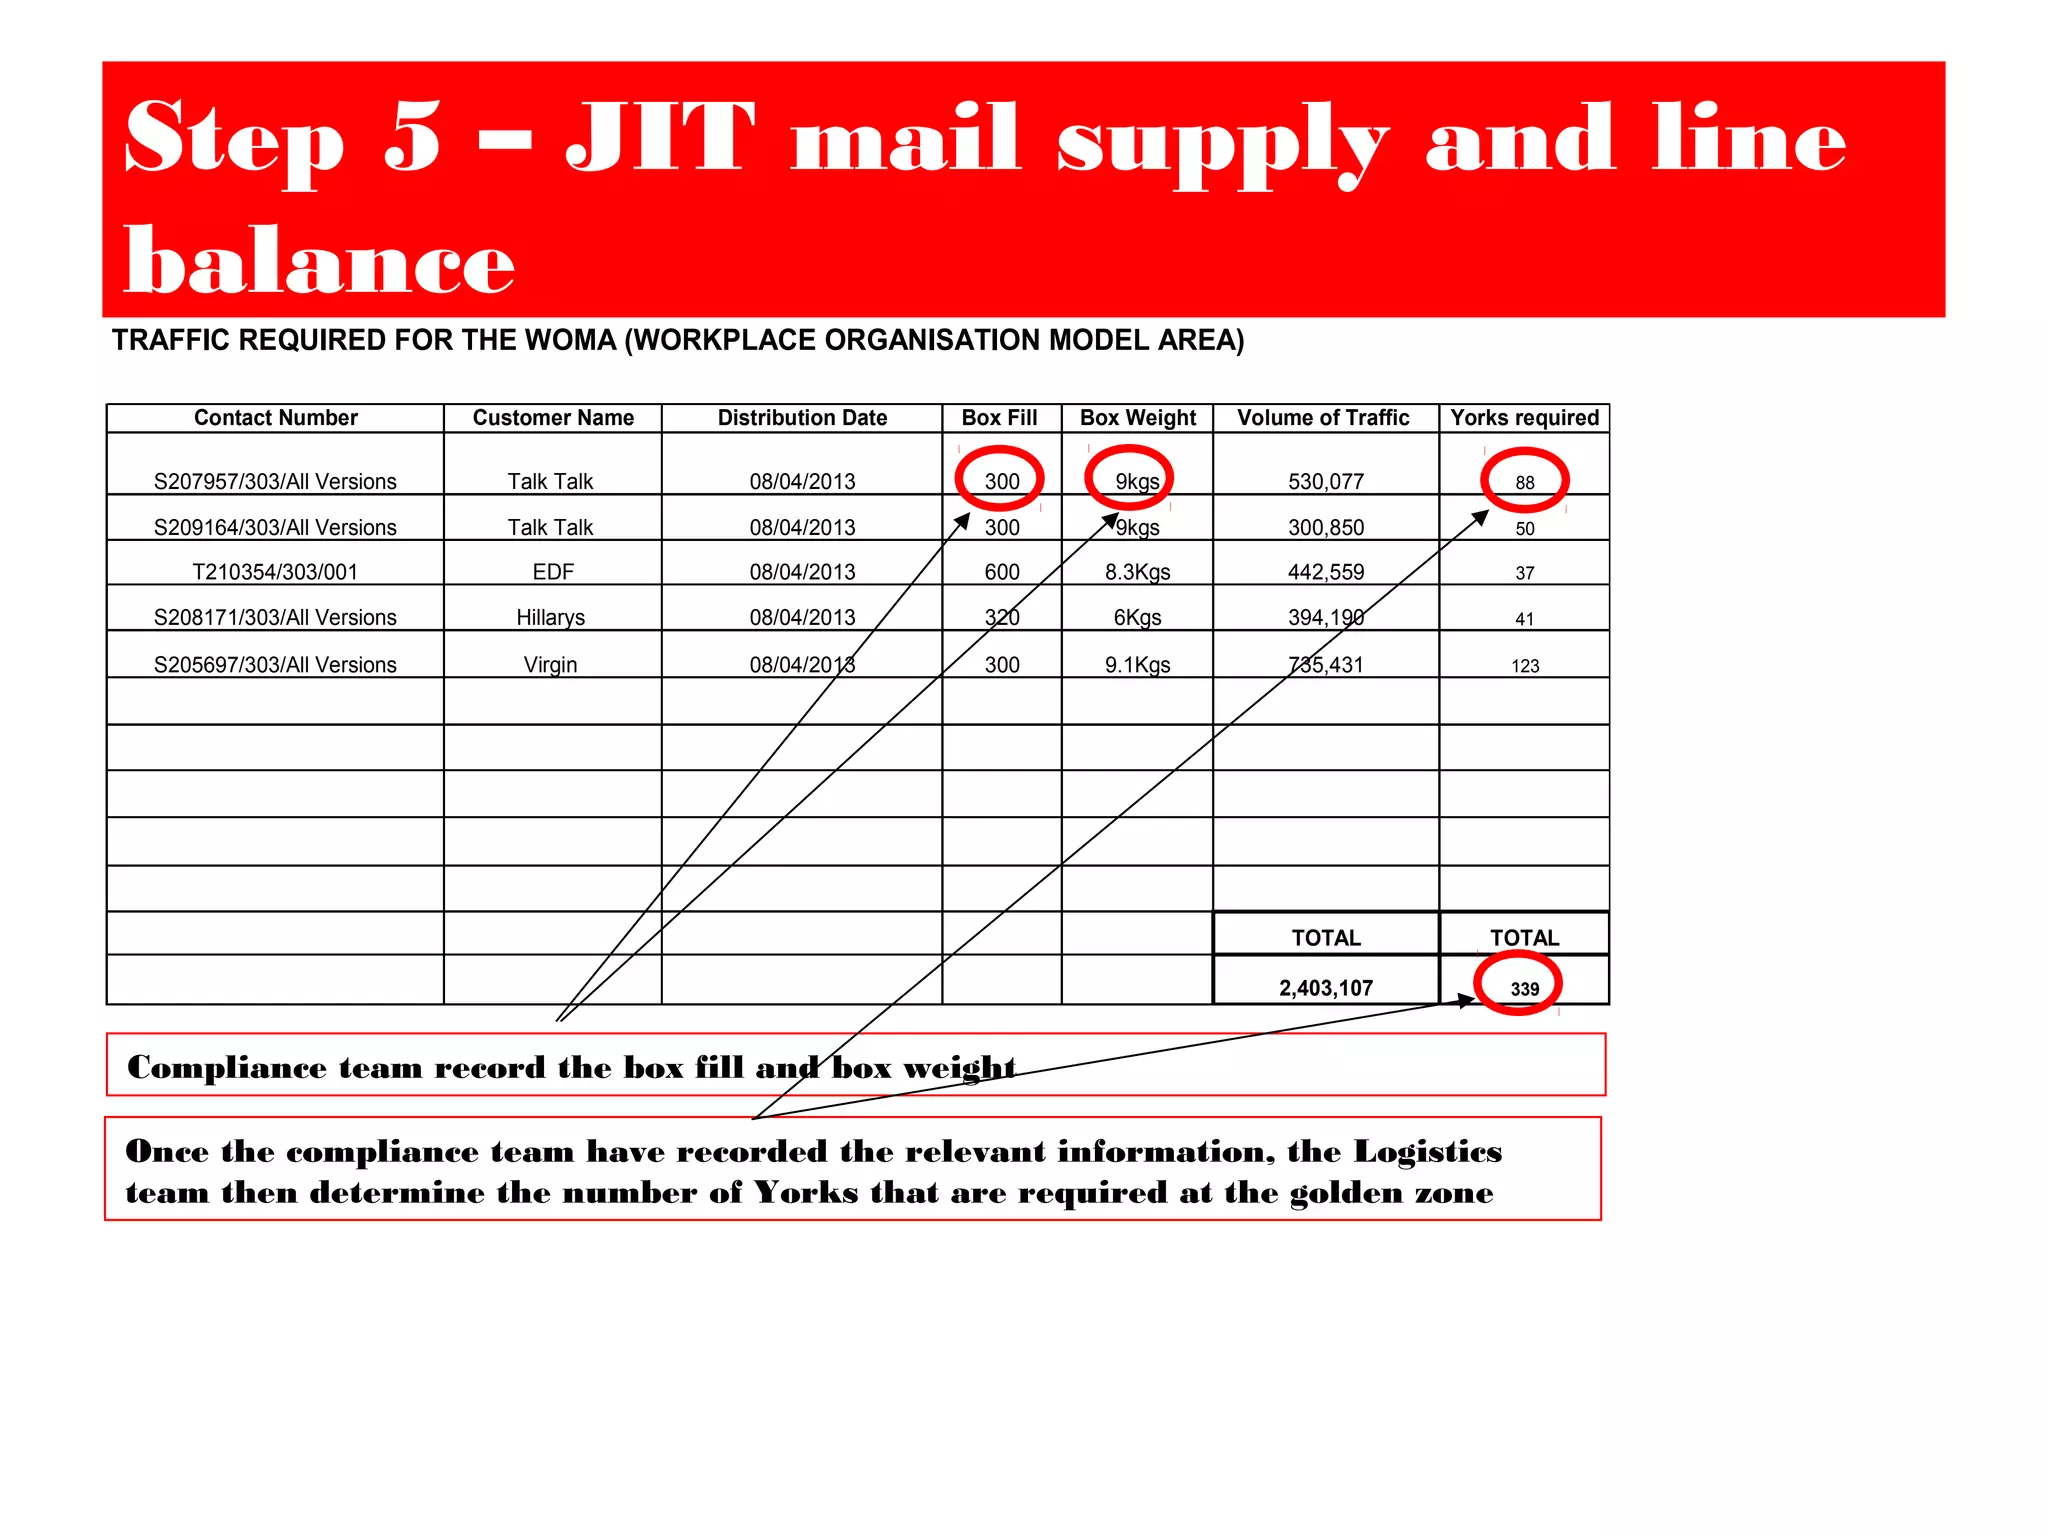
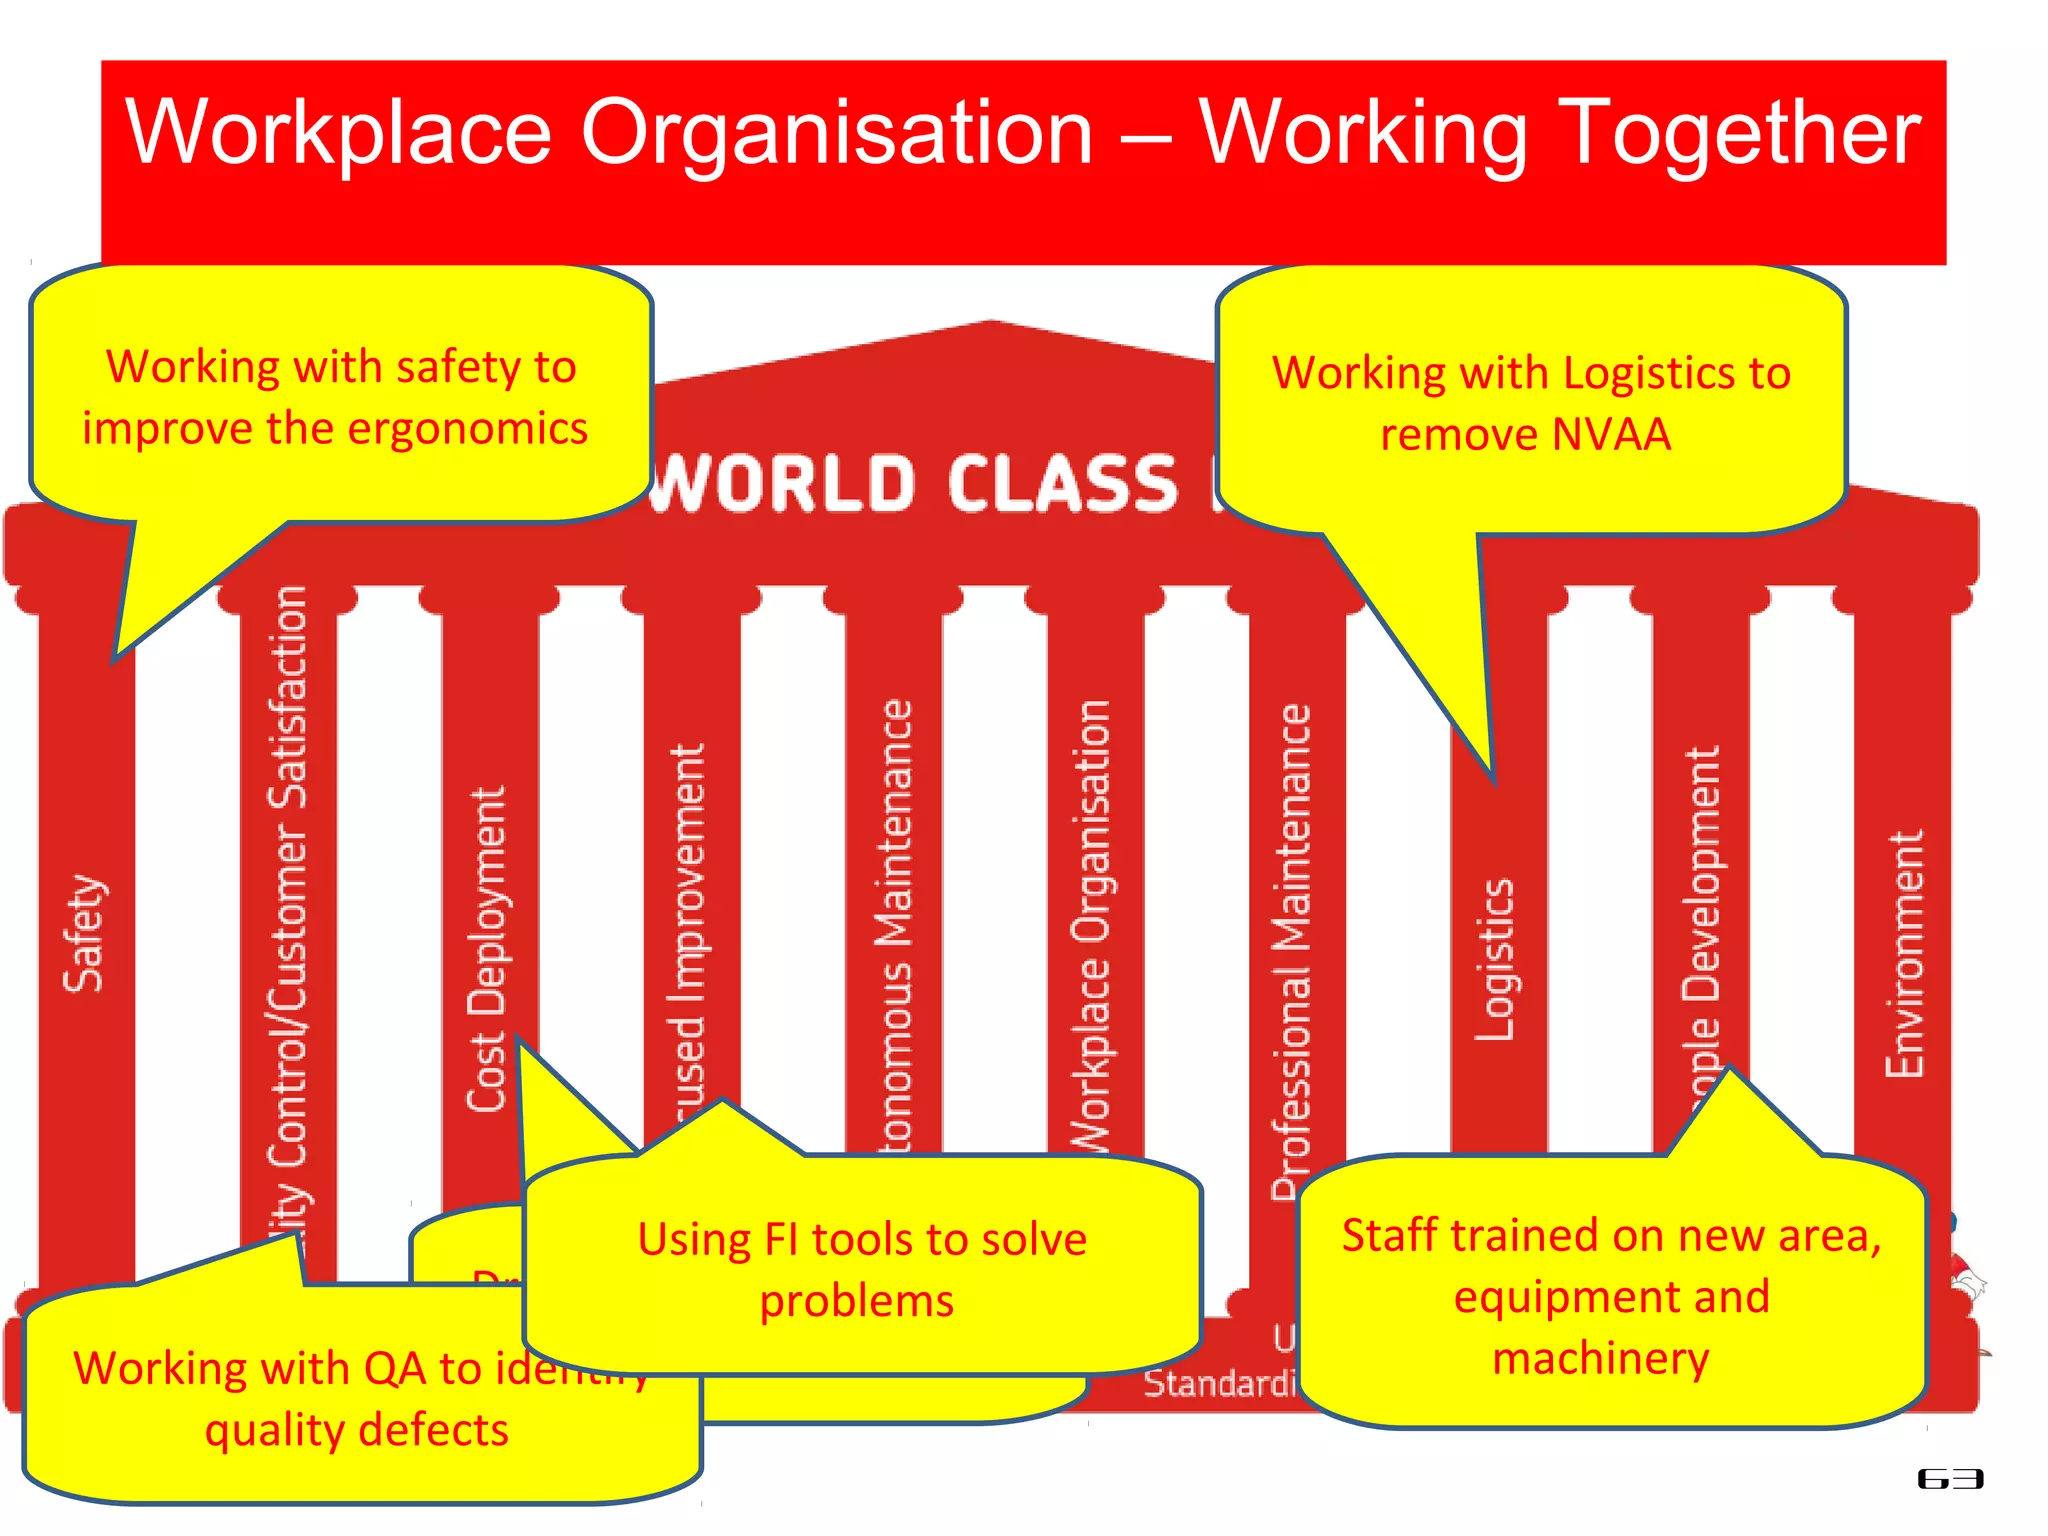
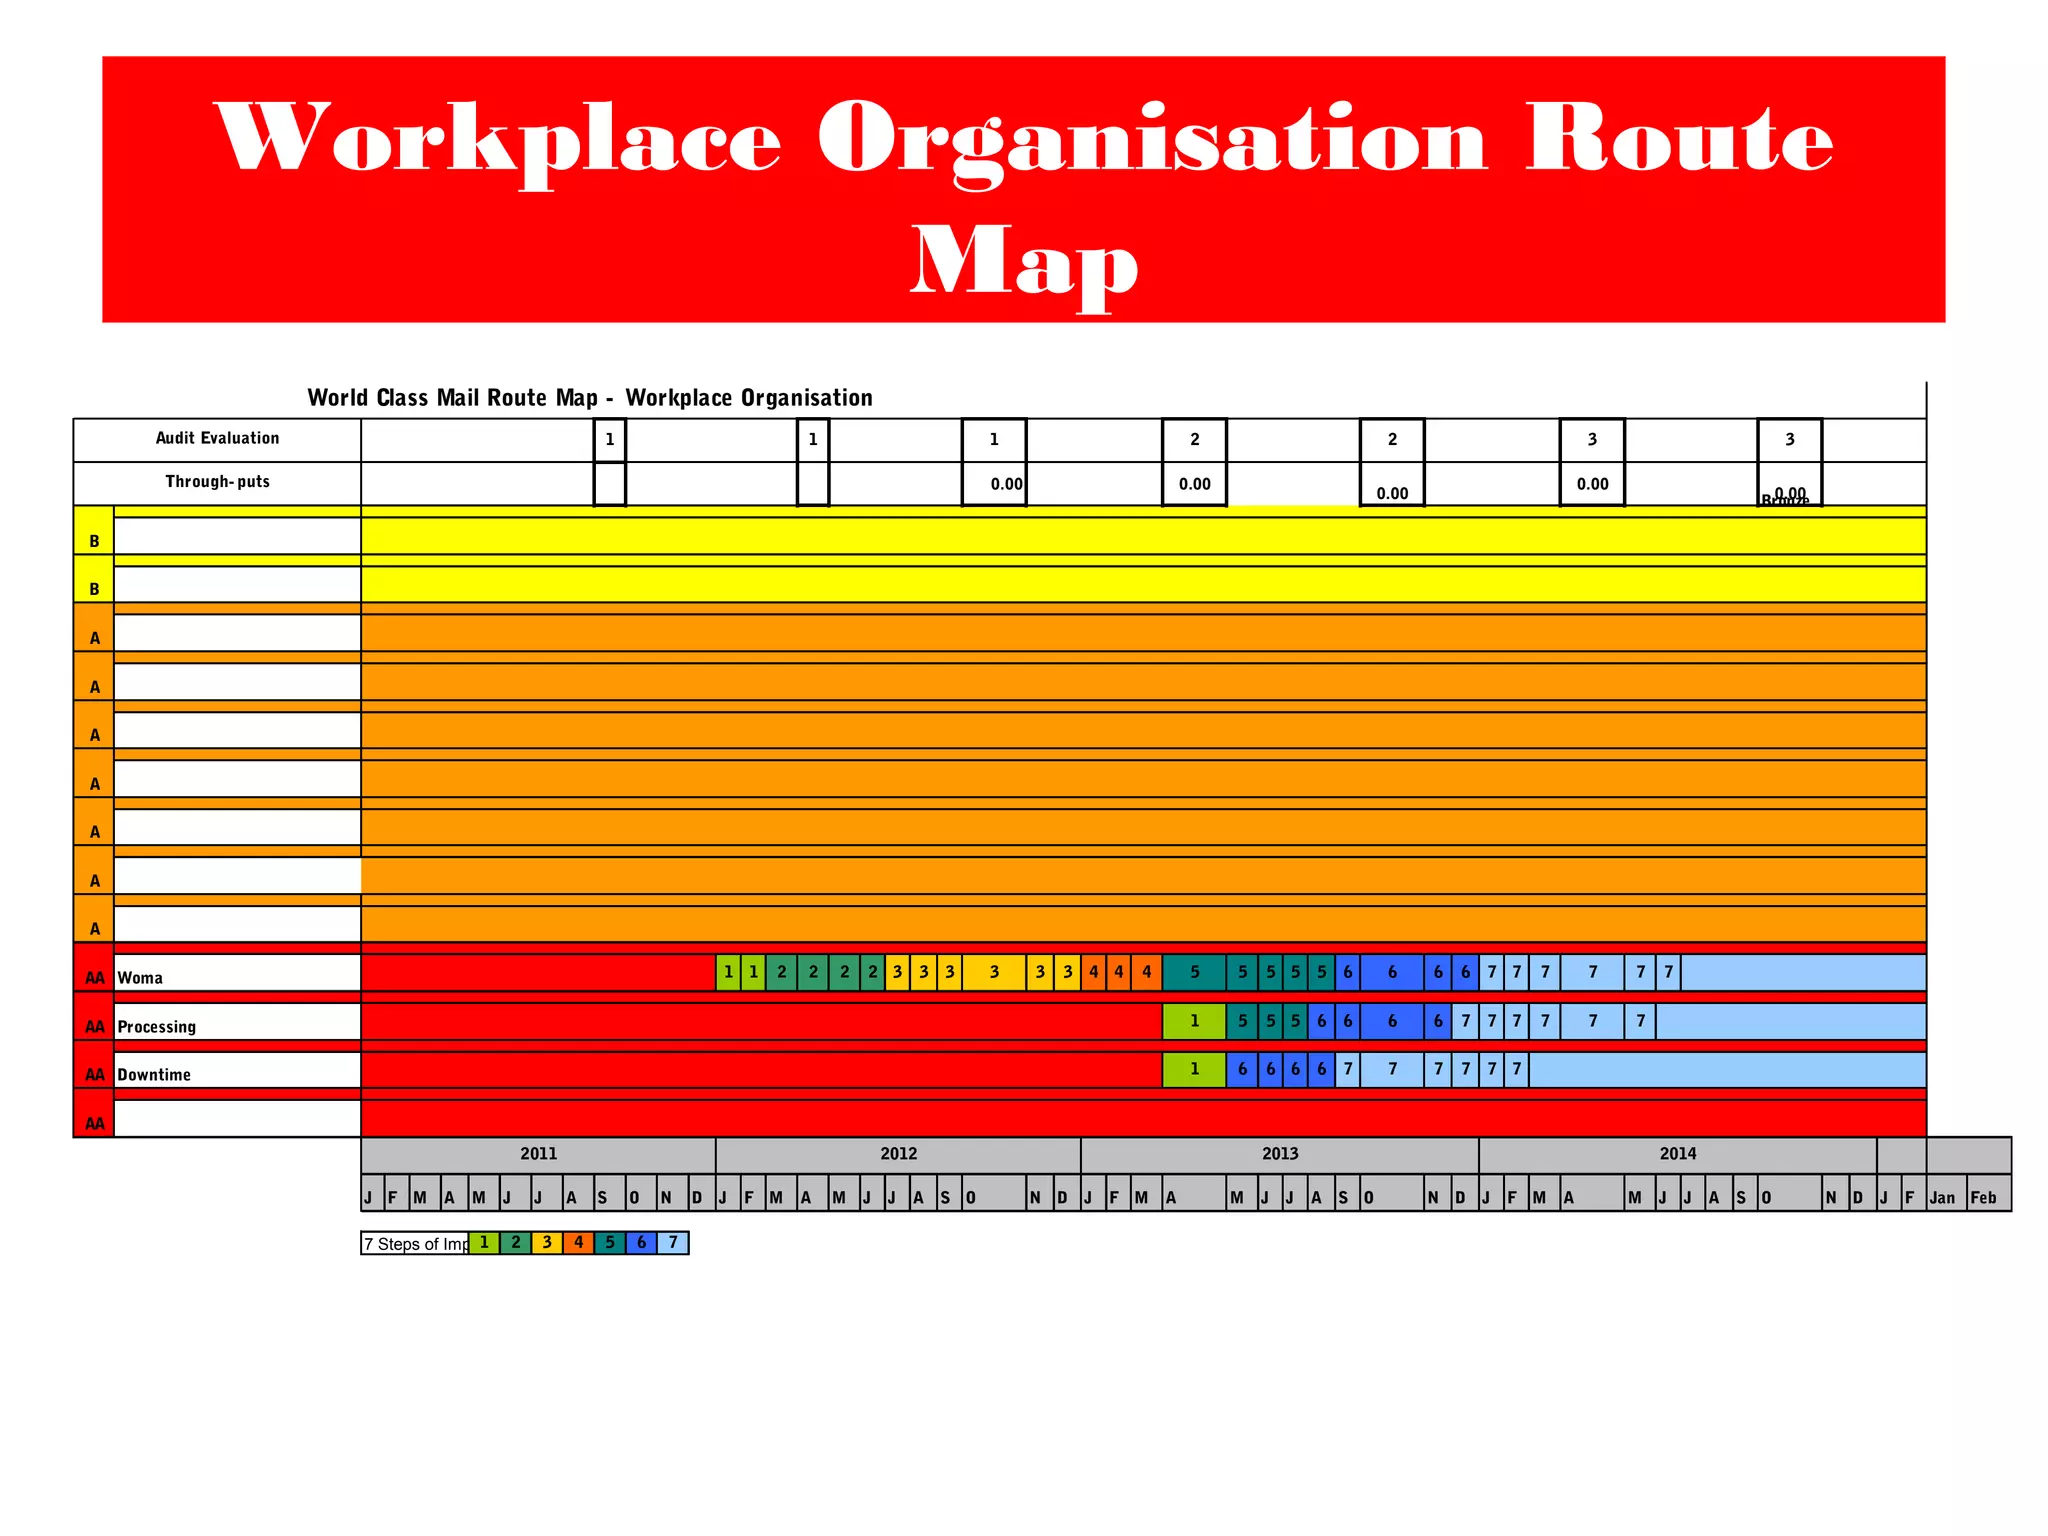
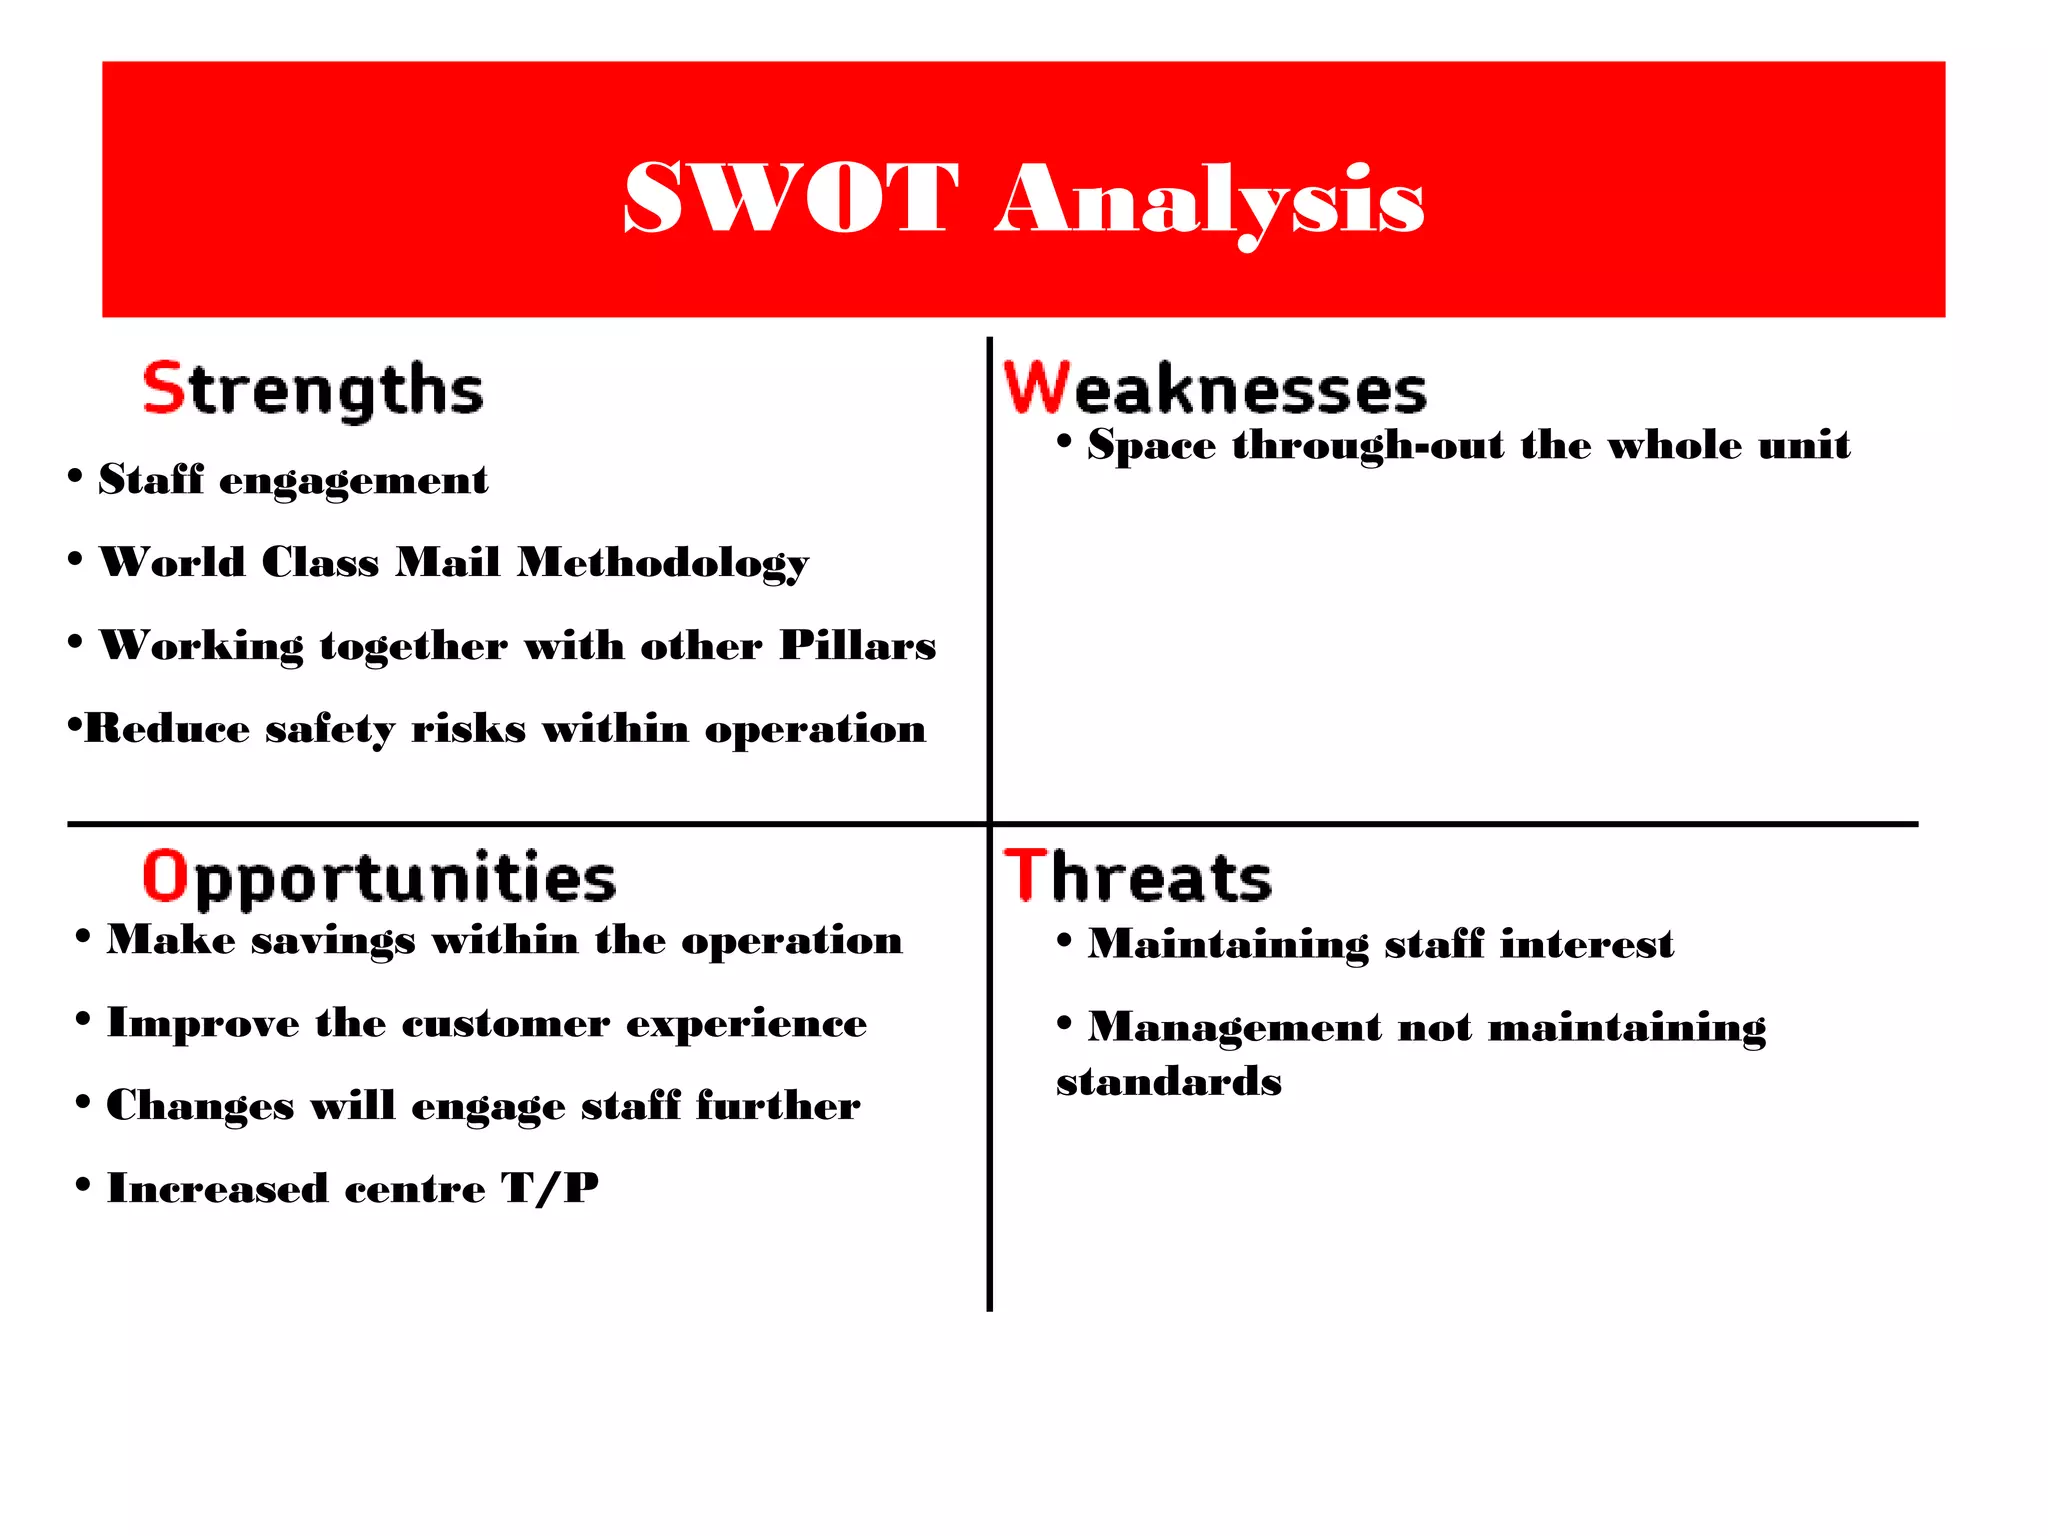
The document discusses improving workplace organization at a mail processing facility through a 7 step model area approach. It begins with initial cleaning using 5S principles to organize the workstation. Measurement found average productivity increased by 250 items per work hour after implementing 5S. Further steps involve analyzing processing tasks to identify difficult motions, standardizing work procedures, and establishing just-in-time parts supply to optimize the workflow. The overall goal is to continuously enhance productivity by reducing waste and improving ergonomics through employee involvement in transformation of the model area.
Logistics WCM Presentation Final - Converted (2)Ashley Smith
The document discusses improving logistics processes at a mail centre through implementing World Class techniques. It identifies key areas of waste and inefficiency through cost deployment analysis, including long cycle times for reach trucks and time lost to transportation between areas. The logistics team will take a 3G approach to analyze current processes, identify issues like double handling of materials and downtime, and implement steps like rearranging internal logistics and standardizing work to reduce waste and meet productivity targets.
This document appears to be a presentation on visual management. It discusses the concepts of visual management and the 5S methodology for organizing the workplace. The 5S methodology involves sorting, stabilizing, shining, standardizing, and sustaining the work environment. Tools of visual management like displays and controls are highlighted to guide staff actions. Benefits of visual management include improved information sharing, worker autonomy, and continuous improvement. Checklists are provided to audit conformance to 5S principles and identify areas needing attention.
The document discusses the concepts of Lean Management and the Toyota Production System (TPS). It focuses on eliminating the three M's - Muda (waste), Mura (unevenness), and Muri (overburdening). Muda refers to any non-value-added work and can take several forms like motion, waiting, transporting, overproduction, defects, and overprocessing. Mura involves eliminating inconsistencies in processes. Muri involves overburdening equipment, facilities, and people. Value stream mapping and the Plan-Do-Check-Act cycle are recommended for identifying and addressing the three M's to achieve smooth and efficient processes without waste.
1) The document provides definitions and explanations of terms related to Quality Control Circles (QCC) such as quality, problem, kaizen, PDCA cycle, and standardization.
2) It describes the 3 basic principles of QCC as rotating the PDCA cycle, judging and acting based on facts and data, and performing standardization.
3) Examples of two quality tools, Pareto diagram and cause-and-effect diagram, are shown to illustrate problems in a press shop and causes of dents on a rear door panel.
This case study examines a Lean Manufacturing initiative involving three aerospace suppliers - Haynes International Ltd, Precision Parts Engineering Ltd, and Merc Engineering Ltd - and their customer, Unison Engine Components. The objective was to reduce costs and improve delivery performance to combat low-cost competitors. A Lean consultant introduced tools like 5S, improved layouts, kanban systems and visual controls. Early results included a 15-22% improvement in on-time delivery, better awareness of customer needs, and more efficient operations.
The document discusses the seven types of muda or waste in production processes - transportation, inventory, waiting, overproduction, overprocessing, motion, and defects. It defines each type of waste and provides examples. It also discusses causes and effects of each waste type. Lastly, it introduces the 5S methodology - sort, straighten, shine, standardize, and sustain - as a tool to combat the seven wastes in processes.
Kanban is a pull system that uses visual signals to control work in process inventory and optimize material flow. It originated at Toyota in the 1950s to manage production line material flows using cards to signal the need for parts replenishment. Kanban limits work in process inventory by only authorizing production of additional inventory as and when needed, as signaled by empty containers. The key aspects of Kanban include using cards or signals to communicate production orders between processes, standardizing container sizes, and limiting inventory to just what is needed by the downstream process.
This document provides an overview of Toyota's production system (TPS), Just-in-Time (JIT) manufacturing, and lean manufacturing principles. It discusses the history and key figures in developing TPS, including Taiichi Ohno and Shigeo Shingo. The two pillars of TPS are described as Just-in-Time and Jidoka (autonomation). Methods for implementing lean such as heijunka level loading, kanban pull systems, reducing lot sizes and setup times to minimize waste are also summarized.
Lean manufacturing is a process that focuses on minimizing waste and maximizing productivity. It utilizes various tools such as 5S, andon systems, bottleneck analysis, continuous flow, gemba walks, heijunka leveling, and just-in-time production to improve efficiency and quality. Some key aspects of lean include identifying and eliminating muda (waste), using tools like value stream mapping and standard work, and implementing a culture of continuous improvement through kaizen events and PDCA cycles. The overall goal is to optimize operations and align production with customer demand.
Jidoka is a Lean manufacturing tool that allows for processes to be automatically stopped when a defect is detected. It was first developed in the late 19th century for textile looms to stop when a defective thread was detected. The key principles of Jidoka are to not accept defects, not produce defects, and not pass defects to subsequent processes. When a defect occurs, the process is stopped, the immediate issue is addressed, and the root cause is investigated and corrected.
Lean six sigma executive overview (case study) templatesSteven Bonacorsi
This case study describes a project to improve the average speed to answer calls at a retail business. The project team analyzed call data, identified root causes such as call type and time of day, and implemented cross-training and staffing changes. These improvements reduced customer downtime costs by $150,000 annually and increased the process sigma level. Key tools used in the project included data collection, analysis of call times, and control charts to monitor ongoing performance.
"Kaizen Eyes" Practice Exercises volume 1Tom Curtis
This document is an introduction to a series of exercises aimed at developing "Kaizen Eyes" - the ability to see opportunities for improvement and lean applications in one's surroundings. It contains 42 photos with brief explanations from the author of how each photo illustrates a lean concept like visual management, standard work, mistake proofing, etc. The introduction explains that analyzing the photos is meant to strengthen the reader's ability to identify such applications in their own environment and think of ways to apply similar improvements.
Lean, Just-in-time,and Toyota Production Systemjasonhian
1. The document discusses Toyota's production system known as the Toyota Production System (TPS), which emphasizes just-in-time production and the elimination of waste.
2. Key aspects of TPS include just-in-time production using a pull system with kanban cards, continuous improvement, and maintaining low levels of inventory to expose problems and force their resolution.
3. TPS aims to produce only what is needed when it is needed through a pull-based system rather than a push-based production schedule, in order to reduce waste and costs.
Value" is any action or process that a customer would be willing to pay for. Lean manufacturing is a management philosophy focused on the reduction of the "seven wastes in" order to improve overall customer value.
This project aimed to reduce internal rejections like piston rod burn, low tension, and others during the manufacturing process at Gabriel India Ltd. in Parwanoo. The student analyzed defects using fishbone diagrams to identify causes like improper cleaning, misalignment, and loose bolts. Measures like using a 4-bolt indexing fixture instead of 2-bolts and changing the part direction sequence helped eliminate piston rod burn and reduced rejections due to low tension. The project helped track root causes of defects and suggest solutions, while giving the student experience with quality analysis tools.
The document introduces the concept of a pull system in manufacturing. It explains that a pull system models production after a supermarket, where the downstream process "pulls" parts as needed from the upstream supplier or process. This contrasts with a traditional push system where parts are produced and pushed to downstream processes based on a schedule. The key advantages of a pull system include only producing what is needed, eliminating overproduction and waste, and ensuring good flow of materials through the process. Kanban cards are also introduced as the mechanism for signaling production requests between processes in a pull system.
The document discusses World Class Manufacturing (WCM) and its 10 pillars and 10 technical steps. It outlines approaches to identify losses at various levels including plant, logistics, and yard management. Specific cases show optimizing finished goods inventory and automating invoicing processes to reduce space, inventory levels, and processing time. A second case demonstrates deploying improvements horizontally by changing body transportation to increase carrying capacity and reduce costs. The key is to measure losses, prioritize high impact projects, apply WCM tools to resolve issues, track results and horizontally expand successes.
In any SME manufacturing organizations, one of the major causes for low plant utilization is changeover loss.In this presentation, using SMED methodology, step by step process is given to reduce the changeover loss.Also shared the real examples of changeover loss reduction in various manufacturing industries using SMED concept.Hope this is useful for any organization struggling with low plant utilisation due to changeover loss..
This document outlines a plan to reduce SMT changeover time at Bose from 30 minutes to 18 minutes (a 40% reduction). It involves a 12-step process to define the problem, analyze root causes, identify countermeasures, implement solutions, and monitor results. Key countermeasures selected include training on a "F1 mindset", moving tasks like material scanning and setup preparation offline, and ensuring gantry tables are ready ahead of changeovers. Initial results showed the new changeover time of 18 minutes was achieved. Ongoing monitoring and standardization across lines is planned.
The document discusses quick changeovers and SMED (Single Minute Exchange of Die) methodology. It provides a 10 step process for analyzing and streamlining a changeover process, including observing the current process, separating internal and external tasks, converting internal tasks to external where possible, streamlining tasks, testing the new process, documenting it, and continuously improving changeover times. The goal is to reduce changeover times to under 10 minutes or ideally under 100 seconds through applying SMED principles like eliminating non-value added tasks, establishing standards, and making tasks parallel and more efficient.
This document discusses lean production methods for 1-piece flow versus batch and queue production. It notes that a bottleneck will always exist in any process, and that bottlenecks can move. It recommends managing a buffer before the bottleneck and avoiding high work-in-process, which can mask the bottleneck. The document also discusses benefits of 1-piece flow such as workers being able to help each other and learn different tasks, and improving bottleneck operations.
The document discusses concepts from the Toyota Production System including kaizen (continuous improvement), the seven types of muda (waste), and strategies to minimize waste and lead time. It explains that muda includes overproduction, waiting, transportation, unnecessary processing, inventory, motion, and defects. The Toyota system aims to continuously improve processes by identifying and eliminating muda to maximize value added work and minimize costs in order to better satisfy customers.
This document describes 25 lean tools used to eliminate waste and improve manufacturing processes. It provides a brief description of each tool, including how it helps reduce waste. Some of the key tools discussed are 5S, which organizes and standardizes the workplace; ANDON, a visual system that alerts others when help is needed; bottleneck analysis for improving throughput; and value stream mapping to identify opportunities for process improvement. The overall goal of these various lean tools is to maximize value and minimize waste in production.
This document provides an overview of Total Productive Maintenance (TPM). It begins with definitions of TPM, noting that it aims for overall equipment effectiveness through the participation of all employees. The history of TPM is then summarized, originating from Japan in the 1950s. The objectives and principles of TPM are then outlined in brief, including using Overall Equipment Effectiveness as a metric and improving maintenance systems. Finally, the five pillars of TPM are listed as individual improvement, autonomous maintenance, planned maintenance, quality maintenance, and education and training.
This document provides a detailed 5S implementation plan to guide teams in improving visual workplace organization through 5S. The plan outlines six key steps for developing a 5S implementation project including identifying a project area, forming a project team, coordinating the 5S week, communicating the plan, coordinating support services, and communicating the plan to management. It then provides guidance on performing sorting activities such as identifying unnecessary items, conducting a sorting auction, and completing the sorting process. Finally, it discusses preparing for the simplifying process.
This document summarizes a project to reduce waste from a Klikklok machine that packages pies at a food manufacturing plant. The machine was contributing to production targets not being met. The Six Sigma DMAIC methodology was used. Data showed the machine wasted 14.11% of time. Root causes were identified using a cause-and-effect diagram. Loader arms on the machine were replaced, significantly reducing waste. Ongoing monitoring using control charts and a preventative maintenance calendar was recommended to sustain the improvements.
'How To Apply Lean Test Management' by Bob van de BurgtTEST Huddle
Cost reductions and the quest for more efficiency are more evident in today’s business world. It also follows that our testing processes will ultimately be affected. When test techniques and methods for structured testing are introduced, this results in improvements in the production of more consistent and predictable results.
Introducing a risk based approach to testing makes it easier for the business to determine to what extent testing is necessary and most efficient. The resulting Go/No- Go decision process may not be sufficient for all companies so other creative methods need to be investigated. Many management theories speak about “Lean” as being one of the solutions. One of the key steps in using “Lean” is the identification of which steps add value to the customer and which do not. This track will give you information to start using “Lean” within testing and more specifically within test management.
The presenter will also look at Lean Six Sigma as being one of the more popular theories that introduces the concept of “Lean” in combination with obtaining higher quality products. This subject will also be explained in combination with testing and test management. This track will focus on applying Lean Six Sigma techniques to test management processes using practical examples from customer cases. The audience can take home a practical “Lean Test Management” overview which they can apply in their own companies.
This track is especially of interest to business managers, IT managers, QA managers and test managers that are involved in improving the quality of test management processes.
Brandix Apparel India - Apparel InternshipAbhishek Raj
The document summarizes an apparel internship report from three interns at Brandix Apparel India. It discusses several projects completed during the internship, including standardizing material flow processes, developing a time calculator for the cutting section, and increasing efficiency of production modules. Mentors provided guidance on the projects which aimed to reduce waste and improve productivity at the apparel manufacturing facility.
Overview of 3 day Lean & Kaizen Course ContentTimothy Wooi
This document outlines the content of a 3-day Lean & Kaizen course. Day 1 covers topics like Lean Manufacturing principles, characteristics of Lean production including cellular layouts and Kanban systems. Day 2 focuses on standard work including takt time and pull production. Day 3 covers tools for standard work, Total Productive Maintenance (TPM), and Kaizen workshops which use small group projects to drive continuous improvement. The workshop method involves planning, implementing improvements on the production floor for a week, and follow up meetings to sustain results.
This document summarizes a case study applying lean manufacturing techniques at a furniture factory in Jordan. The researchers used various lean tools to analyze sources of waste, including a current state value stream map of a two-door cabinet production process. They identified issues like long lead times, low value-add percentage, and bottlenecks. A future state map was proposed with recommendations to achieve continuous flow, balance processes, and continuously improve through techniques like 5S and kaizen. Suggestions included better production planning, utilizing CNC machines, and improving marketing.
The document outlines an operational excellence project approach that involves making processes and performance metrics visible through analysis of reports, value streams, and financial data. Key aspects of the project include establishing goals and roles, reviewing current management systems, identifying best practices, and installing ongoing audit and training processes to ensure sustainability. A variety of industrial engineering tools will be used such as process task analysis, resource utilization analysis, variance studies, line balancing, and action planning to pursue ongoing process improvement. The roles of the consulting firm and client are to jointly analyze information, diagnose opportunities, develop recommendations, and have the client implement and own the process changes.
SCORE implimentation (Blue Nile PP bag).pptxmolla17
This document provides a summary of the progress made in implementing productivity improvements at Blue Nile PP Bag & Craft Paper Manufacturing P.L.C through the SCORE program. Baseline assessments identified opportunities to improve workplace cooperation, quality management, lean production, and occupational safety and health. Pilot areas were selected for implementing modules on these topics. Initial results include reducing material waste and search times, establishing 5S principles, and identifying workplace hazards. Future tasks involve developing standard operating procedures, applying sustaining mechanisms, and fully implementing proposed quality management and business continuity solutions.
The document discusses Lean methodology which focuses on eliminating waste to produce high quality products faster and at lower cost. Lean aims to streamline processes through techniques like single piece flow, just-in-time production, and eliminating non-value added activities to improve throughput, quality, and customer satisfaction. Key aspects of Lean covered include value stream mapping, reducing the seven wastes, line balancing, managing bottlenecks, setup reduction, pull systems, and visual management.
In this world of fast held movement of goods right from Medicines to low shelf life products all gets governed by Supply Chain. A robust supply chain can get an product placed on top in terms of sales and reach.
Solution Consulting presentation is a one of a kind product and practices collected and implemented over 5 years of experience in redefining supply chain.
With Business defining Tools from Muda/Muri, kaizen, Reverse Engineering, Business Allocations and Diagnostics, Manufacturing Diagnostics, Implementation of Industry 4.0, Project Management, Call outs, data Modeling are key pointers in the presentation.
Fish Bone diagram for warehouse Design, and inventory collection pointers are also talked in the presentation.
Using lean to reduce prototype lead time 2006Chris Baichoo
The document discusses Watlow Batavia's efforts to reduce lead times for custom heating part prototypes from 12 weeks to 6 weeks using Lean concepts. It outlines four Kaizen events from 2003-2006 that standardized processes, created dedicated prototype cells, and reduced waste. As a result, productivity increased 34% from 2003-2006, sales doubled, and lead times were cut in half, improving competitiveness and ensuring the division's survival.
This document outlines a cluster project between 10 companies aimed at improving quality and productivity over 24 months. It details the common goals of building precision, infrastructure for continuous improvement, and breakthrough capabilities. Key activities include 5S training and implementation, identifying waste (muda, muri, mura) through 3M training, and a "my machine" campaign. Benchmark parameters, a roadmap, and homeworks to be presented in the first monthly review meeting are also provided. Tips on presentations, 5S organization, and executing a red tag campaign are given.
This document outlines a 24-month cluster project between multiple companies to improve manufacturing processes and achieve global competitiveness. The cluster includes 10 companies across various locations in India. The mission is to achieve world-class manufacturing through world-class processes. Common goals include building precision, infrastructure for continuous improvement, and capabilities for breakthroughs. Key activities will include training, implementation of processes, reviews and monitoring of progress against benchmarks.
Modern production management tools discussed include JIT, Kanban, Kaizen, ISO, and Poka Yoke. JIT aims to minimize waste through just-in-time production that pulls materials as needed. Kanban uses visual signals like cards to control production flow. Kaizen focuses on continuous improvement. ISO standards help ensure quality. Poka Yoke uses mistake-proofing devices. Key aspects of each tool are outlined, such as how Kanban cards signal production needs and the benefits of ISO certification.
The document discusses 5S and Lean Manufacturing techniques. It describes the 5S methodology which includes Sort, Set In Order, Shine, Standardize, and Sustain to identify and reduce abnormalities, waste, improve teamwork, cleanness, safety, and productivity. It also outlines the eight most common types of waste in Lean Manufacturing: transportation, inventory, motion, waiting time, overproduction, over processing, defects, and underutilized staff. The goal of Lean is to maximize customer value while minimizing waste.
The document summarizes the implementation of 5S practices in a manufacturing setting. It describes the 5S process which includes Sort, Set in Order, Shine, Standardize, and Sustain. Implementing 5S provided several benefits such as increased productivity, improved employee morale, reduced waste, and a safer work environment. Data was collected before and after the implementation, which showed improvements in various areas and processes. Suggestions included adding more testing and inspection machines to eliminate bottlenecks. In conclusion, implementing 5S and visual controls led to better space utilization, safety, accuracy, and inventory management.
The document provides an overview of facilities location and layout. It discusses factors that influence location selection such as proximity to markets, transportation, and labor costs. Methods for identifying an ideal location are described, including factor rating, weighted factor rating, load-distance, and break-even analysis. The principles and types of facility layouts are also outlined, such as process, product, and combination layouts. An activity relationship chart is introduced as a tool to represent the importance of locating operations near each other.
This document provides an overview of supply chain design and operations presented by Anqi Guo. It discusses where the presenter obtained their background from, including education and past clients. The content covers introductions to operations research and its applications in supply chain design. Case studies are presented on revitalizing a manufacturing company, designing a bike rental system, and improving a pharmacy supply chain for distributing antiviral drugs. Brief details are given on Amazon's use of algorithms to predict and stock popular products before customer orders.
SIC (Short Interval Control) is a structured process to regularly review performance data and identify opportunities to improve production effectiveness and efficiency. It involves:
1. Checking performance at short intervals (e.g. daily or every half hour) and making necessary corrections, to prevent small problems from becoming big ones.
2. Controlling process inputs to control outputs and meet goals like increased output, reduced costs and defects.
3. Having team members regularly look back at past performance, plan next actions, and implement plans to continuously improve performance.
The benefits of SIC include increased output, effectiveness, improvement speed, and employee engagement through localized focus and data-driven decision making.
This document provides an introduction to Lean Six Sigma for Black Belt candidates. It outlines the goals of the Black Belt training program which are to understand and apply Lean Six Sigma tools and methods to solve problems, improve performance and achieve goals. The DMAIC process of Define, Measure, Analyze, Improve and Control is described as the model that will be applied to projects during the training. The training typically occurs over 4-6 months using a learn and apply approach with coached projects solving real problems in the organization.
1. Workplace Organisation
Workplace Organisation – Swindon
WBC
The purpose of Workplace Organisation is to
minimise material handling and provide an
efficient workplace layout.
WORLD CLASS MAIL
Safety
QualityControl/CustomerSatisfaction
CostDeployment
Ip
AutonomousMaintenance
ProfessionalMaintenance
PeopleDevelopment
Environment
Commitment
Deployment
Involvement
Implementation
Communication
Evaluation
Understanding
Standardisation with Visibility
Measurement
Documentation
Focusedmrovement
Logistics
WorkplaceOrganisation
2. • Overview of the Pillar
• Cost Deployment and Area Classification
• Model area – process selection
Initial restore at the model area
• Step 1 – Initial Cleaning using 5S
• Step 2 – Tidying up process with 3M reduction
• Step 3 – Tentative standards applying S.O.P and cleaning procedures
Standard Improvement at the model area
• Step 4 - Mail Characteristics
• Step 5 – JIT parts supply
• Conclusion
• Summary
Agenda
3. Vision, Needs, objectives and
Targets
Vision
To continuously improve our
productivity at the
workstationby involving our
people in attacking our waste
and losses caused by poor
workplace organisation
Needs
•Staff engagement across all
three shifts, staff to actively
take part in trials in the model
area.
• Management to ensure 5S
activity is completed, and
standards are maintained in the
model area
•Strong relationship with the
Logistics pillar to compliment
good workplace organisation
Objectives
• To improve the WBC’s centre
KPI’s
• Improve productivity through
analysis of 3M
• Reduce material handling in our
4. Workplace Organisation Team
Workplace Organisation Pillar Lead
0
1
2
3
4
5G
5W+1H, 5Why
7 WCM Tools
Minimal material handling
Pace monitor
WO Step 1
WO Step 2
WO Step 3
Video monitoring method
Line balancing
Motion economy
7 IE Tools
One piece flow
Three obstacles
No forklifts
WO Step 4
WO Step 5
WO Step 6
Two video camera method
Picking methods
Ashley Smith
Pillar Lead Pillar Support
Gina Briggs
Workplace Organisation Pillar Team
0
1
2
3
4
5G
5W+1H, 5Why
7 WCMTools
Minimal material handling
Pace monitor
WOStep1
WO Step2
WOStep3
Videomonitoring method
Line balancing
Target Post Pre
Colin Boivin
Pillar Support
5. Step 7
Step 5
Step 6
Step 1
Step 2
Step 3
Step 4
Initial
Cleaning
Tidying
Up
Process
Tentativ
e
Standar
ds
Mail
Charact
eristic
Educatio
n
JIT Mail
Supply
& Line
Balance
Cycle
Time
Stabilise
d
Standar
disation
Current Position:
Model Area
Overview – The 7 Step Approach
6. Summary of Auditor feedback
Pillar Score
At the last audit we were tasked with maintaining the 5S standards put in place, and
focus on the processing of items at the workstation. We have clearly separated
logistics from the process by using 3M’s combined with a new way of working.
The actions we have completed
5S maintained, new activity shown on CD matrix
New best practice established by product and standardise with SOP
3M activity completed and logistics can be identified and separated
Productivity measured before and after and weekly meetings with CD for
updates
7. • Overview of the Pillar
• Cost Deployment and Area Classification
• Model area – process selection
Initial restore at the model area
• Step 1 – Initial Cleaning using 5S
• Step 2 – Tidying up process with 3M reduction
• Step 3 – Tentative standards applying S.O.P and cleaning procedures
Standard Improvement at the model area
• Step 4 - Mail Characteristics
• Step 5 – JIT parts supply
• Conclusion
• Summary
Agenda
8. Plan Do Check Act
Swindon WBC F Matrix
No Project Description Work Area Loss Type
Project
Leader
Total Loss
Identified
£k
Total Loss
Identified
Hours
WO2 Processing
Downtime /
Waiting for
Work
Colin Boivin
Colin
Boivin
3.1 112
Downtime waiting for work from
Storage & Racking (All)
Project
Sponsor
(Pillar
Lead)
WO15 Processing Measurement 538Processing work at the workstations 7.4Colin Boivin
Colin
Boivin
Colin Boivin
Colin
Boivin
10.0WO16
Workplace Organisation Model Area
(WOMA)
Processing
Operator
Motion
728.3
Pillar Overview – Cost
Deployment
Workplace Organisation
3 Projects
Total loss £25K
AA
Stratification
0
2000
4000
6000
8000
10000
12000
Woma Processing Downtime
WO Losses
£
Series1
10. • Overview of the Pillar
• Cost Deployment and Area Classification
• Step Zero - Model area – process selection
Initial restore at the model area
• Step 1 – Initial Cleaning using 5S
• Step 2 – Tidying up process with 3M reduction
• Step 3 – Tentative standards applying S.O.P and cleaning procedures
Standard Improvement at the model area
• Step 4 - Mail Characteristics
• Step 5 – JIT parts supply
• Conclusion
• Summary
Agenda
14. • Overview of the Pillar
• Cost Deployment and Area Classification
• Step Zero - Model area – process selection
Initial restore at the model area
• Step 1 – Initial Cleaning using 5S
• Step 2 – Tidying up process with 3M reduction
• Step 3 – Tentative standards applying S.O.P and cleaning procedures
Standard Improvement at the model area
• Step 4 - Mail Characteristics
• Step 5 – JIT parts supply
• Conclusion
• Summary
Agenda
15. Stratification of WO losses in set
up times
Processing set up time WO losses
00:00.0
00:08.6
00:17.3
00:25.9
00:34.6
00:43.2
00:51.8
01:00.5
Work York Labels York Cards Pens
Seconds
Target Set up times
0
0.5
1
1.5
2
2.5
3
3.5
Current Target
Minutes
Current
Target
3G
Go to the spot,
examine the
object, check
the facts and
figures
Key
1Work 00:51.0
2York 00:47.1
3Labels 00:39.9
4YorkCards 00:38.4
5Pens 00:36.2
16. Initial Cleaning
SEIRI
Step 1 Separate the necessary from the
unnecessary
Our aim is to help our staff change their habits to
help keep the Workplace tidy. To help achieve this
we performed a 5S at the model area, stripping the
area back to its basics where only the necessary was
kept
We cleaned up
the workstation and
removed materials
and containers
that stood in the way
22. Initial cleaning
JES ref: Pro001 Work Area: Processing tables
Step / Activity Impact How What good looks like
At the end of the shift, a
single empty york must be
placed at the desk for the
next processor
Please ensure that knifes,
pens, scissors are left at the
workstation at the end of
shift
Please ensure a pallet lifter
is left at the work station at
all times
Please ensure all York cards
are replenished
Issued by: Ashley Smith Verified by: Operator:Processors
Signature: Signature: Signature:
Date: Date: Date:
Quality Mandatory Sequence Occupational Safety Critical process for productLegend:
Job Element Sheet (JES)
Compliance
1
2
2A
3
Average operator
processed 10,000
items per work
hour at the
model.
250 items
increased
IPWH at model
area in first
hour
24. • Overview of the Pillar
• Cost Deployment and Area Classification
• Model area – process selection
Initial restore at the model area
• Step 1 – Initial Cleaning using 5S
• Step 2 – Tidying up process with 3M reduction
• Step 3 – Tentative standards applying S.O.P and cleaning procedures
Standard Improvement at the model area
• Step 4 - Mail Characteristics
• Step 5 – JIT parts supply
• Conclusion
• Summary
Agenda
26. Tidying up process
3M Reduction
D = items can be fetched by
walking
C = items can
be picked up by
turning the body
A= items can be taken by
stretching out the elbows,
both hands can be used
Operators work within the strike zone at the
workstation but they never work in the golden
Zone
27. Tidying up process
Muri
MURI 141
Level 1
Level 2
Level 3
54
38
44
WBC Processing cycle
3 2 1 3 2 1 3 2 1 3 2 1 3 2 1 3 2 1 3 2 1 3 2 1 3 2 1
# Activity
0°-15°
15°-30°
Morethan30°
0°-15°
15°-45°
Morethan45°
TotheWaist
Shoulder
Height
Abovethe
Shoulder
0°-30°
30°-60°
Morethan60°
0°-90°
90°-180°
Morethan180°
Easytopickup
withoutmoving
Itcanbepickedupwith
ahandbyreachingout
withthearm
Difficulttohandle-
Mustpayattention
0°-45°
45°-90°
Morethan90°
0-4Steps
5-9Steps
Morethan10Steps
Lessthan5Kg
5Kg-11Kg
Morethan11Kg
1 Fetch work x x x x x x x x x 6 4 3
2 Fetch Labels/Monitor sheets x x x x x x x x x 7 2 3
3 Fetch York x x x x x x x x x 5 2 9
4 Pallet lift er - moving boxes x x x x x x x x x 6 6 0
5 Moving boxes to scales x x x x x x x x x 4 6 6
6 Moving boxes from pallet to York x x x x x x x x x 3 4 12
7 Processing items x x x x x x x x x 7 4 0
8 Strapping items x x x x x x x x x 2 6 12
9 Taking York out - despatch x x x x x x x x x 4 4 9
10 0 0 0
11 0 0 0
12 0 0 0
13 0 0 0
14 0 0 0
25 0 0 0
6 0 3 5 1 3 7 2 0 4 1 4 6 3 0 5 2 2 4 4 1 5 0 4 2 6 1
Bending and
Straighten the
knees
Ergonomics Analysis
Pick up parts and
materials
Transportation of
weights
Walking
Evaluation Points
Level 1: 3 Points
Level 2: 2 Points
Level 3: 1 Point
Muri
Score: 136Movements
on the Job
Level
Wrist rotation angle Work range
Bending at the
Waist
Waist Rotation
Angle
Raising the Arms to
Accomplish the Task
6
0
3
5
1
3
7
2
0
4
1
4
6
3
0
5
2 2
4 4
1
5
0
4
2
6
1
6
7
5
6
4
3
7
2
4
0
0
0
0
0
0
4
2
2
6
6
4
4
6
4
0
0
0
0
0
0
3
3
9
0
6
12
0
12
9
0
0
0
0
0
0
0 5 10 15 20 25
28. WBC Processing cycle
3 2 1 3 2 1 3 2 1 3 2 1 3 2 1 3 2 1 3 2 1 3 2 1 3 2 1
# Activity
0°-15°
15°-30°
Morethan30°
0°-15°
15°-45°
Morethan45°
TotheWaist
Shoulder
Height
Abovethe
Shoulder
0°-30°
30°-60°
Morethan60°
0°-90°
90°-180°
Morethan180°
Easytopickup
withoutmoving
Itcanbepickedupwith
ahandbyreachingout
withthearm
Difficulttohandle-
Mustpayattention
0°-45°
45°-90°
Morethan90°
0-4Steps
5-9Steps
Morethan10Steps
Lessthan5Kg
5Kg-11Kg
Morethan11Kg
1 Fetch work x x x x x x x x x 6 4 3
2 Fetch Labels/Monitor sheets x x x x x x x x x 7 2 3
3 Fetch York x x x x x x x x x 5 2 9
4 Pallet lift er - moving boxes x x x x x x x x x 6 6 0
5 Moving boxes to scales x x x x x x x x x 4 6 6
6 Moving boxes from pallet to York x x x x x x x x x 3 4 12
7 Processing items x x x x x x x x x 7 4 0
8 Strapping items x x x x x x x x x 2 6 12
9 Taking York out - despatch x x x x x x x x x 4 4 9
10 0 0 0
11 0 0 0
12 0 0 0
13 0 0 0
14 0 0 0
25 0 0 0
6 0 3 5 1 3 7 2 0 4 1 4 6 3 0 5 2 2 4 4 1 5 0 4 2 6 1
Bending and
Straighten the
knees
Ergonomics Analysis
Pick up parts and
materials
Transportation of
weights
Walking
Evaluation Points
Level 1: 3 Points
Level 2: 2 Points
Level 3: 1 Point
Muri
Score: 136Movements
on the Job
Level
Wrist rotation angle Work range
Bending at the
Waist
Waist Rotation
Angle
Raising the Arms to
Accomplish the Task
6
0
3
5
1
3
7
2
0
4
1
4
6
3
0
5
2 2
4 4
1
5
0
4
2
6
1
6
7
5
6
4
3
7
2
4
0
0
0
0
0
0
4
2
2
6
6
4
4
6
4
0
0
0
0
0
0
3
3
9
0
6
12
0
12
9
0
0
0
0
0
0
0 5 10 15 20 25
Tidying up process
Muri
D = items can be
fetched by walking
C = items
can be
picked up
by turning
the body
A= items can be taken
by stretching out the
elbows, both hands
can be used
To attack Muri, our
aim was to focus on
the golden zone and
how the necessary
tasks could be
completed with ease
To achieve optimum,
operators should be able to
complete tasks required
within the golden zone
29. Tidying up process
Muri Working with the safety pillar, we looked at various
ways in which we could improve the ergonomics of
the operation.
Safety
Working with the
safety team to
improve the
ergonomics
30. Tidying up process
Muri
D = items can be
fetched by walking
C = items
can be
picked up
by turning
the body
A= items can be taken
by stretching out the
elbows, both hands
can be used
Our aim was to focus on making the
task easy for the operator and how
the job could be made easy by
removing the Muri
LIFTING Rotating
Bending Knees
Wrist rotation
31. Tidying up process
Golden Zone
120mm
1400mm
Each box has to be moved 1400mm
to the scales with a lift upwards of
120mm for the box to be weighed at
the golden zone
On average, 1 operator performs this
Operation repeatedly 400 times a day
32. Quick Kaizen – Driven by
safetyWorking with the
safety team to
improve the
ergonomics
Safety
How can we improve the Ergonomics
at the workstation?
Tim Jones at our first Audit
said that we should break
down the processing to
reduce Muri
The focus was on the Ergonomics of the
operations, and to improve the ergonomics was
to break down the operation
33. Tidying up process
Our ideas produced our
new model area.
We trialled this
Countermeasure that
reduces material
handlingWOMA (Workplace organisation model area)
34. Tidying up process
The trial was designed to use rollers to reduce material handling
by two operators feeding boxes down the rollers to the Golden zone
6 Man operation
36. Tidying up process
Once the boxes are at the scales, the operator weighs the items
within the golden zone.
When the weighing is complete, the operators then push
the boxes down the rollers to be strapped
37. Tidying up process
Two operators at the end of the
operation strap the boxes/bundle and put
these into the Yorks
38. Tidying up process
Countermeasure
WBC Processing Cycle (WOMO)
3 2 1 3 2 1 3 2 1 3 2 1 3 2 1 3 2 1 3 2 1 3 2 1 3 2 1
# Activity
0°-15°
15°-30°
Morethan30°
0°-15°
15°-45°
Morethan45°
TotheWaist
Shoulder
Height
Abovethe
Shoulder
0°-30°
30°-60°
Morethan60°
0°-90°
90°-180°
Morethan180°
Easytopickup
withoutmoving
Itcanbepickedupwith
ahandbyreachingout
withthearm
Difficulttohandle-
Mustpayattention
0°-45°
45°-90°
Morethan90°
0-4Steps
5-9Steps
Morethan10Steps
Lessthan5Kg
5Kg-11Kg
Morethan11Kg
1 Pallet lift er - moving boxes x x x x x x x x x 8 0 3
2 Moving boxes to scales x x x x x x x x x 9 0 0
3 Processing items x x x x x x x x x 9 0 0
4 Strapping items x x x x x x x x x 4 4 9
5 0 0 0
6 0 0 0
7 0 0 0
8 0 0 0
9 0 0 0
10 0 0 0
11 0 0 0
12 0 0 0
13 0 0 0
14 0 0 0
25 0 0 0
3 0 1 4 0 0 4 0 0 3 0 1 3 1 0 4 0 0 2 1 1 4 0 0 3 0 1
Evaluation Points
Level 1: 3 Points
Level 2: 2 Points
Level 3: 1 Point
Muri
Score: 46Movements
on the Job
Level
Wrist rotation angle Work range
Bending at the
Waist
Waist Rotation
Angle
Raising the Arms to
Accomplish the Task
Bending and
Straighten the
knees
Ergonomics Analysis
Pick up parts and
materials
Transportation of
weights
Walking
3
0
1
4
0 0
4
0 0
3
0
1
3
1
0
4
0 0
2
1 1
4
0 0
3
0
1
8
9
9
4
0
0
0
0
0
0
0
0
0
0
0
0
0
0
4
0
0
0
0
0
0
0
0
0
0
0
3
0
0
9
0
0
0
0
0
0
0
0
0
0
0
0 2 4 6 8 10 12 14 16 18
Pre Post
Level 1
Level 2
Level 3
54
38
44
82.6
85.7
31.7
12
4
30
%
TOTAL 136 46 67
41. Mura analysis – Unwrapping
pallets
Task’s
Collect Pallet
Unwrap Pallet
Open box/Bundle
Put box onto rollers
Weigh items
Put items onto rollers
Strap box/bundles
Put box/bundles into York
Push York out
Collect York
Histogram (Before)
0
10
20
30
75.00 78.01 81.02 84.03 87.04 90.05 93.06 96.07 99.08 102.09 105.00
to to to to to to to to to to to
72.00 75.01 78.02 81.03 84.04 87.05 90.06 93.07 96.08 99.09 102.10
Numberofsamples
0.00
0.01
0.02
0.03
0.04
0.05
0.06
0.07
0.08
0
20
40
60
80
100
120
140
Time for Standard Work Batch (Secs)
f(x)
Before After
Unwrapping a pallet at the workstation had
An impact on production as the line would stop whilst
The two operators were unwrapping the pallets
Range = 33
S/DEVIATION = 5.90
Mean = 89.50
42. Mura analysis – Unwrapping
pallets
Task’s
Collect Pallet
Unwrap Pallet
Open box/Bundle
Put box onto rollers
Weigh items
Put items onto rollers
Strap box/bundles
Put box/bundles into York
Push York out
Collect York
Wrap Pallet Unwrapped
Histogram (After)
0
10
20
30
40
50
60
70
20.55 22.10 23.66 25.21 26.77 28.32 29.88 31.43 32.99 34.54 36.00
to to to to to to to to to to to
19.00 20.56 22.11 23.67 25.22 26.78 28.33 29.89 31.44 33.00 34.55
Numberofsamples
0.00
0.01
0.02
0.03
0.04
0.05
0.06
0.07
0.08
0.09
0.10
0
20
40
60
80
10
0
12
0
14
0
Time for Standard Work Batch (Secs)
f(x)
Before After
Range = 17
S/DEVIATION = 4.43
Mean = 27.83
Range = 33
S/DEVIATION = 5.90
Mean = 89.50
Pre Post
43. Histogram (Before)
0
10
20
30
40
1.92 2.25 2.57 2.90 3.23 3.56 3.89 4.22 4.54 4.87 5.10
to to to to to to to to to to to
1.60 1.93 2.26 2.58 2.91 3.24 3.57 3.90 4.23 4.55 4.88
Numberofsamples
Mura analysis – Opening
Boxes/Bundles
Task’s
Collect Pallet
Unwrap Pallet
Open box/Bundle
Put box onto rollers
Weigh items
Put items onto rollers
Strap box/bundles
Put box/bundles into York
Push York out
Collect York
Range = 4
S/DEVIATION = 1.24
Mean = 3.47
0.00
0.05
0.10
0.15
0.20
0.25
0.30
0.35
0
5
10
15
20
25
30
35
40
Time for Standard Work Batch (Secs)
f(x)
Before After
44. Histogram (Before)
0
10
20
30
40
1.92 2.25 2.57 2.90 3.23 3.56 3.89 4.22 4.54 4.87 5.10
to to to to to to to to to to to
1.60 1.93 2.26 2.58 2.91 3.24 3.57 3.90 4.23 4.55 4.88
Numberofsamples
Mura analysis – Opening
Boxes/Bundles
Task’s
Collect Pallet
Unwrap Pallet
Open box/Bundle
Put box onto rollers
Weigh items
Put items onto rollers
Strap box/bundles
Put box/bundles into York
Push York out
Collect York
Range = 33
S/DEVIATION = 5.90
Mean = 89.50
Safety
Working with the
safety team to
improve the
irregular operations
Box Cutter
Operators using box cutters we more
efficient at opening boxes/bundles
45. Mura analysis – Opening
Boxes/Bundles
Task’s
Collect Pallet
Unwrap Pallet
Open box/Bundle
Put box onto rollers
Weigh items
Put items onto rollers
Strap box/bundles
Put box/bundles into York
Push York out
Collect York
Safety
Working with the
safety team to
improve the
irregular operations
Histogram (Before)
0
10
20
30
40
1.92 2.25 2.57 2.90 3.23 3.56 3.89 4.22 4.54 4.87 5.10
to to to to to to to to to to to
1.60 1.93 2.26 2.58 2.91 3.24 3.57 3.90 4.23 4.55 4.88
Numberofsamples
Histogram (After)
0
10
20
30
40
50
60
70
1.18 1.37 1.57 1.76 1.95 2.14 2.33 2.52 2.72 2.91 3.00
to to to to to to to to to to to
1.00 1.19 1.38 1.58 1.77 1.96 2.15 2.34 2.53 2.73 2.92
Numberofsamples
Range = 33
S/DEVIATION = 5.90
Mean = 89.50
Post
0.00
0.20
0.40
0.60
0.80
1.00
1.20
1.40
1.60
1.80
2.00
0
5
10
15
20
25
30
35
40
Time for Standard Work Batch (Secs)
f(x)
Before After
Working with Safety, we developed a S.O.P
46. STRAPPEX MACHINE
Mura analysis – Box strapping
Task’s
Collect Pallet
Unwrap Pallet
Open box/Bundle
Put box onto rollers
Weigh items
Put items onto rollers
Strap box/bundles
Put box/bundles into York
Push York out
Collect York
47. Histogram (Before)
0
10
20
30
3.40 3.81 4.22 4.63 5.04 5.45 5.86 6.27 6.68 7.09 7.40
to to to to to to to to to to to
3.00 3.41 3.82 4.23 4.64 5.05 5.46 5.87 6.28 6.69 7.10
Numberofsamples
Mura analysis – Box
strapping
0.00
0.05
0.10
0.15
0.20
0.25
0.30
0
5
1
0
1
5
2
0
2
5
3
0
3
5
4
0
4
5
Time for Standard Work Batch (Secs)
f(x)
Before After
Post
Range =
S/DEVIATION = 1.46
Mean = 5.18
48. WCM Unit: Work Area:
Ref:
Title:
Problem: Improvement:
Results
Trainer:
BEFORE AFTER
Area / Item Ref. :
Review Date:
OPL: ONE POINT LESSON
WCM Pillar: Safety
Contact: Date:
Approved by:
Training Date:
Trainees:
IMPROVEMENT 0000/OPL00X
Add graphics and text Add graphics and text
Mura analysis – Box
strapping
EN
VWorking
with
environment
we build an
OPL
COUNTERMEASURE
49. Mura analysis – Box
strapping
PreHistogram (After)
0
10
20
30
40
50
60
70
2.73 2.86 3.00 3.14 3.28 3.41 3.55 3.69 3.83 3.96 4.00
to to to to to to to to to to to
2.60 2.74 2.87 3.01 3.15 3.29 3.42 3.56 3.70 3.84 3.97
Numberofsamples
0.00
0.20
0.40
0.60
0.80
1.00
1.20
1.40
1.60
1.80
0
5
10
15
20
25
30
35
40
45
Time for Standard Work Batch (Secs)
f(x)
Before After
Range =
S/DEVIATION = 1.46
Mean = 5.18
Post
Range = 1
S/DEVIATION = 0.26
Mean = 3.19
51. Muda Analysis
AIM WAS TO CLEARLY
IDENTIFY MUDA AND REDUCE NVAA
# Process Steps Activity
Start
(sec)
End
(sec)
Duration Cum. Classification
1 Processing Collect pallet of work 0 62 62 62 NVA
2 Unwrap pallet at workstation 62 120 58 120 NVA
3 Packaging taken to bin 120 135 15 135 NVA
4 Count sample for scale calibration 135 160 25 160 SVA
5 Calibrate scales 160 170 10 170 SVA
6 Weigh items 170 175 5 175 VA
7 Strap box/bundles 175 178 3 178 VA
8 Put box/bundles into York 178 181 3 181 SVA
9 Write York card 181 190 9 190 SVA
10 Put York card onto York 190 196 6 196 NVA
11 take York out to despatch 196 301 105 301 NVA
12 Collect empty York and return to table 301 326 25 326 NVA
84%
14%
2%
0%
NVA
SVA
VA
NVAU
52. Quick Kaizen
How can we reduce Muda at the
workstation?
The focus was on the Muda within the
operations, and how, at the model area we can
reduce NVAA
54. 0%
85%
15%
0%
NVA
SVA
VA
NVAU
Muda Analysis
# Process Steps Activity
Start
(sec)
End
(sec)
Duration Cum. Classification
1 Processing Count sample for scale calibration 0 25 25 25 SVA
2 Calibrate scales 25 35 10 35 SVA
3 Weigh items 35 40 5 40 VA
4 Strap box/bundles 40 43 3 43 VA
5 Put box/bundles into York 43 46 3 46 SVA
6 Write York card 46 55 9 55 SVA
84%
14%
2%
0%
NVA
SVA
VA
NVAU
PRE POST
56. Production/Savings
Processing IPWH
0
2000
4000
6000
8000
10000
12000
14000
16000
18000
1 2 3 4 5 6 7 8 9 10 11 12 13 14 15 16 17 18 19 20 21 22
Week No
IPWH
Cost per 1000 items
0
0.2
0.4
0.6
0.8
1
1.2
1.4
1.6
Before After
£
Before
After
39p per 1000 items saved
Production
0
2000
4000
6000
8000
10000
12000
14000
16000
18000
Before After
Itemsperhour
Before
After
6500 items per hour
57. Step 3 – tentative standards
WCM Unit: Work Area:
Ref:
Title:
Problem: Improvement:
Results
Trainer:
BEFORE AFTER
Area / Item Ref. :
Review Date:
OPL: ONE POINT LESSON
WCM Pillar: Safety
Contact: Date:
Approved by:
Training Date:
Trainees:
IMPROVEMENT 0000/OPL00X
Add graphics and text Add graphics and text
WCM Unit: Work Area:
Ref:
Title:
Problem: Improvement:
Results
Trainer:
BEFORE AFTER
Area / Item Ref. :
Review Date:
OPL: ONE POINT LESSON
WCM Pillar: Safety
Contact: Date:
Approved by:
Training Date:
Trainees:
IMPROVEMENT 0000/OPL00X
Add graphics and text Add graphics and text
Box strapping Box cutter
1. Check the seg area is set
up correctly to the agreed
standard layout and ready to
use.
We need to ensure that
no damaged cages are
processed into…
Safety Comes First!
2. Attach the correct cage
cards to each RSC.
Ensure you use the
correct cage card & day
sticker. This makes sure
we are compliant with our
quality targets!
3. Ensure that there is no
more than 7 people working
in a singl
manual bullring area.
The Safe System of Work
directs that a safe
working bullring has a
ma ximum of 7 people at
all times.
4. Open the cage gate if
necessary to access contents.
Ensure that you are aware
of your surroundings
when opening the cage
gate!
5. Select a single bag from
the cage, read the label and
identify the correct
destination cage.
Take strong hold at the
neck of the bag.
6. Check the bag weight
BEFORE you lift the bag - if
the bag is overweight, follow
the 'Overweight Bag' Job
Element Sheet.
Test the weight before
fully lifting a bag to
prevent manua l handling
strains and injury!
7. Lift the bag using good
posture.
Bend your knees not your
back - this ensures the
weight of the bag is
focused on the strongest
part of your body.
8. Walk in the most direct
route to the destination cage.
Straight lines ar e better
and more efficient than
anyother way.
9. Halt or veer around
colleagues crossing your
path.
Avoid colliding into other
people to prevent
accidents, injury or
damage.
10. Carry the bag to arms
length of the destination
cage & place/drop bag into
cage.
You should never throw a
bag into a cage. This
unsafe act could cause
injury to you/ others and
damage to the bag
contents.
11. Close the cage gate if
necessary.
If a cage is filling up and
the cage gate is open,
ensure you close it to
prevent bags falling out
and causing a tripping
hazar d!
12. Walk to the nearest
available fedder cage.
If the nearest available
feeder cage is not
available then select
another cage to use.
Issued by: Verified by: JES Ref:
Ian Buckley James Bunt
01/ 08/ 11 01/08/2011
JOB ELEMENT SHEET
Manual Bullring Operation
Compliance…
Manual Seg V.3
Process Step Key Point
= CRITICAL STEP SAFETY WARNING =
Job Element Sheet
OPL’S to ensure the operators follow the correct
ways of processing
JES to ensure the operators follow the standard
way of working, including job rotation
58. Step 4 – mail characteristic
education
Swindon WBC Quality Matr
5 20 PLUS PPD 5 5
4 15-19 PPD 4 4
3 10-14 PPD 3 3
2 5-9 PPD 2 2
1 LESS THAN 5 PPD 1 1
A B1 B2 C D PI
Frequency Rework Compensation Detection Severity Total
5 5 90
24 24 432
100 10 90
45 41 364
100 100
96 224
50 50 50 50
14 14 126 126
100% 480
22470%
405
10% 28 90% 252
45 90%
30% 96
5
Responsibility
Act
Do
Plan
Check
Machine
Materials
5 450
5 42 2 5
24
I
Man
Method
Machine
Materials
Machine
Method
QA Matrix
280
480
320
450
Materials
44
55
4
Man
Method
Machine
3
E
E
Materials
Man
435 320
No
Man
10%
2
Recording of pallets in racking
2
Overweight boxes and bundles
Customer Complaints
30-60
1
Problem
Non conformity
identified
26 Box Fills IncorrectI 5 2
Internal /
External
Defect made & corrected
before processing
Frequency
Ranking
Racking
Cost
Over 2 hours
60-90
Customer Complaint
InternalLess than 30 minutes
5
Ranking
Customer Detection
Ranking
280
4
Activity Plan
ReturnsGoods in/Compliance
Method
Man
Materials
Method
Machine
Processing
Containers &
Despatch
Delivery office Detected
2
1
480
90-120
Priority Index = A* (B1+B2) * ΣC * D
Process Step in Walk Bundling Centre
4
3
Cost
Ranking
Customer Compensation
External/Pipeline
Customer Rework Charges
+/-
Mail Centre Detection
Defect made & corrected
after processing
Detection
A B1 B2
0
Compliance ProcessStorage Despatch
1
2
3
C
61. AJR TRAFFIC PROFILE
The Logistics and Workplace
organisation team look two weeks
in advance to determine the traffic
flow to the Golden zone
Traffic would be selected based
on box fill and quantity
Step 5 – JIT mail supply and line
balance
62. TRAFFIC REQUIRED FOR THE WOMA (WORKPLACE ORGANISATION MODEL AREA)
Contact Number Customer Name Distribution Date Box Fill Box Weight Volume of Traffic Yorks required
S207957/303/All Versions Talk Talk 08/04/2013 300 9kgs 530,077 88
S209164/303/All Versions Talk Talk 08/04/2013 300 9kgs 300,850 50
T210354/303/001 EDF 08/04/2013 600 8.3Kgs 442,559 37
S208171/303/All Versions Hillarys 08/04/2013 320 6Kgs 394,190 41
S205697/303/All Versions Virgin 08/04/2013 300 9.1Kgs 735,431 123
TOTAL TOTAL
2,403,107 339
Compliance team record the box fill and box weight
Once the compliance team have recorded the relevant information, the Logistics
team then determine the number of Yorks that are required at the golden zone
Step 5 – JIT mail supply and line
balance
63. 63
Working with safety to
improve the ergonomics
Driven by cost deployment
to reduce losses
Working with Logistics to
remove NVAA
Working with QA to identify
quality defects
Using FI tools to solve
problems
Staff trained on new area,
equipment and
machinery
Workplace Organisation – Working Together
64. Workplace Organisation Route
Map
1 1 1 2 2 3 3
0.00 0.00
0.00
0.00
0.00
B
B
A
A
A
A
A
A
A
AA Woma 1 1 2 2 2 2 3 3 3 3 3 3 4 4 4 5 5 5 5 5 6 6 6 6 7 7 7 7 7 7
AA Processing 1 5 5 5 6 6 6 6 7 7 7 7 7 7
AA Downtime 1 6 6 6 6 7 7 7 7 7 7
AA
J F M A M J J A S O N D J F M A M J J A S O N D J F M A M J J A S O N D J F M A M J J A S O N D J F Jan Feb
1 2 3 4 5 6 7
2014
World Class Mail Route Map - Workplace Organisation
Audit Evaluation
Through- puts
7 Steps of Improvement - Key
2011 2012 2013
Bronze
65. SWOT Analysis
• Staff engagement
• World Class Mail Methodology
• Working together with other Pillars
•Reduce safety risks within operation
• Space through-out the whole unit
• Make savings within the operation
• Improve the customer experience
• Changes will engage staff further
• Increased centre T/P
• Maintaining staff interest
• Management not maintaining
standards