Download to read offline

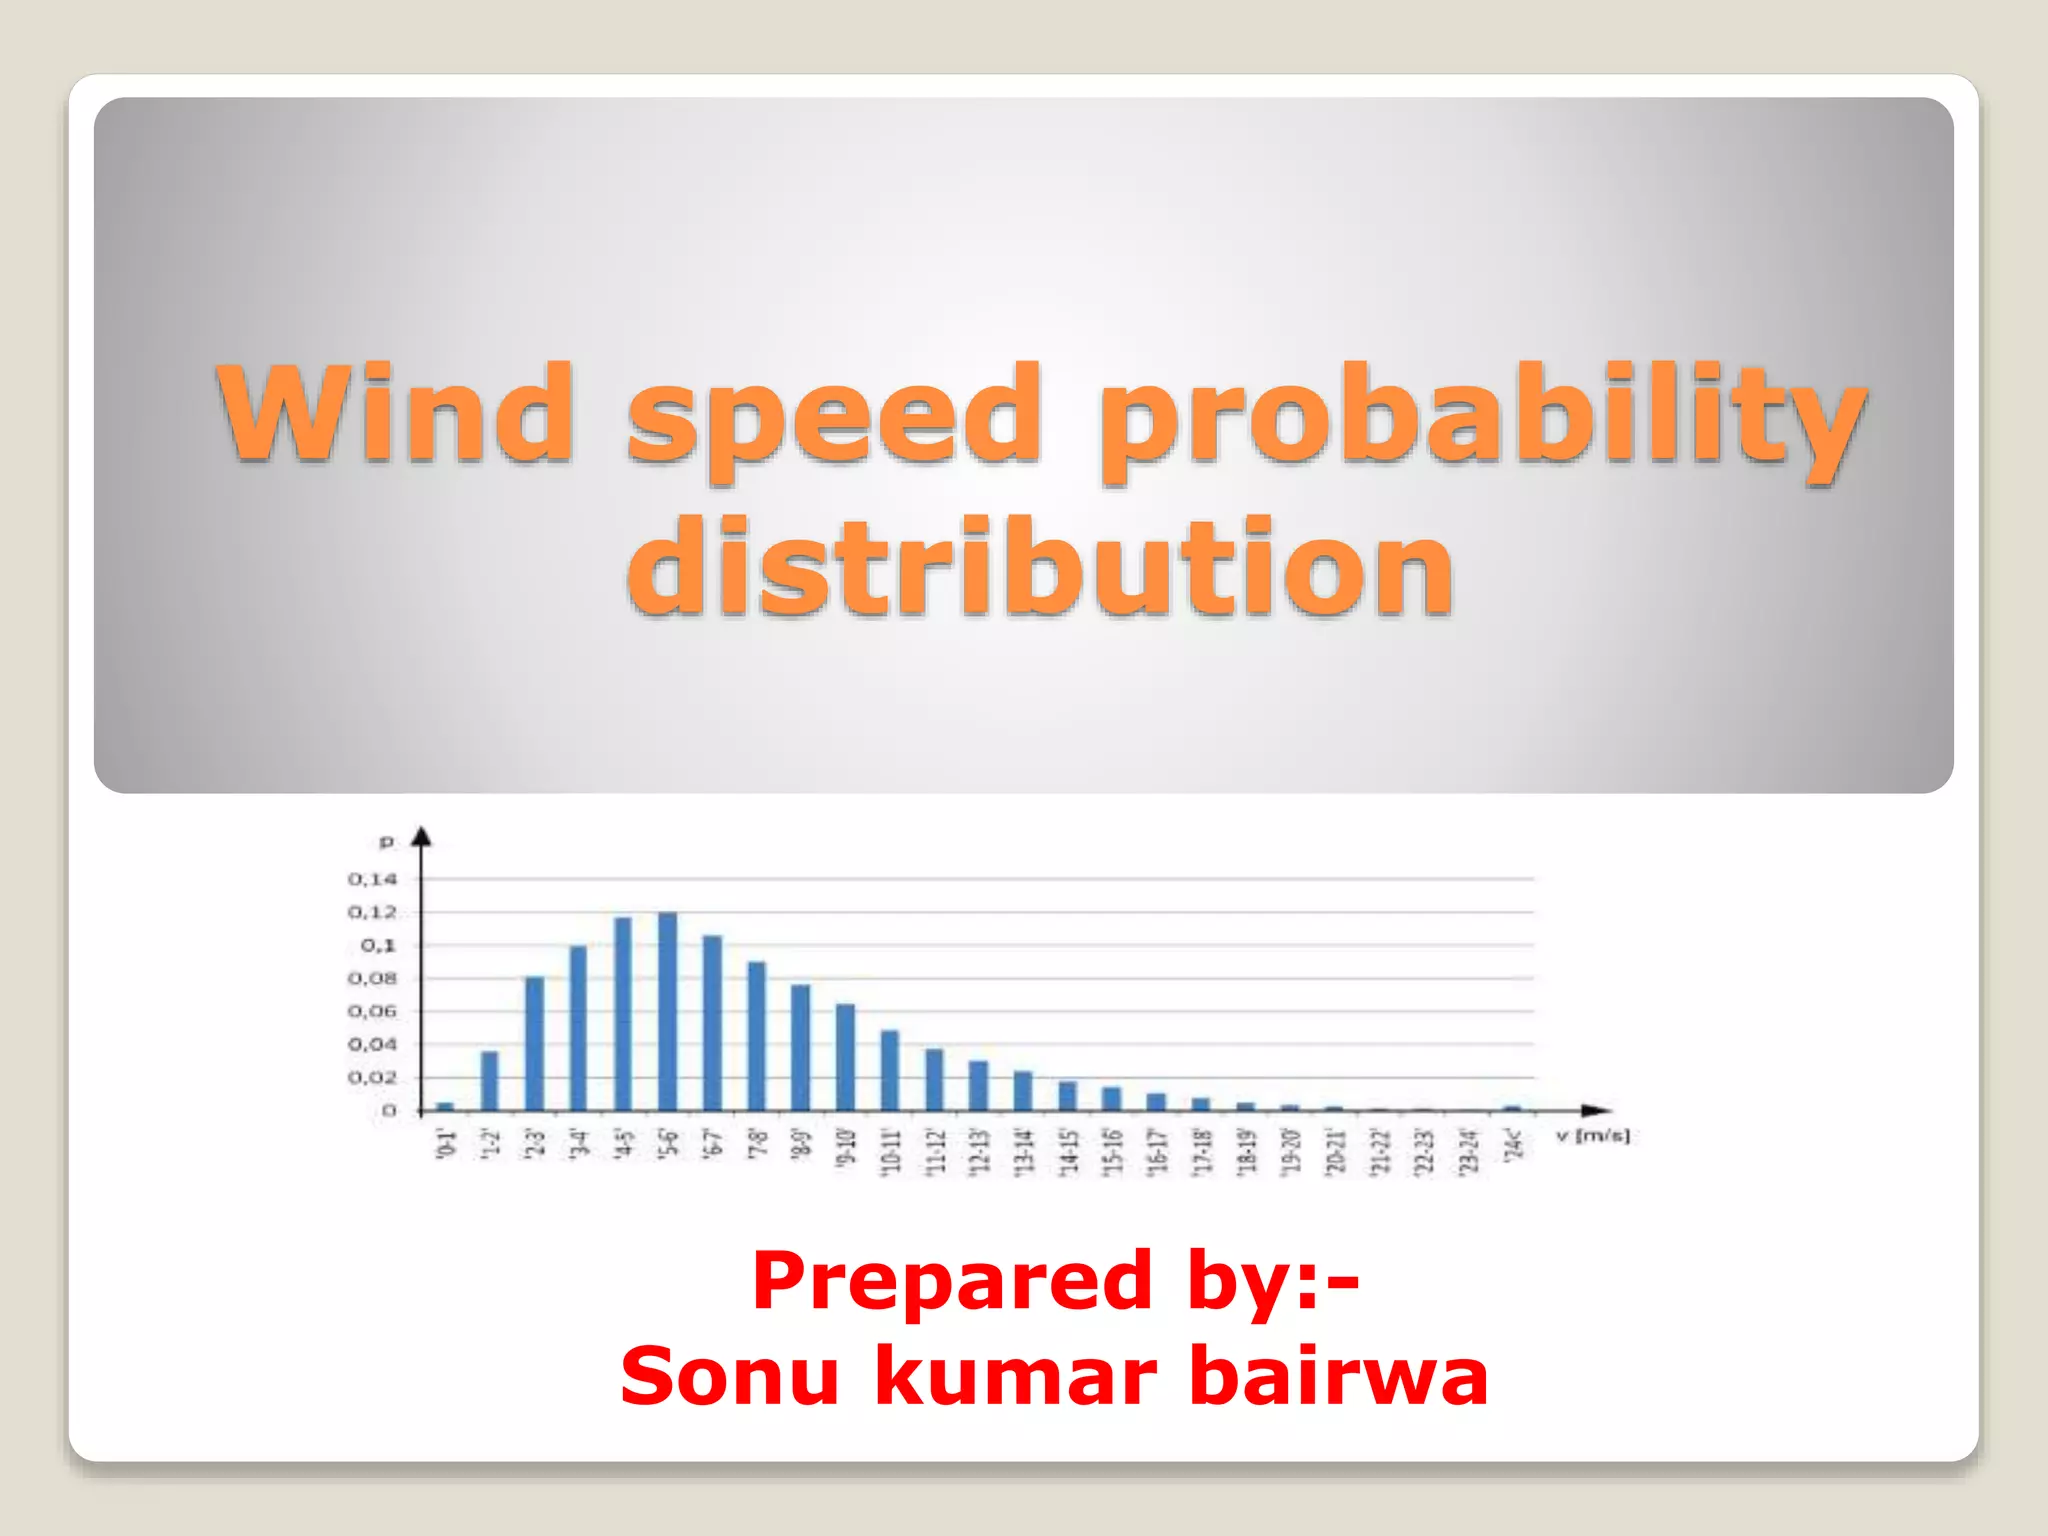
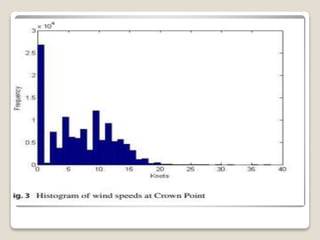
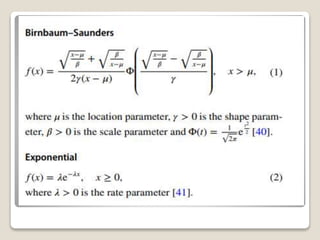
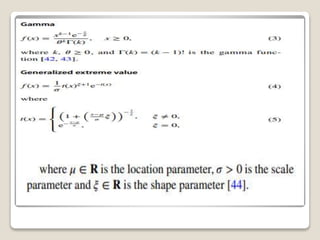
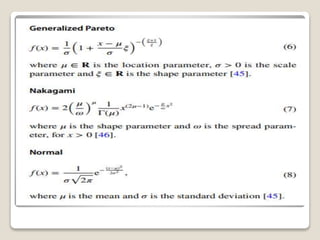
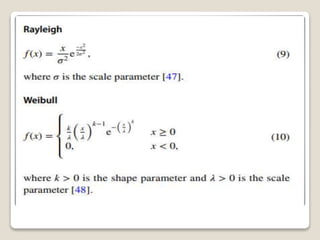
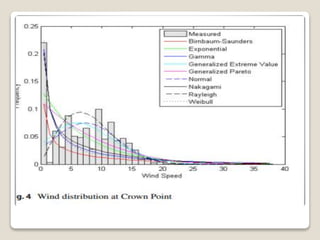
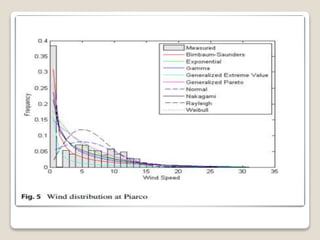


This document discusses different probability distributions that can be used to model wind speed data. It notes that the Weibull distribution is commonly used, but that other distributions like the generalized extreme value distribution, generalized Pareto distribution, Rayleigh distribution, autoregressive models, maximum entropy distributions, Nakagami distribution, normal distribution and exponential distribution have also been explored. The document aims to compare the performance of these distributions using goodness-of-fit tests and an application-specific information criteria method to identify the best distribution for wind energy applications. It then reviews the probability density functions for various candidate distributions considered.


