Download to read offline
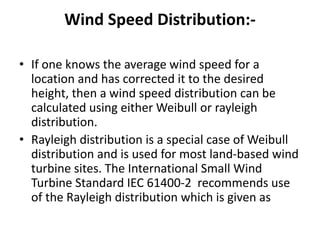
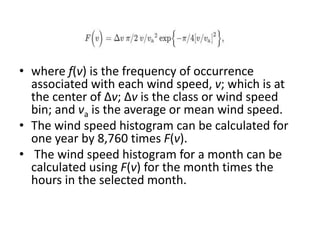
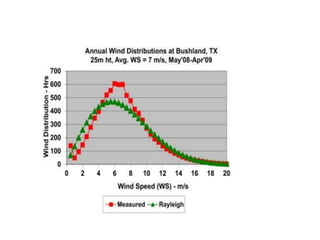
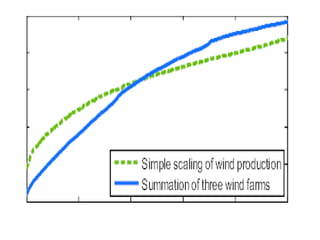
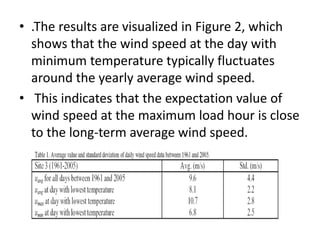


This document discusses wind energy statistics and the smoothing effect of combining power from multiple wind farms. It notes that a Rayleigh distribution is typically used to model wind speed at land-based wind turbine sites. While a single wind farm may have a 20% chance of zero power output, three combined wind farms reduce this to less than 5% due to smoothing. Maximum and minimum wind speeds on cold days are also analyzed and found to typically match long-term average wind speeds.


