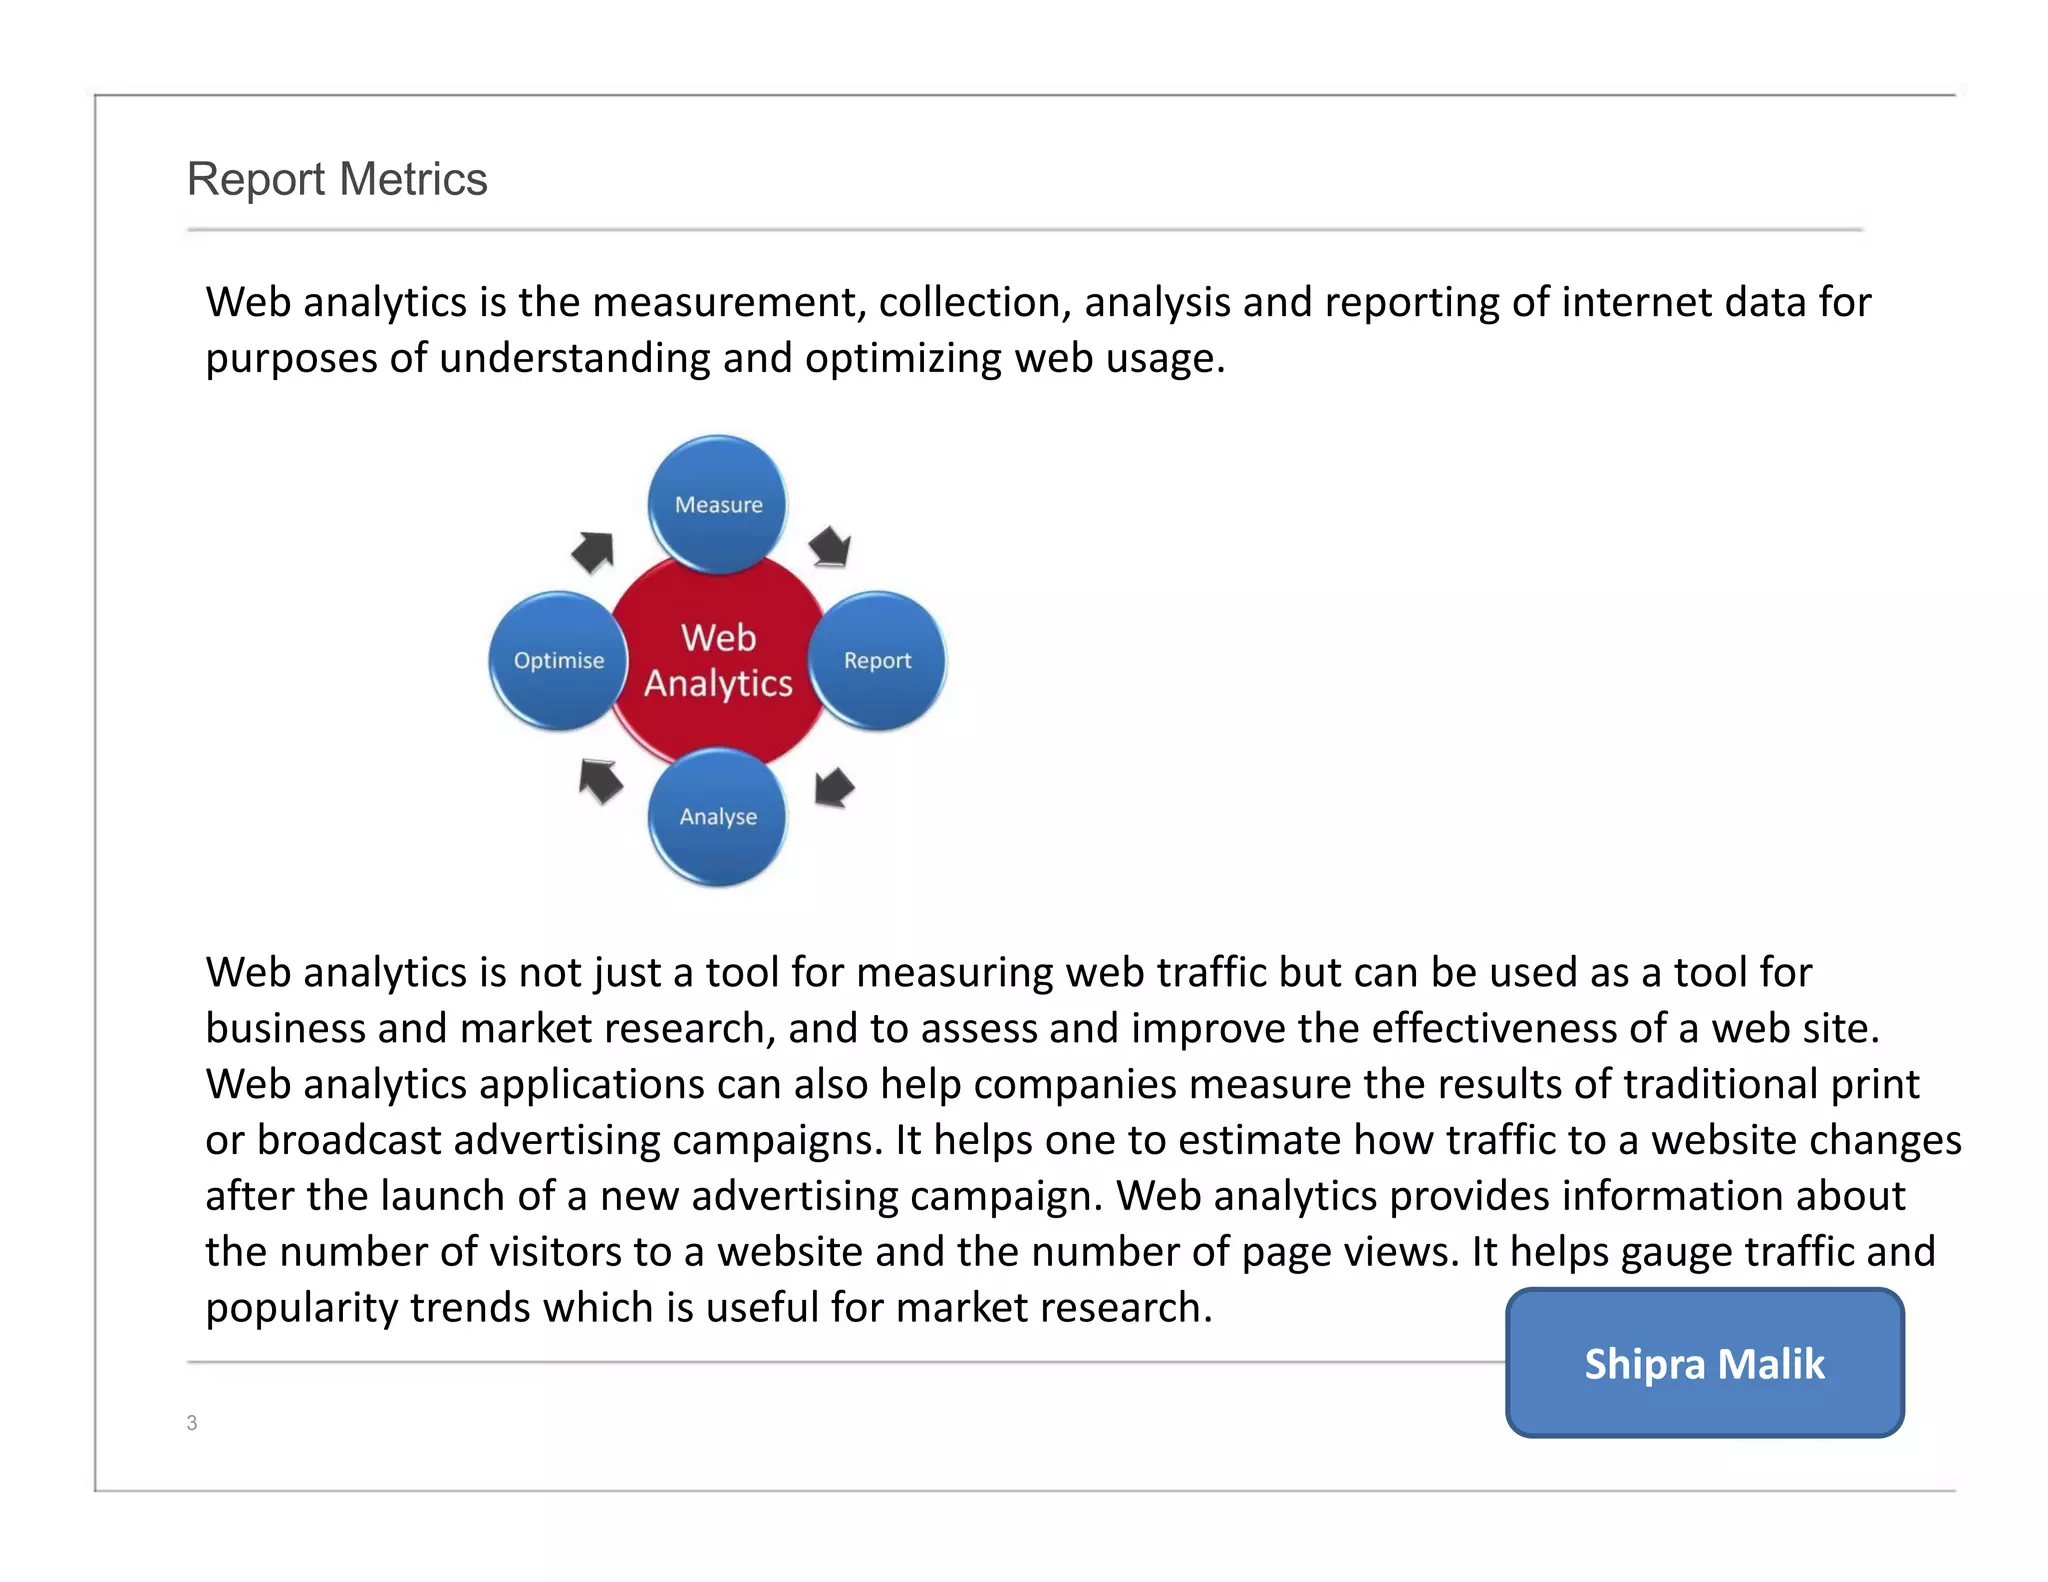
Web analytics involves measuring, collecting, analyzing, and reporting internet data to understand and optimize website usage. It can be used as a tool for business and market research as well as improving website effectiveness. Web analytics applications can also help measure the results of traditional advertising campaigns by estimating how traffic to a website changes after a new campaign launch. Key metrics include the number of visitors and page views, which provide information about traffic and popularity trends useful for market research.
This presentation accompanied a great talk on Web Analytics by Anne Marie Macek, Senior Manager in Data Strategy at Marriott International, at the DC Business Intelligentsia Meetup on December 11.
For more info on future events visit: http://www.meetup.com/BusinessIntelligentsiaDC/events/150884302/
an overview of data analytics techniques and technologies that is necessary for any digital marketer. for more information about digital marketing please contact: mnabizadeh@aut.ac.ir
A practical introduction to Web analytics for technical communicatorsSamartha Vashishtha
A solid foundation in Web analytics helps technical communicators prioritize and optimize content delivery. In this session, we will demonstrate how you can gain insight from the numbers you derive using Web analytics tools. We will discuss Web analytics terminology, tools, strategies, case studies, and techniques that you can start using as soon as you get back to work.
Teradata Integrated Web Intelligence captures detailed data from online behavior and integrates it with other interactive channels and enterprise data to turn your Enterprise Data Warehouse from Teradata into a powerful marketing tool. Now you can combine online data with traditional offline data in a single location to gain insights into customer behavior that increase the effectiveness and efficiency of your marketing spend across all channels.
For more information, visit www.teradata.com
Google Analytics is a web analytics service offered by Google that tracks and reports website traffic, currently as a platform inside the Google Marketing Platform brand.
Affiliate Summit Orlando Meetup Group: Google Analytics for BeginnersMissy Ward
Pat Grady, owner of RhinoFish Media (http://www.affiliatesummit.com/pat-grady/) provided a great session on Google Analytics for beginners, during the Affiliate Summit Orlando Meetup on Tuesday, 10/30/12. Here are his slides.
Google Analytics & Web Masters Tools - GBG MumbaiGBG Mumbai
Presentation from the Knowledge Series event - 'What gets measured, gets managed' a Workshop on Google Analytics & Webmasters tools. organised by Google Business Groups (GBG) Mumbai on Aug 31st 2013.
Speakers - Sreeraman Thiagarajan, Pareen Lathia and Vibhas Sen.
Visit gbgmumbai.org for more
Clickstream Data Warehouse - Turning clicks into customersAlbert Hui
As web is becoming a main channel for reaching customers and prospects, Clickstream data generated by websites has become another important enterprise data source, like other traditional business data sources, like store transactions, CRM data, call center’s logs etc. As simple as it sounds for recording every click a customer made, Clickstream data actually offers a wide range of opportunities for modelling user behaviour, gaining valuable customer insights. This is definitely a data source which has been under utilized. However, benefits also come with a problem. Amazon records 5 Billion clicks a day and the whole US generates 400 Billion clicks, equivalent to 3.4 Petabytes a day. This immense volume has given enterprises and their IT professionals a big data problem before they can fully utilize this insight-rich data source.
This presentation will use big data technology to help solve this big data problem; the presenter will explain everything about Clickstream data, like benefits, challenges and the solution. The end-to-end solution will include proposed data architecture, ETL, and various machine learning algorithms. A real world successful example will also be presented for audience to better grasp the concept and its applications. Sample codes and demo will also be presented for audience to apply in their respective areas.
• What is a web log?
• Where do they come from?
• Why are they relevant?
• How can we analyze them?
• What about Clickstream?
Facing these questions I have make a personal research, and realize a synthesis, which has help me to clarify some ideas. This presentation does not intend to be exhaustive on the subject, but could perhaps bring you some useful insights.
Webinar: AI and Machine Learning for Omnichannel RetailersLucidworks
Retailers pursuing the Omnichannel strategy now must deploy more advanced features to attract, retain, and service their most loyal customers. Advanced search, AI, and Machine Learning capabilities are core to helping retailers gain a competitive advantage.
This webinar will explore:
- Common uses of AI & ML in retail and future trends
- How to capture user intent
- Different types of recommendations and how they map to the customer journey
- Taking AI a step further for your retail site
December 11 saw the release of Kentico 11, jam packed with new features such as a Data Protection app, helping you with your General Data Protection Regulation (GDPR) compliance, an all-new Email Marketing solution, and a host of E-commerce features and third-party integrations. In this product launch webinar, Karol Jarkovsky, VP Product, and the rest of the Product Management team give an in-depth look at all the features of Kentico 11 .
Infosys expert viewpoint on Web Analytics Architecture to illustrate importance of web analytics for enterprise growth, various tools, and key players.
In today's information age, organizations have loads of data but only a small percentage of that data is being converted into information that results in actionable knowledge for the decision makers. In the attached presentation I have tried to define the process of Data, Information, Knowledge, and Decision/Action. The process is defined based on an online marketing business.
This presentation covers methods to set up Google Analytics on your website. It also includes basic terminologies / jargons / concepts that are used throughout Google Analytics
This presentation was given during the EuroIA 2009, by Adam Cox and Martijn Klompenhouwer. It is and edited version. The images used during the actual presentation have since been removed to make sure no copyrights are being violated. As a result, the examples of combining Web Analytics and User Research are just listed and are without explanations.
WEB Analytics - Data Mining - MIS - eBusiness website Jyotindra Zaveri
Measure your site's performance - Analytics, Insights, Statistics - WEB mining - learn about website visitors in the internet - slides shows example of Analytic reports, also called Insights or Stats, YouTube insights, Blogger Blog Stats, facebook, LinkedIn - presentation by Prof Jyoti Zaveri
Use cases and examples using Apache Spark, presented at the Hadoop User Group (UK) November 2014 Hadoop Meetup
http://www.meetup.com/hadoop-users-group-uk/events/217791892/
(GAM301) Real-Time Game Analytics with Amazon Kinesis, Amazon Redshift, and A...Amazon Web Services
Success in free-to-play gaming requires knowing what your players love most. The faster you can respond to players' behavior, the better your chances of success. Learn how mobile game company GREE, with over 150 million users worldwide, built a real-time analytics pipeline for their games using Amazon Kinesis, Amazon Redshift, and Amazon DynamoDB. They walk through their analytics architecture, the choices they made, the challenges they overcame, and the benefits they gained. Also hear how GREE migrated to the new system while keeping their games running and collecting metrics.
Why use big data tools to do web analytics? And how to do it using Snowplow a...yalisassoon
There are a number of mature web analytics products that have been on the market for ~20 years. Big data tools have only really taken off in the last 5 years. So why use big data tools mine web analytics data?
In this presentation, I explore the limitations of traditional approaches to web analytics, and explain how big data tools can be used to address those limitations and drive more value from the underlying data. I explain how a combination of Snowplow and Qubole can be used to do this in practice
Building an Effective Data Warehouse ArchitectureJames Serra
Why use a data warehouse? What is the best methodology to use when creating a data warehouse? Should I use a normalized or dimensional approach? What is the difference between the Kimball and Inmon methodologies? Does the new Tabular model in SQL Server 2012 change things? What is the difference between a data warehouse and a data mart? Is there hardware that is optimized for a data warehouse? What if I have a ton of data? During this session James will help you to answer these questions.
To know more about web analytics and internet marketing log on to:
http://www.iexpertsforum.com/smf/index.php
Web analytics is the measurement, collection, analysis and reporting of internet data for purposes of understanding and optimizing web usage.
To assess the performance and to improve your website , it is imperative that you understand the key performance indicators of your site like the traffic, hits, and many more concepts.
Web analytics help you in having a thorough analysis, of how your site is performing which helps you to optimize your site to suit your needs as well as your customer's and clients.
Drive Your Businesswith Google AnalyticsSean Clark
A guide to using Google Analytics to drive business decisions
Learning outcomes
Use and interpret reports to measure what visitors are doing on your site and where they come from
Defining the purpose of your website to be able to identify quality traffic and drivers of conversions to sales or other business objectives
Track ad campaigns, search (paid and non-paid), email, social
Extract information from analytics to suggest website performance improvements
Understanding where analytics fits into your marketing
Basic understanding of Terminology
Structure
Accounts, Profiles and Users
Terminology
Navigating reports helping you find your way around Google Analytics
How to use and interpret reports
The dashboard and custom reports
How to identify quality traffic
Campaign tracking for AdWords, social, e-mail and other marketing
This is a short introduction to web analytics. It goes over the different types of web analytics, sources from which analytics information can be gathered, why its essential, key analytics metrics and its usage. It also covers different products in this space, its generic architecture and the key parameters which can be used for evaluating different products. It concludes by highlighting some of the limitations of web analytics today.
I delivered this presentation to MSc Digital Marketing class of "The UCD Michael Smurfit Graduate Business School - University College Dublin" in February 2015.
The presentation covers some basics and fundamental information about Google Analytics.
Google Analytics: understanding the data correctlyPromodo
Main points of the webinar:
1) Introduction of Google Analytics, understanding the data correctly: goals, e-commerce, principal metrics (visits/pageviews, sources of traffic), webmaster tools integration
2) Google Analytics advanced segments setting, and Top 8 of the most useful custom reports and how to set them:
• Not Provided
• Branded vs non-branded traffic
• Visits with transactions
• Most profitable sources of traffic
• Funnel visualizations, drop-offs
• Bounce rate, it’s correct interpretation
• Mobile traffic
• 404 errors
Google analytic best website performance checker tool, get complete guide information on website with Google analytics tool for better results and for complete check on information.
Digital Marketing Course Week 4: Digital AnalyticsAyca Turhan
Fourth week slides of eMarketing Course at Hacettepe University taught by Ayca Turhan.
Topics covered within the presentation include:
Digital Analytics
Conversion Optimization
Testing
Google Analytics Examples
For more please visit: www.aycaturhan.com/man423
Measuring Digital marketing - ROI & KPIsAnkur Garg
My guest lecture at UC Berkeley, discussing the subject of measuring Digital Marketing efforts. The steps included identifying right metrics/KPIs and building campaigns with high ROI metrics.
role of women and girls in various terror groupssadiakorobi2
Women have three distinct types of involvement: direct involvement in terrorist acts; enabling of others to commit such acts; and facilitating the disengagement of others from violent or extremist groups.
हम आग्रह करते हैं कि जो भी सत्ता में आए, वह संविधान का पालन करे, उसकी रक्षा करे और उसे बनाए रखे।" प्रस्ताव में कुल तीन प्रमुख हस्तक्षेप और उनके तंत्र भी प्रस्तुत किए गए। पहला हस्तक्षेप स्वतंत्र मीडिया को प्रोत्साहित करके, वास्तविकता पर आधारित काउंटर नैरेटिव का निर्माण करके और सत्तारूढ़ सरकार द्वारा नियोजित मनोवैज्ञानिक हेरफेर की रणनीति का मुकाबला करके लोगों द्वारा निर्धारित कथा को बनाए रखना और उस पर कार्यकरना था।
In a May 9, 2024 paper, Juri Opitz from the University of Zurich, along with Shira Wein and Nathan Schneider form Georgetown University, discussed the importance of linguistic expertise in natural language processing (NLP) in an era dominated by large language models (LLMs).
The authors explained that while machine translation (MT) previously relied heavily on linguists, the landscape has shifted. “Linguistics is no longer front and center in the way we build NLP systems,” they said. With the emergence of LLMs, which can generate fluent text without the need for specialized modules to handle grammar or semantic coherence, the need for linguistic expertise in NLP is being questioned.
01062024_First India Newspaper Jaipur.pdfFIRST INDIA
Find Latest India News and Breaking News these days from India on Politics, Business, Entertainment, Technology, Sports, Lifestyle and Coronavirus News in India and the world over that you can't miss. For real time update Visit our social media handle. Read First India NewsPaper in your morning replace. Visit First India.
CLICK:- https://firstindia.co.in/
#First_India_NewsPaper
03062024_First India Newspaper Jaipur.pdfFIRST INDIA
Find Latest India News and Breaking News these days from India on Politics, Business, Entertainment, Technology, Sports, Lifestyle and Coronavirus News in India and the world over that you can't miss. For real time update Visit our social media handle. Read First India NewsPaper in your morning replace. Visit First India.
CLICK:- https://firstindia.co.in/
#First_India_NewsPaper
‘वोटर्स विल मस्ट प्रीवेल’ (मतदाताओं को जीतना होगा) अभियान द्वारा जारी हेल्पलाइन नंबर, 4 जून को सुबह 7 बजे से दोपहर 12 बजे तक मतगणना प्रक्रिया में कहीं भी किसी भी तरह के उल्लंघन की रिपोर्ट करने के लिए खुला रहेगा।
31052024_First India Newspaper Jaipur.pdfFIRST INDIA
Find Latest India News and Breaking News these days from India on Politics, Business, Entertainment, Technology, Sports, Lifestyle and Coronavirus News in India and the world over that you can't miss. For real time update Visit our social media handle. Read First India NewsPaper in your morning replace. Visit First India.
CLICK:- https://firstindia.co.in/
#First_India_NewsPaper
2. Report Metrics
3
Web analytics is the measurement, collection, analysis and reporting of internet data for
purposes of understanding and optimizing web usage.
Web analytics is not just a tool for measuring web traffic but can be used as a tool for
business and market research, and to assess and improve the effectiveness of a web site.
Web analytics applications can also help companies measure the results of traditional print
or broadcast advertising campaigns. It helps one to estimate how traffic to a website changes
after the launch of a new advertising campaign. Web analytics provides information about
the number of visitors to a website and the number of page views. It helps gauge traffic and
popularity trends which is useful for market research.
Shipra Malik
4. 5. KEY CONCEPTS
• METRICS: "The columns" "The units". The actual count for a selected KPI
• KPIs: Key Performance Indicators - the important business measures for your
site e.g. Test Drives, Leads, BP
CORE METRICS
• VISITORS: person (IP Address) coming to the website
• VISITS: How many times has that visitor visited your website
• PAGE VIEWS/INSTANCES: counts the number of times an action occurred
Visitor
Visit Visit
VisitPage Page Page
View View View
Page Page Page
View View View
Page
View
Page
View
14
Shipra Malik
6. Web Analytics: Goals, Metrics, KPIs, Dimensions, Targets
3
"What is the difference between a metric and a key performance indicator (KPI)?"
"What is a dimension in analytics?"
"What is segmentation?"
"Are goals metrics?"
And many more.
There seems to be genuine confusion about the simplest, most foundational, parts of web
metrics / analytics.
Source: Web Analytics 101
Shipra Malik
7. Web Analytics 101: Definitions: Goals, Metrics, KPIs, Dimensions, Targets
3
Business Objectives:
This is the answer to the question: "Why does your website exist?"
Or: "What are you hoping to accomplish for your business by being on the web?"
Or: "What are the three most important priorities for your site?"
Or other questions like that.
Without a clearly defined list of business objectives you are doomed, because if you don't
know where you are going then any road will take you there.
The objectives must be DUMB: Doable. Understandable. Manageable. Beneficial.
progress objectives directions90% of the failures in web analytics, the reasons companies are
data rich and information poor, is because they don't have DUMB objectives.
Shipra Malik
8. Web Analytics 101: Definitions: Goals, Metrics, KPIs, Dimensions, Targets
3
Goals:
Goals are specific strategies you'll leverage to accomplish your business objectives.
Business objectives can be quite strategic and high level. Sell more stuff. Create happy
customers. Improve marketing effectiveness.
Sell more stuff really means we have to:
1. do x 2. improve y 3. reduce z
Improve marketing effectiveness might translate into these goals because currently they are
our priorities:
1. identify broken things in m
2. figure out how to do n
3. experiment with p type of campaigns
Shipra Malik
9. Web Analytics 101: Definitions: Goals, Metrics, KPIs, Dimensions, Targets
3
Metric:
A metric is a number.
That is the simplest way to think about it.
Technically a metric can be a Count (a total) or a Ratio (a division of one number by another).
Examples of metrics that are a Count is Visits or Pageviews.
Metrics form the
life blood of all the
measurement we
do. They are the
reason we call the
web the most
accountable
channel on the
planet.
Shipra Malik
10. Web Analytics 101: Definitions: Goals, Metrics, KPIs, Dimensions, Targets
3
Key Performance Indicator:
Key performance indicators (KPI's) are metrics. But not normal metrics. They are our BFF's.
A key performance indicator (KPI) is a metric that helps you understand how you are doing
against your objectives.
That last word – objectives – is critical to something being called a KPI, which is also why KPI's
tend to be unique to each company.
For example, I run www.buyproducts.com. My business objective is to sell lots of stuff. My
web analytics KPI is: Average Order Size.
Business objective: Sell Stuff. KPI: Average Order Size.
I might use other metrics in my reports, say Visits or # of Videos Watched or whatever. But
they won't be my KPI's.
Business Objectives -> Goals -> KPI's -> Metrics -> Magic.
Shipra Malik
11. Web Analytics 101: Definitions: Goals, Metrics, KPIs, Dimensions, Targets
3
Targets:
Targets are numerical values you have pre-determined as indicators success or failure.
It is rare, even with the best intentions, that you'll create targets for all the metrics you'll
report on.
Yet it is critical that you create targets for each web analytics key performance indicator.
Shipra Malik
12. Web Analytics 101: Definitions: Goals, Metrics, KPIs, Dimensions, Targets
3
Dimension:
A dimension is, typically, an attribute of the Visitor to your website.
Here's a simplistic pictorial representation. . .
Shipra Malik
13. Web Analytics 101: Definitions: Goals, Metrics, KPIs, Dimensions, Targets
3
The source that someone came from (referring urls, campaigns, countries etc) is a dimension
in your web analytics data.
So is technical information like browsers or mobile phones or (god save you if you are still
doing daily reports on) screen resolution or ISP used.
The activity a person performed such as the landing page name, the subsequent pages they
saw, videos they played, searches they did on your website and the products they purchased
are all dimensions.
Finally the day they visited, the days since their last visit (if returning visitor) the number of
visits they made, the number of pages they saw are all dimensions as well. I know, they
sound like metrics. But they are, as the definition says up top, attributes of the visitor and
their activity on your website.
This is a crude way to think about it but… Dimensions almost always appear in rows in a
report / excel spreadsheet.
Shipra Malik
14. Web Analytics 101: Definitions: Goals, Metrics, KPIs, Dimensions, Targets
3
Dimensions allow you to group your data into different buckets and they are most
frequently used to slice and dice the web analytics data.
Shipra Malik
15. Web Analytics 101: Definitions: Goals, Metrics, KPIs, Dimensions, Targets
3
Segments:
A segment contains a group of rows from one or more dimensions.
In aggregate almost all data is useless (like # of Visits). The best way to find insights is to
segment the data using one or more dimensions (like # of Visits from: USA, UK, India as a %
of All Visits).
You segment by dimensions and report by metrics.
Shipra Malik
18. Report Metrics
3
Building Block Terms
Page
Type: Dimension
Calculation: An analyst definable unit of content.
Page View
Type: Count
Calculation: The number of times a page was viewed.
Visits (Sessions)
Type: Count
Calculation : A sequence of page views in a sitting. The visits metric is commonly used in
reports that display the number of user sessions within the selected time period.
The Visits Report measures traffic to your site by counting the number of sessions in a
given time period. You can use this report to observe traffic patterns, or to identify
impact of site modifications made on your site.
Shipra Malik
19. Report Metrics
3
Unique Visitors
Type: Count
Calculation: The number of inferred individual people (filtered for spiders and robots),
within a designated reporting timeframe, with activity consisting of one or more visits to
a site. Each individual is counted only once in the unique visitor measure for the
reporting period.
New Visitor
Type: Count
Calculation: The number of Unique Visitors with activity including a first-ever Visit to a
site during a reporting period. Note that "first-ever" is with respect to when data began
being properly collected on your site by your current tool.
Return(ing) Visitor
Type: Count
Calculation: The number of Unique Visitors with activity consisting of a Visit to a site
during a reporting period and where the Unique Visitor also Visited the site prior to the
reporting period.
Shipra Malik
20. Report Metrics
3
Repeat Visitor
Type: Count
Calculation: The number of Unique Visitors with activity consisting of two or more Visits
to a site during a reporting period.
Visit Characterization
Entry Page
Type: Dimension
Calculation: The Entry Pages report shows you which pages on your site were the first
page of a visit. You can use this report to identify which of your web pages are the most
frequent points of entry or to optimize the primary entry points on your site.
Landing Page
Type: Dimension
Calculation: A page view intended to identify the beginning of the user experience
resulting from a defined marketing effort.
Shipra Malik
21. Report Metrics
3
Exit Page
Type: Dimension
Calculation: The last page on a site accessed during a visit, signifying the end of a
visit/session.
Visit Duration
Type: Count
Calculation: The length of time in a session. Calculation is typically the timestamp of the
last activity in the session minus the timestamp of the first activity of the session.
Traffic Sources: The Referrer Type report takes all referring traffic to your site and categorizes
them based on domain. This report can be helpful in determining which general methods
users are accessing your site. Using Marketing Channels may be better in obtaining this
information, however the Referrer Type report takes much less configuration in order to work
properly.
Referrer
Type: Dimension
Calculation: Referrer is a generic term that describes the source of traffic to a page or visit.
Shipra Malik
22. Report Metrics
3
Exit Page
Type: Dimension
Calculation: The last page on a site accessed during a visit, signifying the end of a
visit/session.
Visit Duration
Type: Count
Calculation: The length of time in a session. Calculation is typically the timestamp of the
last activity in the session minus the timestamp of the first activity of the session.
Traffic Sources: The Referrer Type report takes all referring traffic to your site and categorizes
them based on domain. This report can be helpful in determining which general methods
users are accessing your site. Using Marketing Channels may be better in obtaining this
information, however the Referrer Type report takes much less configuration in order to work
properly.
Referrer
Type: Dimension
Calculation: Referrer is a generic term that describes the source of traffic to a page or visit.
Shipra Malik
23. Report Metrics
3
• Internal Referrer - The internal referrer is a page URL that is internal to the web site or a
web-property within the web site as defined by the user. Not all tools report internal
referrers as a group.
• External Referrer - The external referrer is a page URL where the traffic is external or
outside of the web site or a web-property defined by the user.
• Search Referrer - The search referrer is an internal or external referrer for which the URL
has been generated by a search function. Many tools segment and report on search
referrers as a group; however the exact definitions vary from tool to tool. Most will
include the "big" search engines, such as Yahoo, Google, and MSN/Live. However, they
vary in whether or not they exclude mail servers from these sources, or whether they use
wildcards to capture any URL containing the word "search.“
Click-through
Type: Count
Calculation: Number of times a link was clicked by a visitor.
Shipra Malik
24. Report Metrics
3
Click-through Rate/Ratio
Type: Ratio
Calculation: The number of click-throughs for a specific link divided by the number of
times that link was viewed.
Page Views per Visit
Type: Ratio
Universe: Aggregate, Segmented, Individual
Calculation: The number of page views in a reporting period divided by number of visits
in the same reporting period.
Content Characterization
Page Exit Ratio
Type: Ratio
Calculation: Number of exits from a page divided by total number of page views of that
page.
Shipra Malik
25. Report Metrics
3
Single Page Visits (Bounces)
Type: Dimension or Count
Calculation: A visit that consists of one page view.
Bounce Rate
Type: Ratio
Calculation: Single page visits divided by entry pages.
Conversion Metrics
Conversion terms record special activities on a site, such
as purchases, that have particular business value for the analyst.
They often represent the bottom-line “success” for a visit.
Event
Type: Dimension and/or Count
Calculation: Any logged or recorded action that has a specific date and time assigned to
it by either the browser or server.
Shipra Malik
26. Report Metrics
3
Conversion
Type: Dimension or Count
Calculation: The number of times a desired outcome was accomplished.
Because a Conversion can be both a metric and a count, a web analytics report may show
“number of conversions,” “number of purchases,” “number of sign-ups,” etc. (conversion as a
count), or it may show specific conversions and how many events, page views, visits, or
unique visitors were associated with the conversion (conversion as a dimension).
Conversion Rate
Type: Ratio
Calculation: The ratio of conversions over a relevant denominator.
Shipra Malik
27. Report Metrics (SiteCatalyst)
3
• Keywords: The Search Keywords reports show the search keywords (or search phrases) that
customers used to arrive at your site, and how those customers affected your site’s Success Metrics.
This can help you determine how to better tailor your site code, such as META tags, or which
keywords to register with search engines. You can see if certain keywords resulted in more orders or
if other keywords caused higher instances of cart additions
• Top Pages: The Pages report ranks the pages on your site based on those that receive the most
traffic. By default, pages are ranked by the number of times they were viewed, with the pages
receiving the most page views listed first. You can use this report to view which pages associated
with products users are most interested in, measure pages in their effectiveness to conversion
events, or to simply view all page traffic in a single easy-to-read report.
• Top Banner ID’s: There are several common ways to track internal campaigns (such as banner ads
that lead to other portions of your site) in SiteCatalyst. Each method uses an eVar, which by nature
can associate conversion beyond the page it was defined on.
• File Downloads: The SiteCatalyst File Downloads Report helps you understand how often your
visitors download files from your site. Examples of file downloads may be word processor
documents, spreadsheets, audio files, movie files, user manuals, etc. This includes both files being
saved and opened directly from the browser, as well as files saved to the user's computer. The report
shows the name of the file being downloaded, including the complete URL required to access the
file.
Shipra Malik