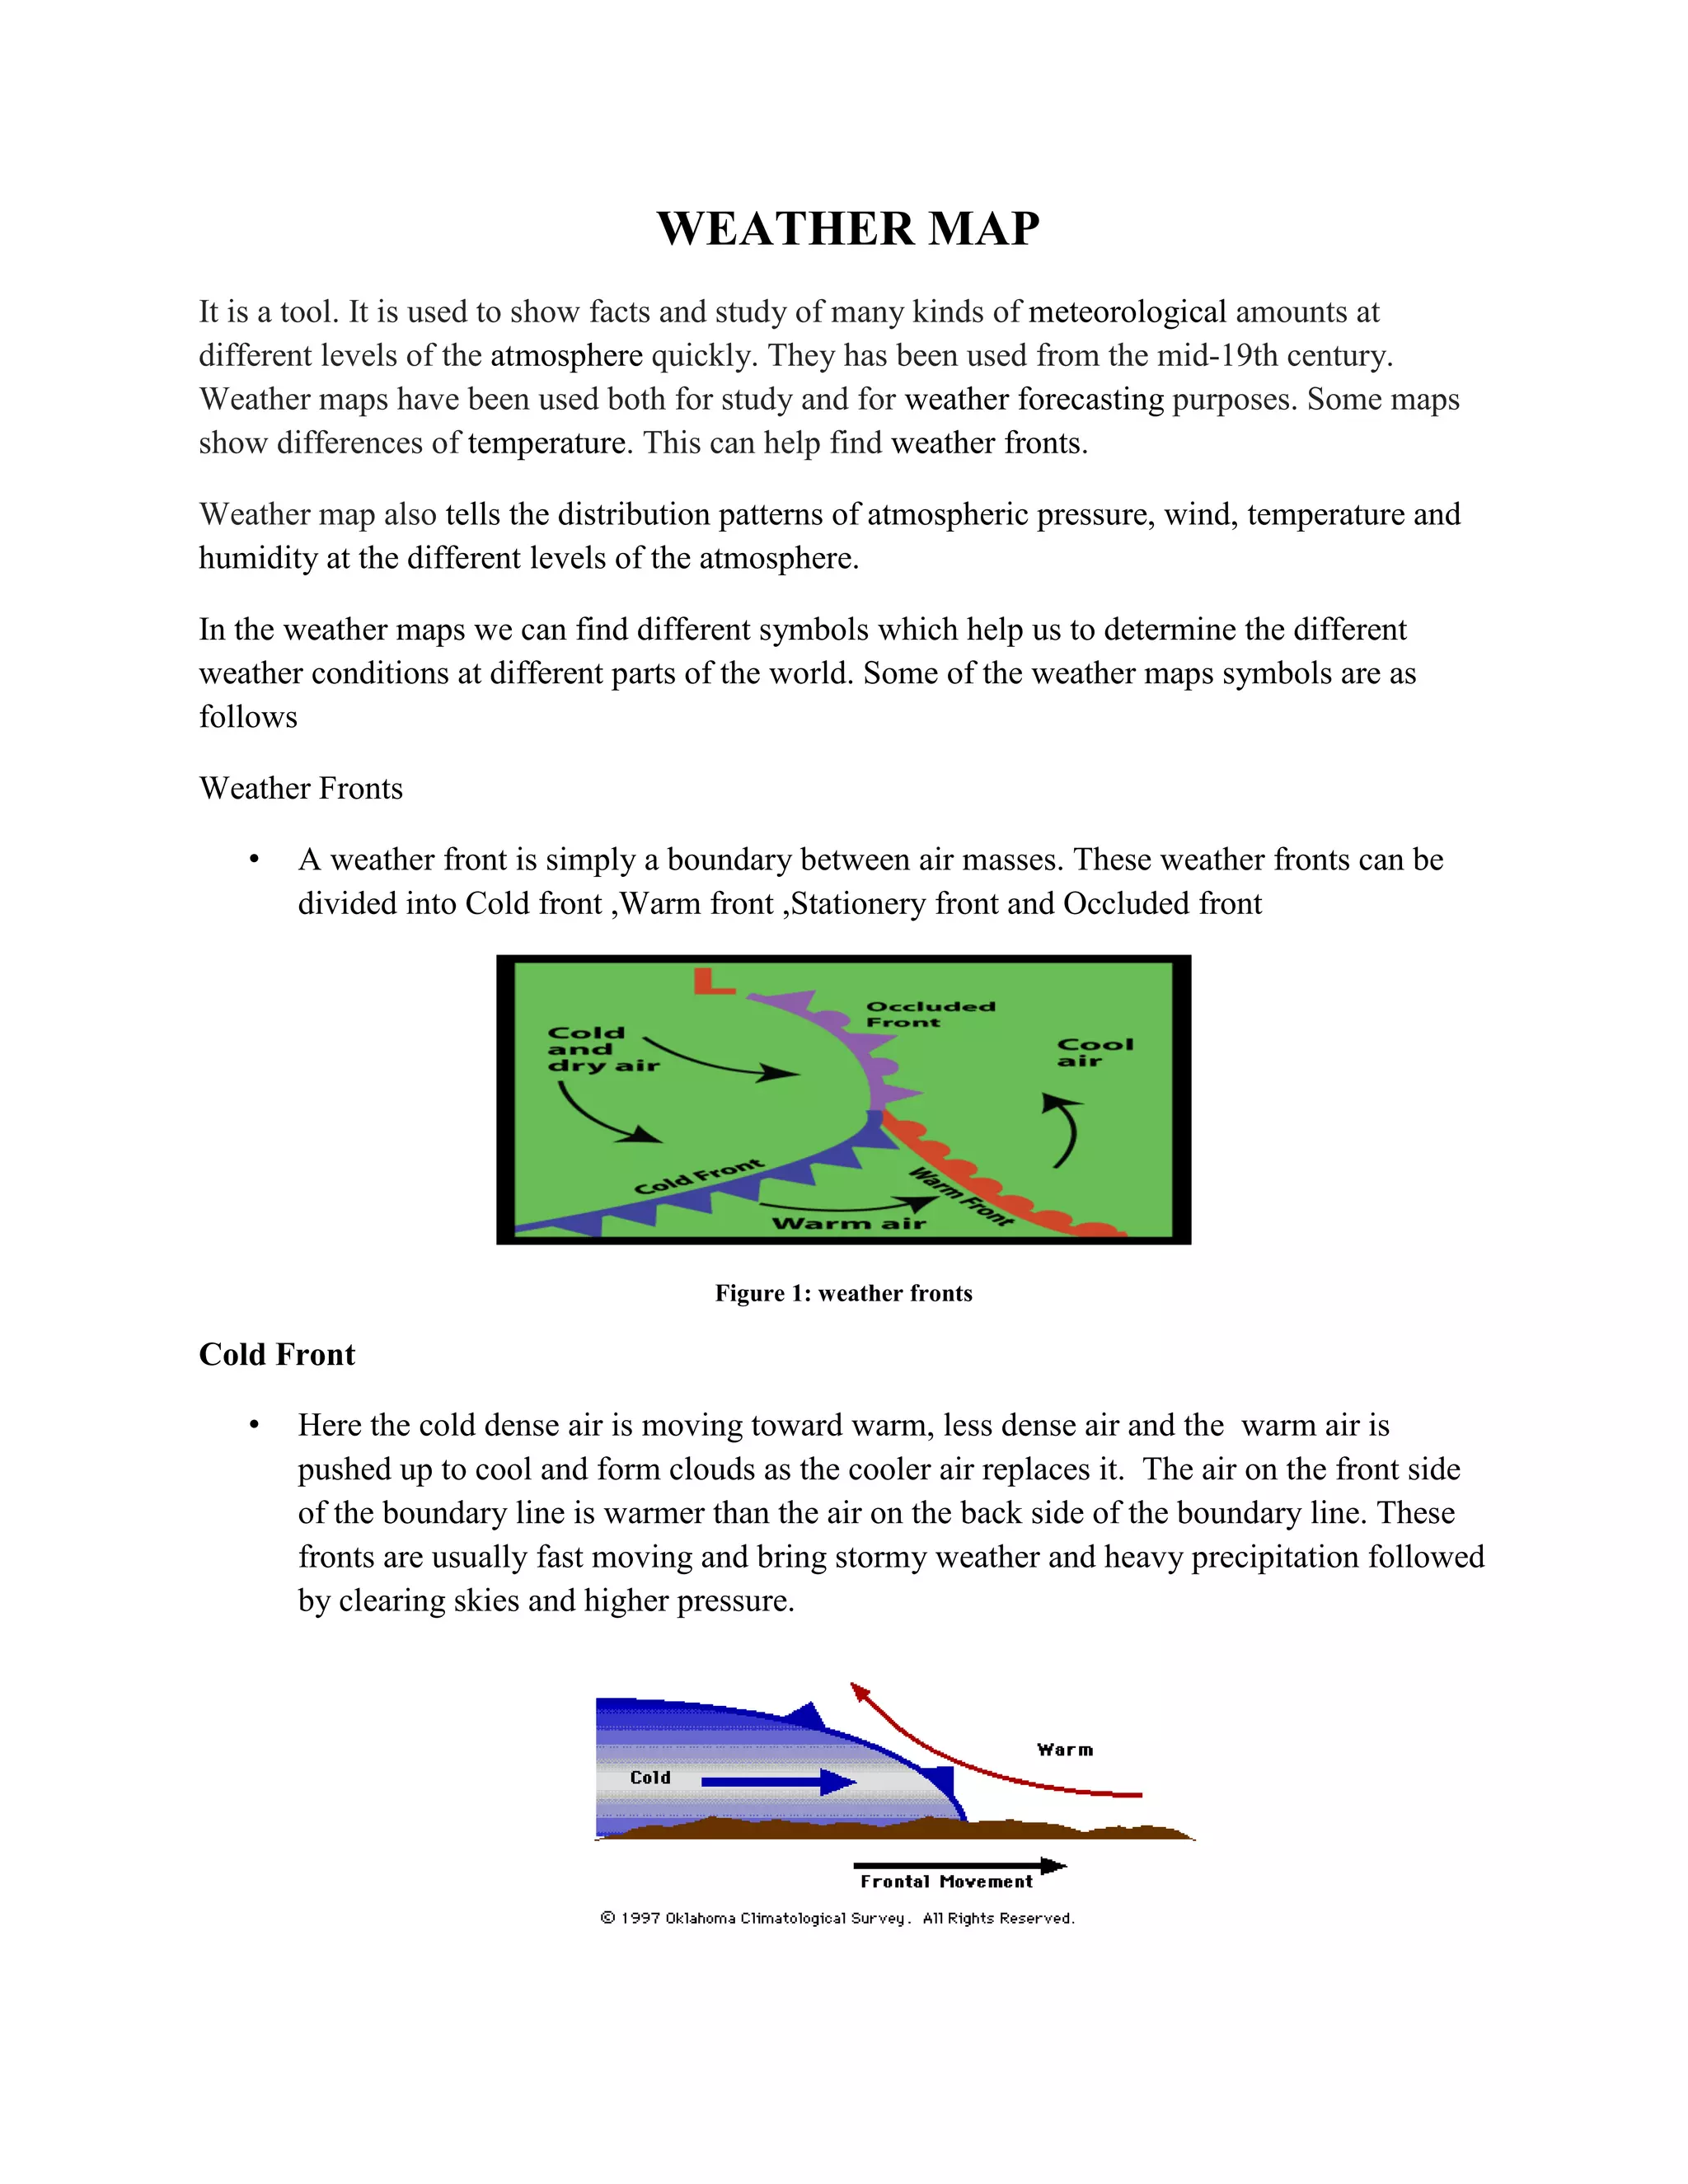
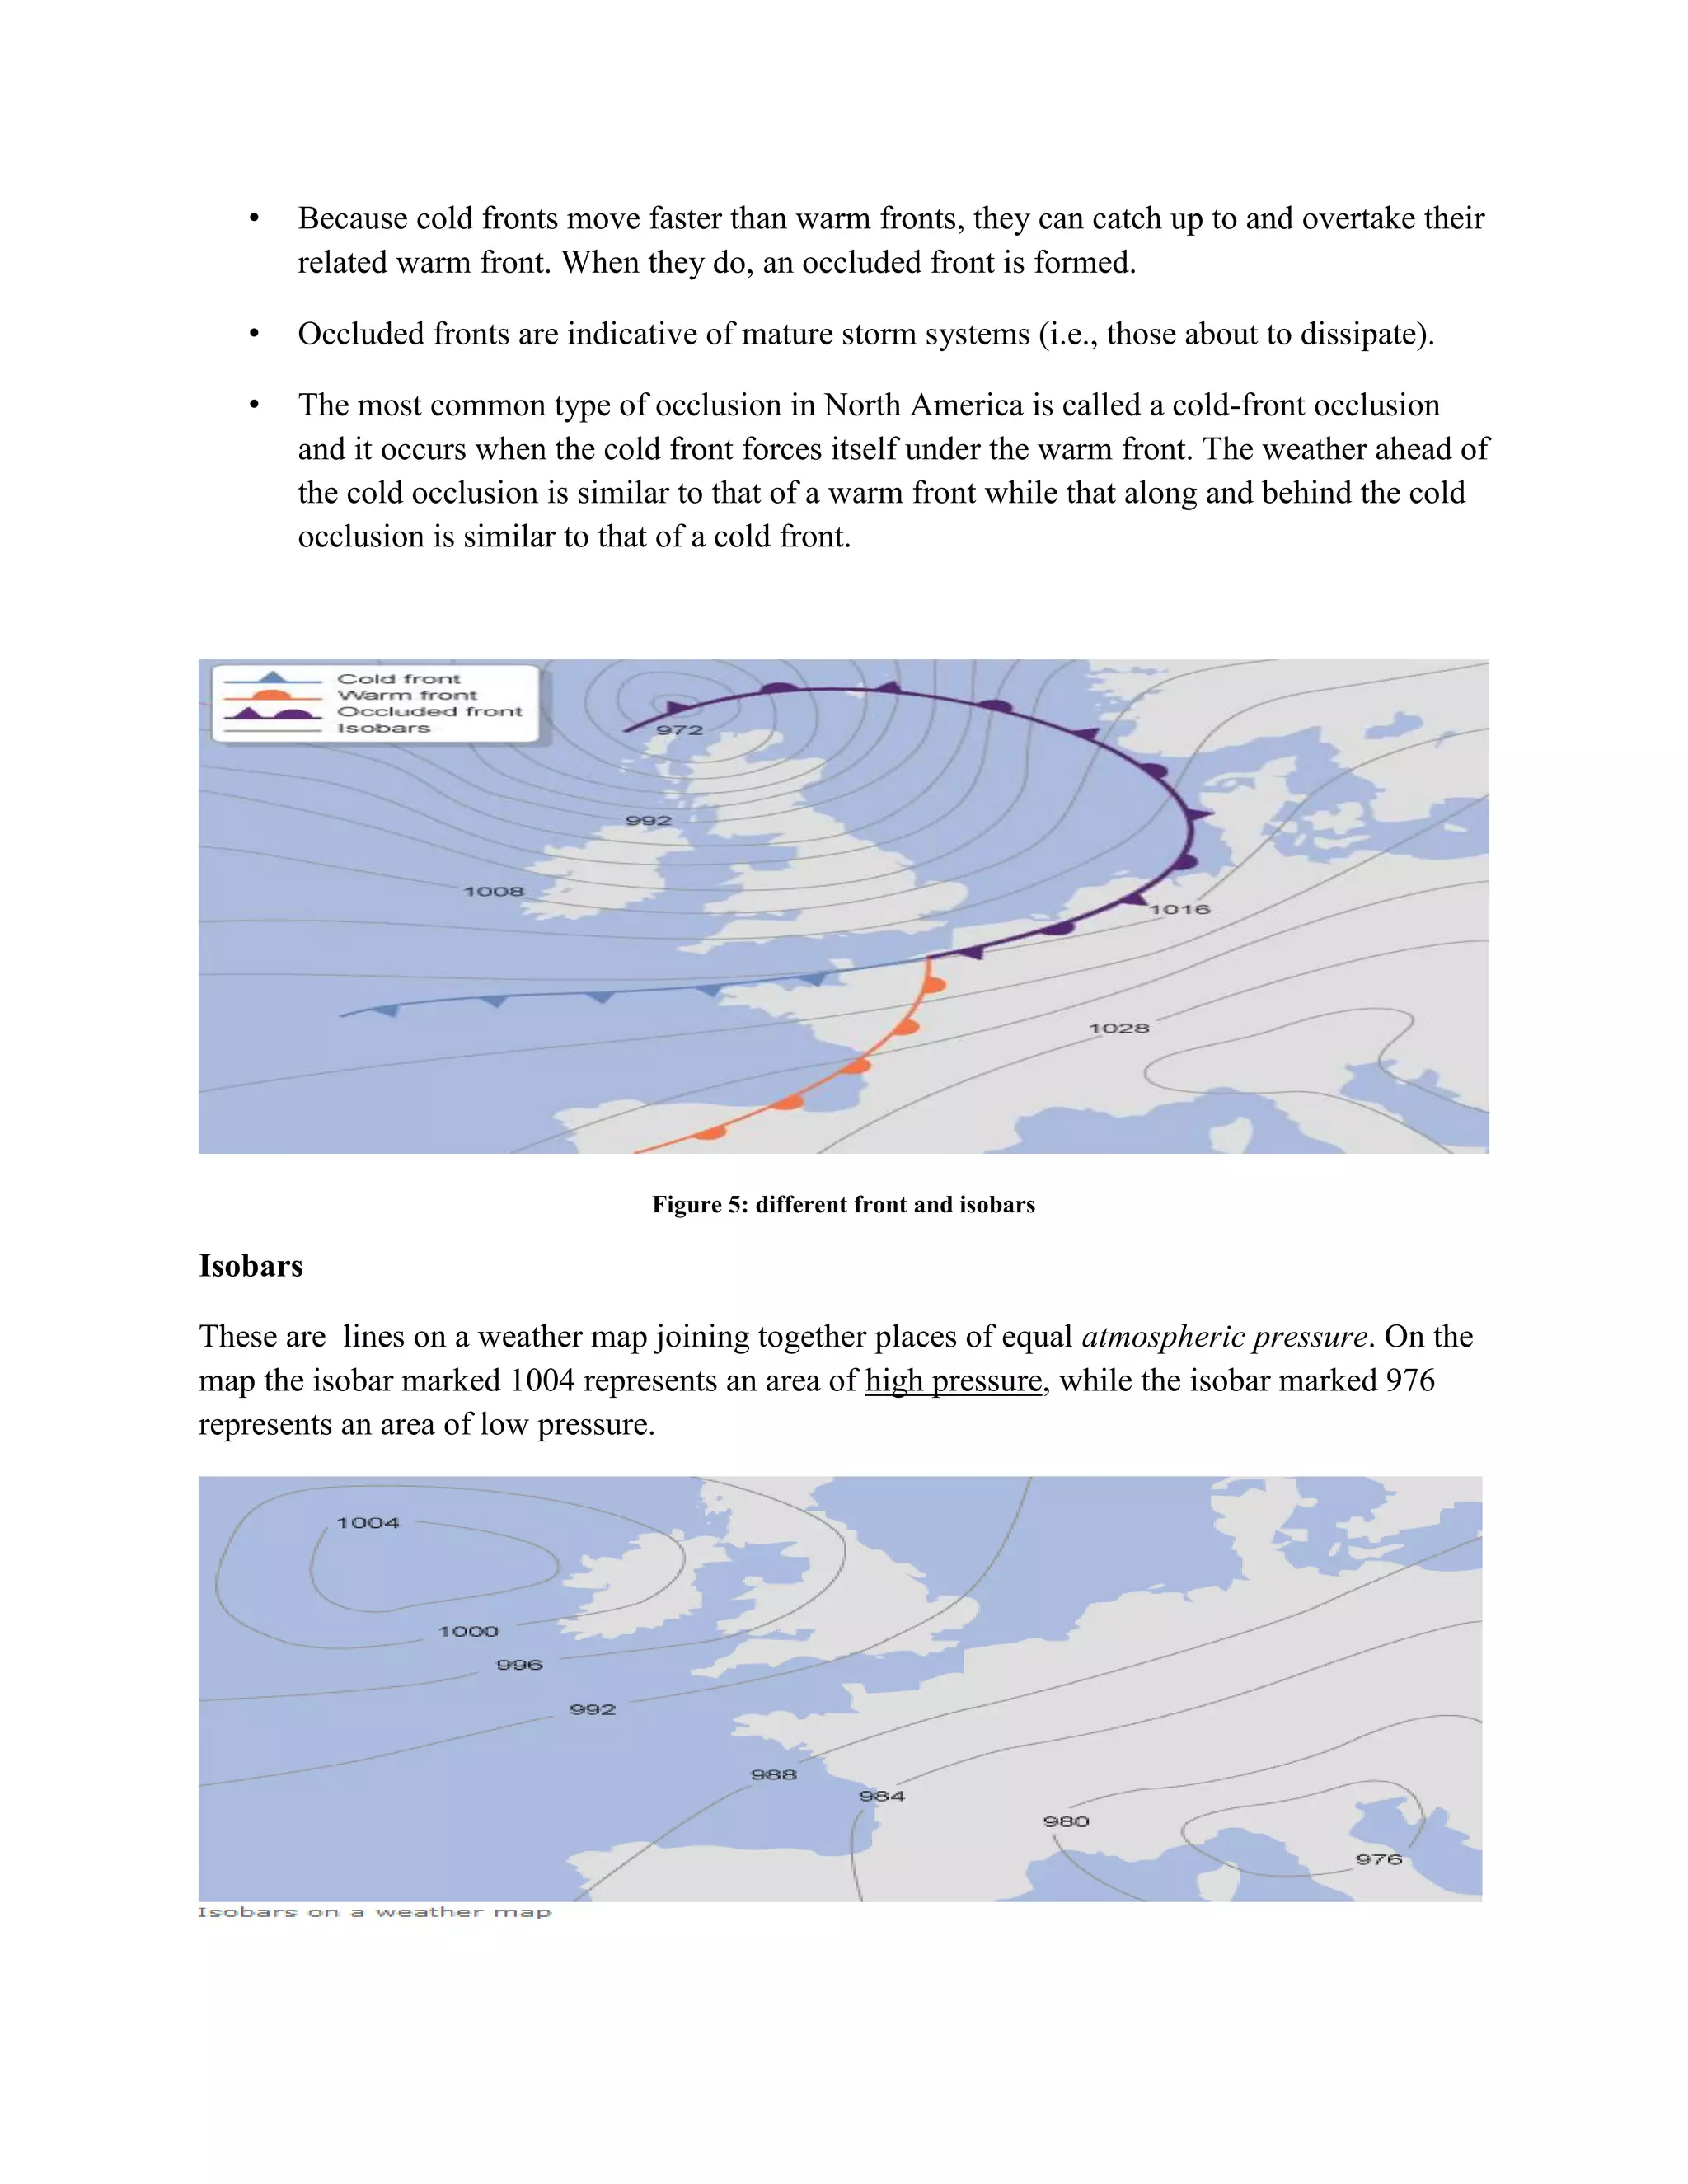
WEATHER MAP
It is a tool. It is used to show facts and study of many kinds of meteorological amounts at
different levels of the atmosphere quickly. They has been used from the mid-19th century.
Weather maps have been used both for study and for weather forecasting purposes. Some maps
show differences of temperature. This can help find weather fronts.
Weather map also tells the distribution patterns of atmospheric pressure, wind, temperature and
humidity at the different levels of the atmosphere.
In the weather maps we can find different symbols which help us to determine the different
weather conditions at different parts of the world. Some of the weather maps symbols are as
follows
Weather Fronts
• A weather front is simply a boundary between air masses. These weather fronts can be
divided into Cold front ,Warm front ,Stationery front and Occluded front
Figure 1: weather fronts
Cold Front
• Here the cold dense air is moving toward warm, less dense air and the warm air is
pushed up to cool and form clouds as the cooler air replaces it. The air on the front side
of the boundary line is warmer than the air on the back side of the boundary line. These
fronts are usually fast moving and bring stormy weather and heavy precipitation followed
by clearing skies and higher pressure.
Figure 2: cold front
Some of the characteristics of cold fronts include the following:
• The slope of a typical cold front is 1:100 (vertical to horizontal) and Cold fronts tend to
move faster than all other types of fronts they to be associated with the most violent
weather among all types of fronts.
• Cold fronts tend to move the farthest while maintaining their intensity.
• Cold fronts tend to be associated with cirrus well ahead of the front, strong thunderstorms
along and ahead of the front and a broad area of clouds immediately behind the front
(although fast moving fronts may be mostly clear behind the front).
• Cold fronts can be associated with squall lines (a line of strong thunderstorms parallel to
and ahead of the front).
• Cold fronts almost always are easier to locate on a weather map than are warm fronts,
primarily because of the strength of the high pressure system to the north and west of the
cold front compared to that north of a warm front.
• Cold fronts usually bring cooler weather, clearing skies, and a sharp change in wind
direction.
Warm front
They formed when warm air rises over a mass of cold air. As their lifts into regions of lower
pressure, it expands, cools and condenses the water vapour as wide, flat sheets of cloud.
Figure 3: warm front
Some of the characteristics of warm fronts include the following:
• The slope of a typical warm front is 1:200 (more gentle than cold fronts).
• Warm fronts tend to move slowly.
• Warm fronts are typically less violent than cold fronts.
• Although they can trigger thunderstorms, warm fronts are more likely to be associated
with large regions of gentle ascent (strati form clouds and light to moderate continuous
rain).
• Warm fronts are usually preceded by cirrus first (1000 km ahead), then altostratus or
altocumulus (500 km ahead), then stratus and possibly fog.
• Behind the warm front, skies are relatively clear (but change gradually) and Warm fronts
are associated with a frontal inversion (warm air overrunning cooler air).
Stationary front
The front that does not move or barely moves.
Figure 4: stationary front
• Stationary front- a front that does not move or barely moves and behave like warm
fronts, but are more quiescent.
• Many times the winds on both sides of a stationary front are parallel to the front.
• Typically stationary fronts form when polar air masses are modified significantly so as to
lose their character (e.g., cold fronts which stall).
Occluded Front
they occur at the point where a cold front takes over a warm front or the other way around. If a
cold front undercuts a warm front it is known as a cold occlusion and if the cold front rises over
the warm front it is called a warm occlusion. Occluded fronts bring changeable weather
conditions
• Because cold fronts move faster than warm fronts, they can catch up to and overtake their
related warm front. When they do, an occluded front is formed.
• Occluded fronts are indicative of mature storm systems (i.e., those about to dissipate).
• The most common type of occlusion in North America is called a cold-front occlusion
and it occurs when the cold front forces itself under the warm front. The weather ahead of
the cold occlusion is similar to that of a warm front while that along and behind the cold
occlusion is similar to that of a cold front.
Figure 5: different front and isobars
Isobars
These are lines on a weather map joining together places of equal atmospheric pressure. On the
map the isobar marked 1004 represents an area of high pressure, while the isobar marked 976
represents an area of low pressure.
High Pressure areas are indicated by a blue capital H on a weather map
Cooler, dense air close to the surface of the Earth surrounded by winds flowing in a clockwise
direction usually brings dry conditions and fair skies.
Moves toward Low Pressure
Low Pressure areas are indicated by a red capital L on a weather map
Warmer, less dense air above the Earth’s surface surrounded by winds moving in a
counterclockwise direction associated with the formation of storms.
High pressure will move toward low pressure
Figure 6: High and Low Pressure Circulation
Pressure and Temperature Maps use different colors to tell us the different temperatures in
different parts of a country.
The color key helps us know what each color means at right side of the map.
Other symbols are as follows

Weather map

  • 1.
    WEATHER MAP It isa tool. It is used to show facts and study of many kinds of meteorological amounts at different levels of the atmosphere quickly. They has been used from the mid-19th century. Weather maps have been used both for study and for weather forecasting purposes. Some maps show differences of temperature. This can help find weather fronts. Weather map also tells the distribution patterns of atmospheric pressure, wind, temperature and humidity at the different levels of the atmosphere. In the weather maps we can find different symbols which help us to determine the different weather conditions at different parts of the world. Some of the weather maps symbols are as follows Weather Fronts • A weather front is simply a boundary between air masses. These weather fronts can be divided into Cold front ,Warm front ,Stationery front and Occluded front Figure 1: weather fronts Cold Front • Here the cold dense air is moving toward warm, less dense air and the warm air is pushed up to cool and form clouds as the cooler air replaces it. The air on the front side of the boundary line is warmer than the air on the back side of the boundary line. These fronts are usually fast moving and bring stormy weather and heavy precipitation followed by clearing skies and higher pressure.
  • 2.
    Figure 2: coldfront Some of the characteristics of cold fronts include the following: • The slope of a typical cold front is 1:100 (vertical to horizontal) and Cold fronts tend to move faster than all other types of fronts they to be associated with the most violent weather among all types of fronts. • Cold fronts tend to move the farthest while maintaining their intensity. • Cold fronts tend to be associated with cirrus well ahead of the front, strong thunderstorms along and ahead of the front and a broad area of clouds immediately behind the front (although fast moving fronts may be mostly clear behind the front). • Cold fronts can be associated with squall lines (a line of strong thunderstorms parallel to and ahead of the front). • Cold fronts almost always are easier to locate on a weather map than are warm fronts, primarily because of the strength of the high pressure system to the north and west of the cold front compared to that north of a warm front. • Cold fronts usually bring cooler weather, clearing skies, and a sharp change in wind direction. Warm front They formed when warm air rises over a mass of cold air. As their lifts into regions of lower pressure, it expands, cools and condenses the water vapour as wide, flat sheets of cloud. Figure 3: warm front Some of the characteristics of warm fronts include the following: • The slope of a typical warm front is 1:200 (more gentle than cold fronts). • Warm fronts tend to move slowly. • Warm fronts are typically less violent than cold fronts.
  • 3.
    • Although theycan trigger thunderstorms, warm fronts are more likely to be associated with large regions of gentle ascent (strati form clouds and light to moderate continuous rain). • Warm fronts are usually preceded by cirrus first (1000 km ahead), then altostratus or altocumulus (500 km ahead), then stratus and possibly fog. • Behind the warm front, skies are relatively clear (but change gradually) and Warm fronts are associated with a frontal inversion (warm air overrunning cooler air). Stationary front The front that does not move or barely moves. Figure 4: stationary front • Stationary front- a front that does not move or barely moves and behave like warm fronts, but are more quiescent. • Many times the winds on both sides of a stationary front are parallel to the front. • Typically stationary fronts form when polar air masses are modified significantly so as to lose their character (e.g., cold fronts which stall). Occluded Front they occur at the point where a cold front takes over a warm front or the other way around. If a cold front undercuts a warm front it is known as a cold occlusion and if the cold front rises over the warm front it is called a warm occlusion. Occluded fronts bring changeable weather conditions
  • 4.
    • Because coldfronts move faster than warm fronts, they can catch up to and overtake their related warm front. When they do, an occluded front is formed. • Occluded fronts are indicative of mature storm systems (i.e., those about to dissipate). • The most common type of occlusion in North America is called a cold-front occlusion and it occurs when the cold front forces itself under the warm front. The weather ahead of the cold occlusion is similar to that of a warm front while that along and behind the cold occlusion is similar to that of a cold front. Figure 5: different front and isobars Isobars These are lines on a weather map joining together places of equal atmospheric pressure. On the map the isobar marked 1004 represents an area of high pressure, while the isobar marked 976 represents an area of low pressure.
  • 5.
    High Pressure areasare indicated by a blue capital H on a weather map Cooler, dense air close to the surface of the Earth surrounded by winds flowing in a clockwise direction usually brings dry conditions and fair skies. Moves toward Low Pressure Low Pressure areas are indicated by a red capital L on a weather map Warmer, less dense air above the Earth’s surface surrounded by winds moving in a counterclockwise direction associated with the formation of storms. High pressure will move toward low pressure Figure 6: High and Low Pressure Circulation
  • 6.
    Pressure and TemperatureMaps use different colors to tell us the different temperatures in different parts of a country. The color key helps us know what each color means at right side of the map.
  • 7.