Downloaded 22 times


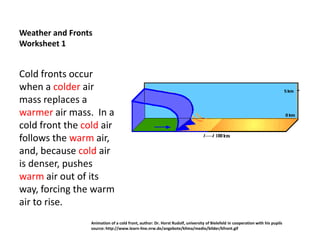
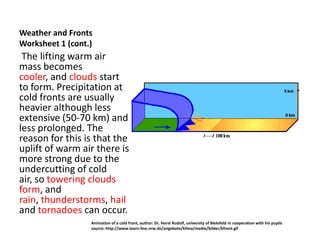
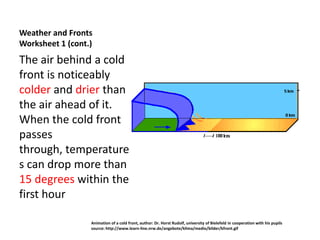

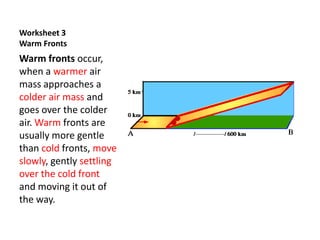
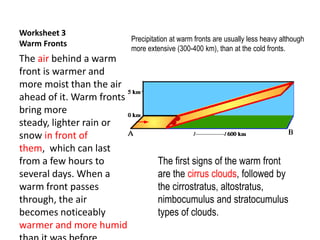


Cold fronts occur when a colder air mass replaces a warmer one, pushing the warm air up and causing heavier precipitation. Warm fronts are more gradual, with lighter and more widespread precipitation. When a cold front passes, temperatures can drop more than 15 degrees in an hour, while warm fronts bring warmer and more humid conditions.


