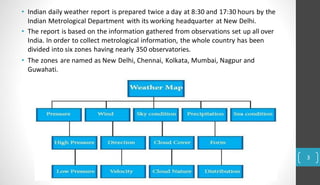
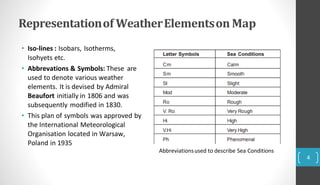
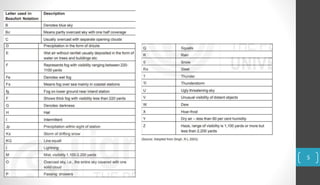
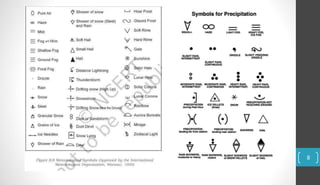
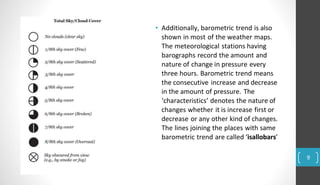
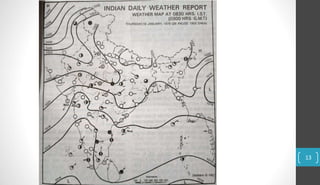
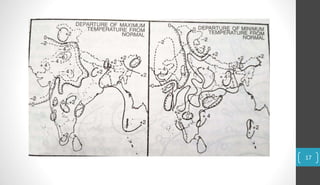
Interpretation of
Weather Maps
1
Weather Maps
• A Weather map represents the weather conditions of the whole earth or part of it
at a given time.
• There are generally six weather elements shown on the weather map of any
country or region. These elements are temperature, rainfall, atmospheric pressure,
wind direction, wind velocity, cloud cover and relative humidity.
• Sir Francis Galton, the inventor of the weather map
• Meteorological Departments of a country forecast weather conditions by
evaluating these weather elements shown on a weather map.
• This weather map is used in predicting weather conditions for a day, a week or a
month in advance, which helps in taking precautions and safety measures.
• The basic knowledge of weather elements is needed to interpret the weather
maps. 2
• Indian daily weather report is prepared twice a day at 8:30 and 17:30 hours by the
Indian Metrological Department with its working headquarter at New Delhi.
• The report is based on the information gathered from observations set up all over
India. In order to collect metrological information, the whole country has been
divided into six zones having nearly 350 observatories.
• The zones are named as New Delhi, Chennai, Kolkata, Mumbai, Nagpur and
Guwahati.
3
Representationof WeatherElementson Map
4
• Iso-lines : Isobars, Isotherms,
Isohyets etc.
• Abbrevations & Symbols: These are
used to denote various weather
elements. It is devised by Admiral
Beaufort initially in 1806 and was
subsequently modified in 1830.
• This plan of symbols was approved by
the International Meteorological
Organisation located in Warsaw,
Poland in 1935
Abbreviationsused to describe Sea Conditions
5
• The capital letters are used to designate the intensity of the phenomenon. The
lesser intensity is designated by a small suffix ‘o’. The recurrence of letters denotes
the continuity and intermittence by prefixing the letter ‘I’. These are as under:
R: heavy rain; r: (moderate) rain; or: slight rain; RR: continuous heavy rain.
rr: continuous (moderate) rain; and iro: intermittent slight rain.
• However, the distinction between real present weather condition and former
weather condition is designated by a letter called ‘solidus’. Therefore, b/r means
open sky after rain.
• The (-) sign indicates decrease in the intensity whereas (+) sign signifies increase in
intensity of the particular phenomenon under observation.
• A symbol shown in brackets as (1) tells the occurrence of that phenomenon in the
vicinity of the given observing station. There are various indices which can be used
like 0, 1, 2, 3 and 4 to portray the happening of the intensity of various
phenomenon’s under question or investigation. 6
1 Knot = 1.852 km/hr
1 Knot = 0.514 m/s
1 Knot = 1.15078 mph 7
8
• Additionally, barometric trend is also
shown in most of the weather maps.
The meteorological stations having
barographs record the amount and
nature of change in pressure every
three hours. Barometric trend means
the consecutive increase and decrease
in the amount of pressure. The
‘characteristics’ denotes the nature of
changes whether it is increase first or
decrease or any other kind of changes.
The lines joining the places with same
barometric trend are called ‘isallobars’
9
Methodof Describing DailyWeatherMap
3. Winds
i. Direction of Winds
ii. Velocity of Winds
1. Preliminary/ Introductory Information 4. Sky Conditions
2. Atmospheric Pressure
i. Areas of Low Pressure
ii. Areas of High Pressure
iii. Trends of Isobars
iv. Pressure Gradient
i. Amount of Cloud Cover
ii. Nature of Clouds
iii. Other Atmospheric Events
5. Precipitation
i. Distribution of Rainfall
ii. Areas of Heavy Precipitation
6. Sea Conditions
7. Departure of Temperature from Normal.
Following Heads are considered while interpreting a Daily Weather Map:
10
Preliminary/ Introductory Information :
While describing a daily weather map, first of all the date, day and time of observation of
the weather conditions displayed in it should be mentioned.
The Greenwich Mean Time (G.M.T.) is written in parentheses next to the Indian time of
observation at the top of each daily weather map.
Indian daily weather maps usually show the weather conditions observed at 08.30 am or
5.30 pm. These times on the map are respectively 0830 HRS. I.S.T. (0300 HRS. G.M.T.) and
1730 HRS. I.S.T. (1200 HRS. G.M.T.).
Analysis of Atmospheric Pressure:
In the daily weather map of India, atmospheric pressure is represented by isobars drawn
at an interval of 2 millibars.
Areas of high and low pressure can be identified by reading the values of isobars on the
map. For simplicity, in these maps, the letter H of the English language is written on the
area of high atmospheric pressure and the letter L is written on the area of low
atmospheric pressure.
11
• By pressure gradient, we mean the distance between the isobars on the map. The
degree of pressure gradient is greater in the parts where the isobars seem to be
close together. Conversely, where the isobars are far apart, the amount of pressure
gradient is less.
• The amount of pressure gradient has an effect on the wind speed. In areas of high
pressure gradient, the air velocity is high and in areas of low pressure gradient the
air velocity is slow.
Winds
In the daily weather map, the direction and velocity of the wind are represented by
a single symbol.
12
13
Sky Conditions
While describing the Sky conditions, it is necessary to mention three things –
(iii) what are the other atmospheric phenomena and at which centers they have been
observed.
Types and Amount of Precipitation
If the amount of rain is 2 cm or more, then it is written in numbers in the south-east
of the circle of the observation station.
The rainfall from 0.25 to 0.74 cm is represented by the symbol 'and' and 0.75 to 1.49
by the symbol '1'. Rainfall less than 0.25 cm is not displayed on the Indian daily
weather map.
Pre-determined symbols are used to display the remaining types of precipitation on
the map. While describing the condition of rainfall, first the normal distribution of
rainfall should be explained and after that the areas receiving relatively more rainfall
should be mentioned.
(ii)
(i) the amount of cloud cover i.e. how much part of the sky is covered by clouds at
different observation centers displayed in the map,
the nature of the clouds i.e. What types of clouds are there in the sky at different
centers, and
14
Sea Conditions : As discussed earlier, a set of Abbreviations is used for describing
Sea Conditions in Indian Weather Map.
Departure of Temperature from Normal :
It should be remembered that the Indian daily weather maps display the deviation of
daily temperatures from normal or standard temperatures instead of the actual
amount of temperature.
For this purpose two small auxiliary maps are made below the main map in the daily
weather report. One auxiliary map shows the deviation of the observed maximum
temperature from the normal or norm of the maximum temperature during the last
24 hours, and the second auxiliary map shows the deviation of the observed
minimum temperature from the normal of the minimum temperature during this
period.
Thus, by looking at these maps, it can be easily ascertained that in which part of the
country during the last 24 hours, the maximum and minimum temperature levels
were observed, how much more or less than their normal conditions.
15
In auxiliary maps, deviations of maximum or minimum temperature are indicated by
isometric lines. The following three things are noteworthy with respect to the
construction of these lines. :
1. Positive deviations of temperature are represented by solid lines on the map.
These lines have a + sign before the deviation values written in 'centigrade'.
2. Segmented lines are drawn in the map to show negative temperature deviations
and the mark is marked before the deviation values written on these lines.
3. If the value of deviation of temperature is zero in any part of the map, then a
double line made of solid and broken lines is drawn there and 0 is written on this
line.
16
17

dgngng

  • 1.
  • 2.
    Weather Maps • AWeather map represents the weather conditions of the whole earth or part of it at a given time. • There are generally six weather elements shown on the weather map of any country or region. These elements are temperature, rainfall, atmospheric pressure, wind direction, wind velocity, cloud cover and relative humidity. • Sir Francis Galton, the inventor of the weather map • Meteorological Departments of a country forecast weather conditions by evaluating these weather elements shown on a weather map. • This weather map is used in predicting weather conditions for a day, a week or a month in advance, which helps in taking precautions and safety measures. • The basic knowledge of weather elements is needed to interpret the weather maps. 2
  • 3.
    • Indian dailyweather report is prepared twice a day at 8:30 and 17:30 hours by the Indian Metrological Department with its working headquarter at New Delhi. • The report is based on the information gathered from observations set up all over India. In order to collect metrological information, the whole country has been divided into six zones having nearly 350 observatories. • The zones are named as New Delhi, Chennai, Kolkata, Mumbai, Nagpur and Guwahati. 3
  • 4.
    Representationof WeatherElementson Map 4 •Iso-lines : Isobars, Isotherms, Isohyets etc. • Abbrevations & Symbols: These are used to denote various weather elements. It is devised by Admiral Beaufort initially in 1806 and was subsequently modified in 1830. • This plan of symbols was approved by the International Meteorological Organisation located in Warsaw, Poland in 1935 Abbreviationsused to describe Sea Conditions
  • 5.
  • 6.
    • The capitalletters are used to designate the intensity of the phenomenon. The lesser intensity is designated by a small suffix ‘o’. The recurrence of letters denotes the continuity and intermittence by prefixing the letter ‘I’. These are as under: R: heavy rain; r: (moderate) rain; or: slight rain; RR: continuous heavy rain. rr: continuous (moderate) rain; and iro: intermittent slight rain. • However, the distinction between real present weather condition and former weather condition is designated by a letter called ‘solidus’. Therefore, b/r means open sky after rain. • The (-) sign indicates decrease in the intensity whereas (+) sign signifies increase in intensity of the particular phenomenon under observation. • A symbol shown in brackets as (1) tells the occurrence of that phenomenon in the vicinity of the given observing station. There are various indices which can be used like 0, 1, 2, 3 and 4 to portray the happening of the intensity of various phenomenon’s under question or investigation. 6
  • 7.
    1 Knot =1.852 km/hr 1 Knot = 0.514 m/s 1 Knot = 1.15078 mph 7
  • 8.
  • 9.
    • Additionally, barometrictrend is also shown in most of the weather maps. The meteorological stations having barographs record the amount and nature of change in pressure every three hours. Barometric trend means the consecutive increase and decrease in the amount of pressure. The ‘characteristics’ denotes the nature of changes whether it is increase first or decrease or any other kind of changes. The lines joining the places with same barometric trend are called ‘isallobars’ 9
  • 10.
    Methodof Describing DailyWeatherMap 3.Winds i. Direction of Winds ii. Velocity of Winds 1. Preliminary/ Introductory Information 4. Sky Conditions 2. Atmospheric Pressure i. Areas of Low Pressure ii. Areas of High Pressure iii. Trends of Isobars iv. Pressure Gradient i. Amount of Cloud Cover ii. Nature of Clouds iii. Other Atmospheric Events 5. Precipitation i. Distribution of Rainfall ii. Areas of Heavy Precipitation 6. Sea Conditions 7. Departure of Temperature from Normal. Following Heads are considered while interpreting a Daily Weather Map: 10
  • 11.
    Preliminary/ Introductory Information: While describing a daily weather map, first of all the date, day and time of observation of the weather conditions displayed in it should be mentioned. The Greenwich Mean Time (G.M.T.) is written in parentheses next to the Indian time of observation at the top of each daily weather map. Indian daily weather maps usually show the weather conditions observed at 08.30 am or 5.30 pm. These times on the map are respectively 0830 HRS. I.S.T. (0300 HRS. G.M.T.) and 1730 HRS. I.S.T. (1200 HRS. G.M.T.). Analysis of Atmospheric Pressure: In the daily weather map of India, atmospheric pressure is represented by isobars drawn at an interval of 2 millibars. Areas of high and low pressure can be identified by reading the values of isobars on the map. For simplicity, in these maps, the letter H of the English language is written on the area of high atmospheric pressure and the letter L is written on the area of low atmospheric pressure. 11
  • 12.
    • By pressuregradient, we mean the distance between the isobars on the map. The degree of pressure gradient is greater in the parts where the isobars seem to be close together. Conversely, where the isobars are far apart, the amount of pressure gradient is less. • The amount of pressure gradient has an effect on the wind speed. In areas of high pressure gradient, the air velocity is high and in areas of low pressure gradient the air velocity is slow. Winds In the daily weather map, the direction and velocity of the wind are represented by a single symbol. 12
  • 13.
  • 14.
    Sky Conditions While describingthe Sky conditions, it is necessary to mention three things – (iii) what are the other atmospheric phenomena and at which centers they have been observed. Types and Amount of Precipitation If the amount of rain is 2 cm or more, then it is written in numbers in the south-east of the circle of the observation station. The rainfall from 0.25 to 0.74 cm is represented by the symbol 'and' and 0.75 to 1.49 by the symbol '1'. Rainfall less than 0.25 cm is not displayed on the Indian daily weather map. Pre-determined symbols are used to display the remaining types of precipitation on the map. While describing the condition of rainfall, first the normal distribution of rainfall should be explained and after that the areas receiving relatively more rainfall should be mentioned. (ii) (i) the amount of cloud cover i.e. how much part of the sky is covered by clouds at different observation centers displayed in the map, the nature of the clouds i.e. What types of clouds are there in the sky at different centers, and 14
  • 15.
    Sea Conditions :As discussed earlier, a set of Abbreviations is used for describing Sea Conditions in Indian Weather Map. Departure of Temperature from Normal : It should be remembered that the Indian daily weather maps display the deviation of daily temperatures from normal or standard temperatures instead of the actual amount of temperature. For this purpose two small auxiliary maps are made below the main map in the daily weather report. One auxiliary map shows the deviation of the observed maximum temperature from the normal or norm of the maximum temperature during the last 24 hours, and the second auxiliary map shows the deviation of the observed minimum temperature from the normal of the minimum temperature during this period. Thus, by looking at these maps, it can be easily ascertained that in which part of the country during the last 24 hours, the maximum and minimum temperature levels were observed, how much more or less than their normal conditions. 15
  • 16.
    In auxiliary maps,deviations of maximum or minimum temperature are indicated by isometric lines. The following three things are noteworthy with respect to the construction of these lines. : 1. Positive deviations of temperature are represented by solid lines on the map. These lines have a + sign before the deviation values written in 'centigrade'. 2. Segmented lines are drawn in the map to show negative temperature deviations and the mark is marked before the deviation values written on these lines. 3. If the value of deviation of temperature is zero in any part of the map, then a double line made of solid and broken lines is drawn there and 0 is written on this line. 16
  • 17.