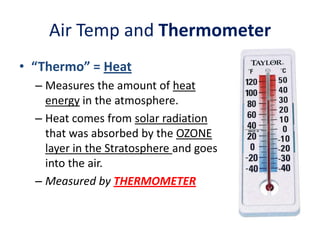
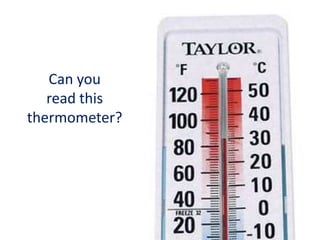
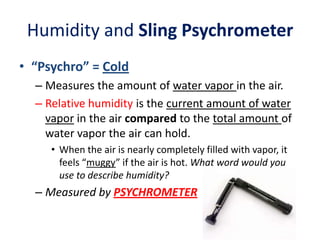
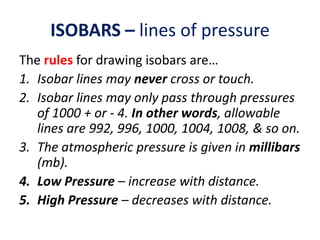
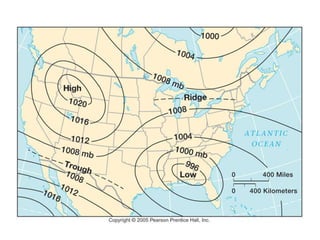
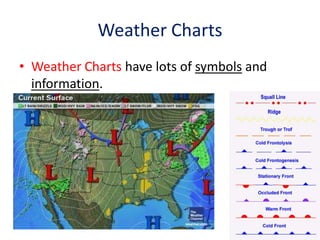
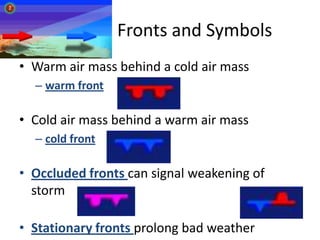
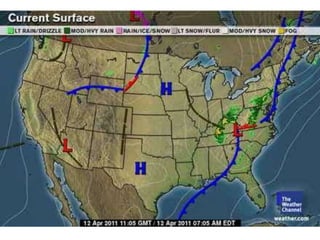
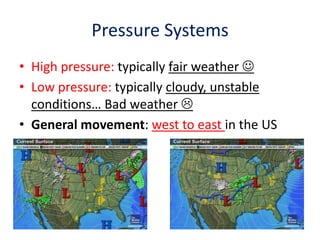
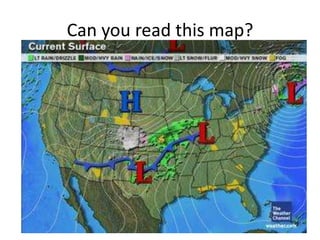
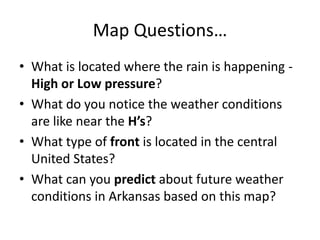
Weather Instruments

Anemometers, Barometers, Sling
Psychrometers, Thermometers, and Weather Charts.
Air Temp and Thermometer
• “Thermo” = Heat
– Measures the amount of heat
energy in the atmosphere.
– Heat comes from solar radiation
that was absorbed by the OZONE
layer in the Stratosphere and goes
into the air.
– Measured by THERMOMETER
Can you
read this
thermometer?
Humidity and Sling Psychrometer
• “Psychro” = Cold
– Measures the amount of water vapor in the air.
– Relative humidity is the current amount of water
vapor in the air compared to the total amount of
water vapor the air can hold.
• When the air is nearly completely filled with vapor, it
feels “muggy” if the air is hot. What word would you
use to describe humidity?

– Measured by PSYCHROMETER
Comparing Humidity Levels
How humid is it?
• If the
relative
humidity
of the air
is 88%...
How
would it
feel
outside?
Wind Speed and Anemometer
• “Anemo” = Wind
– Measures the wind speed in the air.
– Changes in the heating of Earths surface
(uneven), air temp, and air pressure cause air to
move
– Horizontal (side to side) movement of air: WIND
– Vertical (up and down) movement of air: AIR
CURRENT
– Measured by ANEMOMETER
Anemometer… Close Up!
Convection Currents or Cells
• Wind is caused by…
– Warm air rises because it is less dense, cooler
sinks because it is more dense.
– This pattern
is called a
convection cell
Air Pressure and Barometer
• “Baro” = Weight
– A barometer works by measuring the amount of
force exerted by the air’s molecules hitting a
surface area.
– Measured in millibars (mb)
– When air heats up, the molecules spread apart
and become less dense and the air pressure goes
down (becomes low pressure).
– Measured by BAROMETER
Reading a Barometer
• Can you read
this
Barometer?
• Standard air
pressure is
1013.25 mb.
Does this
barometer
read at
standard air
pressure?

1018 mb
Air Pressure and ISOBARS
• Isobar = (baros, meaning 'weight') is a line of
equal or constant pressure on a graph, plot, or
map.
ISOBARS – lines of pressure
The rules for drawing isobars are…
1. Isobar lines may never cross or touch.
2. Isobar lines may only pass through pressures
of 1000 + or - 4. In other words, allowable
lines are 992, 996, 1000, 1004, 1008, & so on.
3. The atmospheric pressure is given in millibars
(mb).
4. Low Pressure – increase with distance.
5. High Pressure – decreases with distance.
Weather Charts
• Weather Charts have lots of symbols and
information.
Fronts and Symbols
• Warm air mass behind a cold air mass
– warm front

• Cold air mass behind a warm air mass
– cold front

• Occluded fronts can signal weakening of
storm
• Stationary fronts prolong bad weather
Pressure Systems
• High pressure: typically fair weather 
• Low pressure: typically cloudy, unstable
conditions… Bad weather 
• General movement: west to east in the US
Can you read this map?
Map Questions…
• What is located where the rain is happening High or Low pressure?
• What do you notice the weather conditions
are like near the H’s?
• What type of front is located in the central
United States?
• What can you predict about future weather
conditions in Arkansas based on this map?

weather instruments and maps, no video ppt

  • 1.
    Weather Instruments Anemometers, Barometers,Sling Psychrometers, Thermometers, and Weather Charts.
  • 2.
    Air Temp andThermometer • “Thermo” = Heat – Measures the amount of heat energy in the atmosphere. – Heat comes from solar radiation that was absorbed by the OZONE layer in the Stratosphere and goes into the air. – Measured by THERMOMETER
  • 3.
  • 4.
    Humidity and SlingPsychrometer • “Psychro” = Cold – Measures the amount of water vapor in the air. – Relative humidity is the current amount of water vapor in the air compared to the total amount of water vapor the air can hold. • When the air is nearly completely filled with vapor, it feels “muggy” if the air is hot. What word would you use to describe humidity? – Measured by PSYCHROMETER
  • 5.
  • 6.
    How humid isit? • If the relative humidity of the air is 88%... How would it feel outside?
  • 7.
    Wind Speed andAnemometer • “Anemo” = Wind – Measures the wind speed in the air. – Changes in the heating of Earths surface (uneven), air temp, and air pressure cause air to move – Horizontal (side to side) movement of air: WIND – Vertical (up and down) movement of air: AIR CURRENT – Measured by ANEMOMETER
  • 8.
  • 9.
    Convection Currents orCells • Wind is caused by… – Warm air rises because it is less dense, cooler sinks because it is more dense. – This pattern is called a convection cell
  • 10.
    Air Pressure andBarometer • “Baro” = Weight – A barometer works by measuring the amount of force exerted by the air’s molecules hitting a surface area. – Measured in millibars (mb) – When air heats up, the molecules spread apart and become less dense and the air pressure goes down (becomes low pressure). – Measured by BAROMETER
  • 11.
    Reading a Barometer •Can you read this Barometer? • Standard air pressure is 1013.25 mb. Does this barometer read at standard air pressure? 1018 mb
  • 12.
    Air Pressure andISOBARS • Isobar = (baros, meaning 'weight') is a line of equal or constant pressure on a graph, plot, or map.
  • 13.
    ISOBARS – linesof pressure The rules for drawing isobars are… 1. Isobar lines may never cross or touch. 2. Isobar lines may only pass through pressures of 1000 + or - 4. In other words, allowable lines are 992, 996, 1000, 1004, 1008, & so on. 3. The atmospheric pressure is given in millibars (mb). 4. Low Pressure – increase with distance. 5. High Pressure – decreases with distance.
  • 15.
    Weather Charts • WeatherCharts have lots of symbols and information.
  • 16.
    Fronts and Symbols •Warm air mass behind a cold air mass – warm front • Cold air mass behind a warm air mass – cold front • Occluded fronts can signal weakening of storm • Stationary fronts prolong bad weather
  • 18.
    Pressure Systems • Highpressure: typically fair weather  • Low pressure: typically cloudy, unstable conditions… Bad weather  • General movement: west to east in the US
  • 19.
    Can you readthis map?
  • 20.
    Map Questions… • Whatis located where the rain is happening High or Low pressure? • What do you notice the weather conditions are like near the H’s? • What type of front is located in the central United States? • What can you predict about future weather conditions in Arkansas based on this map?