Download to read offline
![Signal & Image Processing: An International Journal (SIPIJ) Vol.11, No.1, February 2020
DOI: 10.5121/sipij.2020.11102 11
WAVELET DECOMPOSITION AND ALPHA
STABLE FUSION
Rachid Sabre1
and Ias Wahyuni2
1
Laboratory Biogéosciences CNRS, University of Burgundy/Agrosup Dijon, France
2
Universitas Gunadarma, J1. Margonda Raya No 100 Depok 16424, Indonesia
ABSTRACT
This article gives a new method of fusing multifocal images combining the Laplacian pyramid and the
wavelet decomposition using the stable distance alpha as a selection rule. We start by decomposing
multifocal images into several pyramid levels, then applying the wavelet decomposition to each level. the
originality of this work is to use the stable distance alpha to fuse the wavelet images at each level of the
Pyramid. To obtain the final fused image, we reconstructed the combined image at each level of the
pyramid. We compare our method to other existing methods in the literature and we deduce that it is almost
better.
KEYWORDS
Image fusion, Laplacian pyramid, Wavelet decomposition
1. INTRODUCTION
The principle of image fusion is the combination of relevant information from two or more
images into a single image giving all the information carried by the input images. The purpose of
image fusing is to reduce the blurred area and maximize the bright area in the output image so it
increases the information relevant to an application or task. New technology uses images taken by
several tools to be sure of interpretation. So it is possible to obtain information from multiple
images hence the need to fuse them to obtain high quality information. The images discussed in
this article are multifocal. Due to the limited depth of field of optical lenses in cameras, it is often
not possible to get an image containing all the relevant objects `` in focus '' so that a scene can be
broken down into a whole images with different focus for each image. in this case we use the
image fusion method to get all the focused objects.
In the literature, many methods for performing image fusion are studied [1] - [3]. This work uses
the Laplacian pyramid (LP) and transforms it into discrete wavelets (DWT). These two methods
consist in fusing the transformation images at several levels.
The fusion of LP images between multi-source information at the basic level to give precise and
reliable information. The choice of selection rule to determine the value of each pixel in the
resulting fused pyramid is very important in fusion LP images. Among the selection rules used in
LP image fusion are the average method, the maximum method, the salience and the
correspondence measure [4], and the combination of the average and maximum energy method
[4]. Recently, [6] used PCA as a selection rule in LP image fusion and wavelet decomposition
with the maximum absolute selection rule [7].
On the other hand, the wavelet fusion method decomposes the image into different types of sub-
bands of coefficients. The fusion of images using the wavelet method can be seen in [8] - [11].](https://image.slidesharecdn.com/11120sipij02-200310112537/85/WAVELET-DECOMPOSITION-AND-ALPHA-STABLE-FUSION-1-320.jpg)
![Signal & Image Processing: An International Journal (SIPIJ) Vol.11, No.1, February 2020
12
The edge characteristics are well preserved with the maximum wavelet transformation module.
Thus, the information on the components of the object in a new fused image preserving the
detailed information on the image [7].
The new method of fusing multifocal images that we propose in this work uses the Laplacian
pyramid (LP) and the wavelet transform with a fusion by alpha stable distance as a selection rule.
It begins with the decomposition into discrete wavelets at each level of LP. Then it fuses the
wavelet coefficients by a model based on the alpha stable distance. This method of fusion
contributed significantly to the improvement of the resulting fused image. This paper is organized
as follows: Section 2 briefly gives the construction of the stable alpha distance of the
neighbouring pixels and the model of the fusion. Section 3 develops the proposed method.
Section 4 is an application of the proposed method on real images and comparison with other
methods. Section 5 presents our conclusions and identifies potential perspectives.
2. NEIGHBOURALPHA STABLE DISTANCE AND FUSION
Stable alpha laws are widely used in the processing of impulsive or spiky signals. It has been used
for example in [12] and [13] to give the model of sea congestion in SAR images using a stable
alpha distribution for the detection of ships, in [14] the noise of speckle a been removed using the
Bayesian algorithm based on stable alpha in the wavelet domain. The stable alpha distribution is
also used in image segmentation [15] as well as in compression image fusion [12]. [14], [15],
[13]. We then give a brief overview of the alpha-stable distribution.
A. Neighbor alpha stable distance
This work propose a novel fusion method using a new model as a selection rule in Laplacian
pyramid method. This consisted of weighting each pixel of each image by exponential of
Neighbor Alpha Stable Distance (NASD). This neighbor alpha stable distance generalize the
quadratic difference between the value of the pixel (x,y) and the all pixel values of its neighbors
when . The neighbor, with the size "a", of a pixel (x,y) is defined as follows:
( , )x i y j+ + where , 1, , 1,i a a a a= − − + −K and , 1, , 1,j a a a a= − − + −K .
For example the neighbour with the small size ("a" = 1) contains:( 1, 1)x y− − , ( 1, )x y− ,
( 1, 1)x y− + , ( , 1)x y − , ( , 1)x y + , ( 1, 1)x y+ − , ( 1, )x y+ ,( 1, 1)x y+ + .
(x-1, y-1) (x-1,y) (x-1,y+1)
(x,y-1) (x,y) (x,y+1)
(x+1,y-1) (x+1,y) (x+1,y+1)
Figure 1. Pixel at (x,y) within its neighborhood, a = 1.
Then, the steps of image fusion with size "a"wereas follows:](https://image.slidesharecdn.com/11120sipij02-200310112537/85/WAVELET-DECOMPOSITION-AND-ALPHA-STABLE-FUSION-2-320.jpg)
 ( ){ }2 '
, , {(0,0)} , ( , ) .k kS m n a a I x m y n I x y= ∈ − − + + = 1, ,k M= K .
B. Neighbor Alpha Stable Fusion
The Model of the fusion based on Neighbour Alpha Stable Fusion (NASF) is:
,
1
,
1
exp( ( , )) ( , )
( , )
exp( ( , ))
M
a k i
i
M
a k
i
d x y I x y
NASF x y
d x y
=
=
=
∑
∑
(6)
Obviously, this method depended on the size "a". We have noticed that,for almost all images, a=4
gave the best result. In the following we took a=4.
3. THE PROPOSED METHOD
First, we decomposed each source image by Laplacian pyramid (LP). The paper [16] introduced
(LP) as a binocular fusion model in human stereoscopic vision. The selection rule used was the
maximum at each level of the pyramidal transformation [17]. Each level of the Laplacian pyramid
has been built recursively from its lower level by applying the following four basic steps: blurring
(low-pass filtering), subsampling (size reduction), interpolation (expansion) and differentiation
(to subtract two image pixels per pixel). The lowest level of the pyramid corresponds to the
original image.
At each level of Laplacian pyramid, we applied Decomposition Wavelet Transform (DWT).Using
Haar wavelet transform. DWT separately filtered and lowered samples images in the horizontal
direction and vertical directions. This gave four coefficient subbands at each scale. As presented
in [7], we supposed an image ),( yxI and denoted the horizontal frequency first by using 1-D
lowpass filter L and highpass filter H produces the coefficient matrices ),( yxIL
and ),( yxIH
and
then followed the vertical frequency second by using lowpass filter L and highpass filter H to
each column in ),( yxIL
and ),( yxIH
. Thisgave four sub-images ),( yxI LL
, ),( yxILH
,
),( yxIHL
, and ),( yxIHH
for one level of decomposition. By recursively applying the same
scheme to the low-low subband amultiresolution decomposition could be achieved.](https://image.slidesharecdn.com/11120sipij02-200310112537/85/WAVELET-DECOMPOSITION-AND-ALPHA-STABLE-FUSION-3-320.jpg)
![Signal & Image Processing: An International Journal (SIPIJ) Vol.11, No.1, February 2020
15
4. EXPERIMENTAL RESULT
As in the work [18], we have used in this section images from the database [12]. We have blurred
an area of each image using the convolution of the Gaussian filter applied to the reference image
gf: the choice of Gaussian is validated in the works [19] - [20]. The blurred zones are chosen to
hide an object from the photographed scene when there are several objects. Thus, the size of the
blurred areas varied according to the size of the objects hidden in the images.Let gf thereference
image. The blurred image g0wasdefined as follows:
2 2
2 20
( ', ') ( ', '),( , )
( , )
( , ),( , )
f
n m
f
h m n g i m j n i j blurred area
g i j
g i j i j object focus area
=− =−
− − ∈
=
∈
∑ ∑
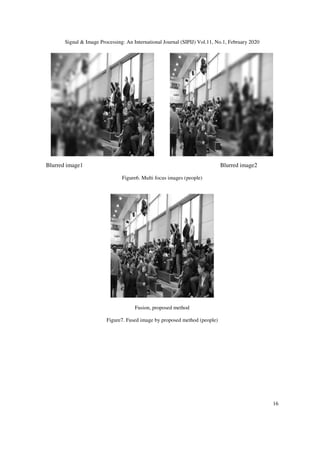
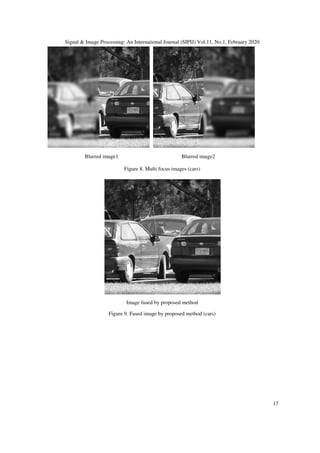
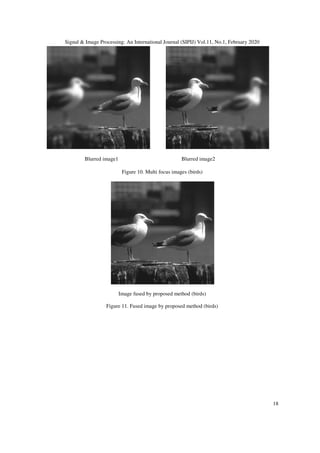
where h(m',n') is Gaussian filter. We applied the method on 150 sets of multifocus images on a
datasets of images [12]. This paper presented only five set of multi focus images. Figures4, 6,
8,10 and 12 show the multi focus images obtained by the convolution of Gaussian filter. Figures
5,7, 9, 11 and 13 show the fused image by proposed method.Visually the image obtained by the
proposed method gives a very satisfactory fusion.
Blurred image1 Blurred image2
Figure4. Multi focus images (bottles)
Figure5. Fused image by proposed method (bottles)](https://image.slidesharecdn.com/11120sipij02-200310112537/85/WAVELET-DECOMPOSITION-AND-ALPHA-STABLE-FUSION-5-320.jpg)
![Signal & Image Processing: An International Journal (SIPIJ) Vol.11, No.1, February 2020
19
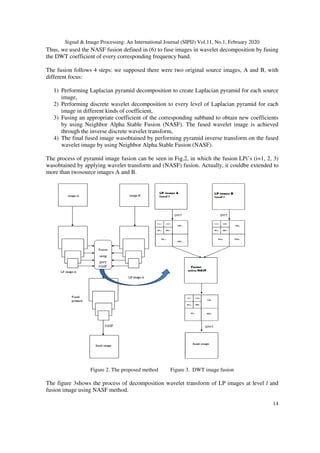
Blurred image1 Blurred image2
Figure 12. Multi focus images (clocks)
Image fused by proposed method (clocks)
Figure 13. Fused image by proposed method (clocks)
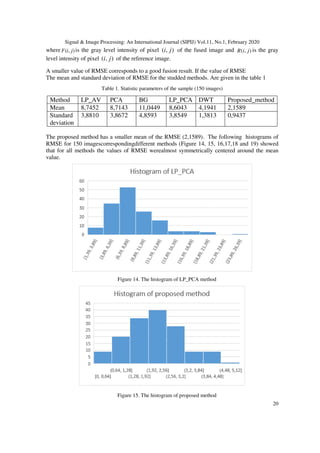
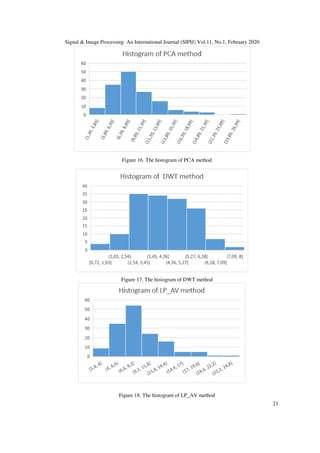
We compared the proposed method to other methods like: Principal Component Analysis (PCA)
[5], Decomposition Wavelet Transform (DWT) [8]-[9]and [14]-[15], Bilateral Gradient-based
(BG) [21], Laplacian Pyramid with Average as selection rule (LP_AV), Laplacian Pyramid with
PCA as selection rule (LP_PCA) [22].
For that, we used the quantitative analysis root mean square error (RMSE) defined by:
[ ]∑∑= =
−=
m
i
n
j
jiFjiR
mn
RMSE
1 1
2
),(),(
1](https://image.slidesharecdn.com/11120sipij02-200310112537/85/WAVELET-DECOMPOSITION-AND-ALPHA-STABLE-FUSION-9-320.jpg)
![Signal & Image Processing: An International Journal (SIPIJ) Vol.11, No.1, February 2020
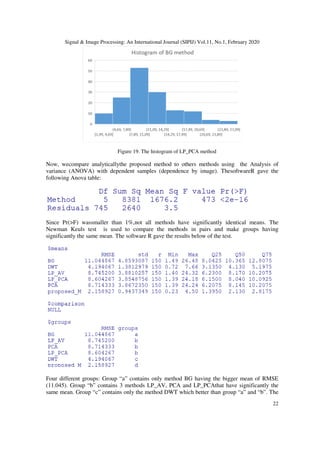
23
last group “d” containing the proposed method that the best method because its mean is the
smallest by comparing with other means.
5. CONCLUSION
The proposed method of fusion gave better result than other studded methods. The advantage of
this method isto use the local fusionwhile taking into account the neighborhood values. This work
can be havemany applications, such as:
1. Drone is a new technology in digital imaging, it has opened up unlimited possibilities for
enhancing photography. Drone can capture images on the same scene that zooms in on different
objects, and at various altitudes. It will produces several images on the same scene but with
different objects in-focus.
2. For quality control in food industry, cameras are used to take images. Each camera targets one
of several objects to detect an anomaly. The objects are on a treadmill. To have animage
containing all the objects in clear we can use the proposed methodwhich would give more details
We will use the same technique (alpha stable distance) as a distance to improve Dempster Sheffer
method.
REFERENCES
[1] Jinjiang Li,1,2 Genji Yuan,1,2 and Hui Fan, “Multifocus Image Fusion Using Wavelet-Domain-
Based Deep CNN”, Computational Intelligence and Neuroscience, Vol. 2019, 23 pages, 2019.
[2] K. Xu, Z. Qin, G. Wang, H. Zhang, K. Huang, and S. Ye, “Multi-focus image fusion using fully
convolutional two-stream network for visual sensors,” KSII Transactions on Internet and
Information Systems, Vol. 12, no. 5, pp. 2253–2272, 2018
[3] H. Li, X. He, D. Tao, Y. Tang, and R. Wang, “Joint medical image fusion, denoising and
enhancement via discriminative low-rank sparse dictionaries learning,” Pattern Recognition, Vol. 79,
pp. 130–146, 2018
[4] P. J. Burt and R. J. Kolezynski, “Enhanced image capture through fusion,” in Proc. International
Conference on Computer Vision,pp. 173-182, 1993.
[5] W. Wang and F. Chang,“A multi-focus image fusion method based on Laplacian pyramid”, Journal
of Computers [Online].6(12).Available:
http://ojs.academypublisher.com/index.php/jcp/article/view/jcp061225592566, Dec. 2011.
[6] P. Zhao, G. Liu, C. Hu, and H. Huang, “Medical image fusion algorithm on the Laplace-PCA,” in
Proc. Chinese Intelligent Automation Conference, 2013, pp. 787-794, 2013.
[7] R. Sabre, I Wahyuni “Alpha Stable Filter and Distance for Multifocus Image Fusion”, International
Journal of Signal Processing Systems, Vol. 7, No. 2, 2019
[8] G. Pajares and J. M. Cruz, “A wavelet-based image fusion tutorial,” Pattern Recognition, Vol. 37,
pp.1855-1872, 2004.
[9] Q. Guihong, Z. Dali, and Y. Pingfan,“Medical image fusion by wavelet transform modulus
maxima”. Opt. Express [Online].9(4).pp.184-190.Available:
http://www.opticsinfobase.org/oe/abstract.cfm?uri=oe-9-4-184, 2001.
[10] H. Li, S. Wei, and Y. Chai, “Multifocus image fusion scheme based on feature contrast in the lifting
stationary wavelet domain,” EURASIP Journal on Advances in Signal Processing, 2012.
[11] Y. Yang, D. Park, S. Huang, and N. Rao, “Medical image fusion via an effective wavelet-based
approach,” EURASIP Journal an Advances in Signal Processing, 2010.
[12] www.rawsamples.ch. Accessed: 15 November 2017.
[13] T. Wan, N. Canagarajah, and A. Achim, “A Statistical Multiscale Image Segmentation via Alpha-
Stable Modelling,” IEEE International Conference on Image Processing, Vol. 4, pp. 357-360, 2017.
[14] Q. Guihong, Z. Dali, and Y. Pingfan, “Medical image fusion by wavelet transform modulus
maxima”, [Online]. Opt. Express 9(4). pp. 184-190. Available:
http://www.opticsinfobase.org/oe/abstract.cfm?uri=oe-9-4-184, 2001.](https://image.slidesharecdn.com/11120sipij02-200310112537/85/WAVELET-DECOMPOSITION-AND-ALPHA-STABLE-FUSION-13-320.jpg)
![Signal & Image Processing: An International Journal (SIPIJ) Vol.11, No.1, February 2020
24
[15] F. Maes. “Multimodality image registration by maximization of mutual information”, IEEE
Transaction Medical Imaging. Vol. 16 Issue 2,1997.
[16] P. J. Burt and E. H. Adelson, “The Laplacian pyramid as a compact image code,” IEEE Transactions
on Communication, Vol. 31, No. 40, Apr. 1983.
[17] P. J. Burt, “The pyramid as a structure for efficient computation,” in Multiresolution Image
Processing and Analysis, A. Rosenfeld, Ed., New York: Springer-Verlag, 1984.
[18] I. Wahyuni , ”Multi-focus image fusion using local variability”, Thèse de doctorat, Université de
Bourgogne juin 2017.
[19] S.K. Nayar, “Shape from Focus System,”, IEEE Computer Vision and Pattern Recognition,
Proceedings CVPR, 1992.
[20] M. Subbarao, “Efficient Depth Recovery through Inverse Optics,” Machine Vision for Inspection
and Measurement, edited by H. Freeman, Academic Press, 1989.
[21] J. Tian, L. Chen, L. Ma, and W. Yu, “Multi-focus image fusionusing a bilateral gradient-based
sharpness criterion,” Optic Communications, Vol. 284, pp. 80-87, 2011.
[22] V.P.S. Naidu, and. J.R. Raol, “Pixel-level Image Fusion using Wavelets and Principal component
Analysis”, Defence Science Journal, Vol. 58, No. 3, pp. 338-352. 2008
AUTHORS
Rachid Sabre received the PhD degree in statistics from the University of Rouen, Rouen, France, in 1993
and Habilitation (HdR) from the University of Burgundy, Dijon, France, in 2003.He joined Agrosup Dijon,
Dijon, France, in 1995, where he is an Associate Professor. From 1998 through 2010, he served as a
member of Institut de Mathématiques de Bourgogne, France. He was a member of the Scientific Council
AgroSup Dijon from 2009 to 2013. In 2012, he has been a member of Laboratoire Electronique,
Informatique, et Image (Le2i), France. Since 2019 has been a member of Laboratory Biogeosciences UMR
CNRS, University of Burgundy. He is author/co-author of numerous papers in scientific and technical
journals and conference proceedings. His research interests lie in areas of statistical process and spectral
analysis for signal and image processing.
Ias Sri Wahyuni was born in Jakarta, Indonesia, in 1986. She earned the B.Sc. and M.Sc. degrees in
mathematics from the University of Indonesia, Depok, Indonesia, in 2008 and 2011, respectively.In 2009,
she joined the Department of Informatic System, Gunadarma University, Depok, Indonesia, as a Lecturer.
She is currently a PhD student at University of Burgundy, Dijon, France. Her current research interests
include statistics and image processing.](https://image.slidesharecdn.com/11120sipij02-200310112537/85/WAVELET-DECOMPOSITION-AND-ALPHA-STABLE-FUSION-14-320.jpg)

This article presents a novel method for fusing multifocal images using Laplacian pyramid decomposition and wavelet transformation, employing a selection rule based on alpha stable distance. The proposed method significantly improves the quality of the resulting fused images compared to existing techniques, as demonstrated through experiments on a dataset of 150 multifocus images. The results indicate that the new approach yields lower root mean square error (RMSE) values, suggesting superior fusion performance.