Downloaded 55 times


![1
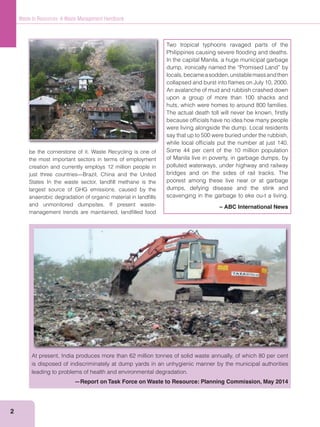
Waste has always been a perennial problem and its
management remains a big predicament up to this
day, since the amount of solid waste increases as
populations rise and economies develop. Today, the
total amount of waste generated annually worldwide
tonnes, the municipal solid waste is between 1.6 to
2.0 billion tonnes. [1] Also, the global impacts of solid
waste are growing fast as solid waste management
to about $375.5 billion in 2025. [2]
Basel Convention by UNEP define wastes “as
substances or objects, which are disposed of or
are intended to be disposed of or are required to be
disposed of by the provisions of national law”. Our
daily activities give rise to a large variety of different
wastes arising from different sources. Cleaning up of
waste contamination is much more expensive in the
long term as compared to its prevention at source.
Countries are facing an uphill challenge to properly
manage their waste with most efforts to reduce the
final volumes and generate sufficient funds for waste
management.
Waste management is needed for these countries
which is the joint responsibility of the Citizens,
Industries, the local governments and the pollution
control boards. Waste management comprises a
collective activity involving segregation, collection,
transportation, re-processing, recycling and disposal
of various types of wastes. Different wastes and
waste-management activities have varying impacts
on energy consumption, methane emissions, carbon
storage, ecological and human health. For example,
recycling reduces greenhouse gas emissions by
preventing methane emissions from landfills or open
dumps and preventing the consumption of energy for
extracting and processing raw materials.
Improper Waste Management is one of the main
causes of environmental pollution. The World Health
Introduction
the diseases faced by mankind today occur due to
prolonged exposure to environmental pollution. Most
of these environment related diseases are not easily
detected, and may be acquired during childhood
and manifested later in adulthood. Also, there are
social implication of waste due to deficiencies in
waste management, disproportionately affect poorer
communities as waste is often dumped on land
adjacent to slums. This unsound waste management
has health implications. Millions of waste pickers
are exposed to hazardous substances as they try
mercury and infectious agents from healthcare
facilities—as well as dioxins and other harmful
emissions released during the recovery of valuable
materials from e-waste—not only affect the health
of waste pickers, but also contribute to air, land and
water contamination.
With growing public awareness about waste-
related problems and with increasing pressure on
the government and urban local bodies to manage
waste more efficiently, the concept of waste as
“a material which has no use” is changing to “a
resource at a wrong place”. Cleaning up of waste is
much more expensive in the long run as compared
to its prevention at source. Mixed waste is useless
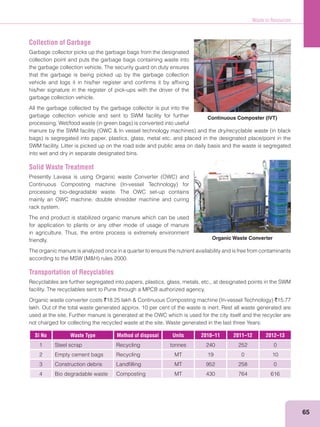
as a resource until waste separation at source is
practiced. Society has to think of ways to minimize
and put waste to other uses.
Industry-based waste management is one of the most
elaborate Waste Management procedures. It has an
annual turnover above $433 billion and engages
operations for different waste streams and different
phases of the waste life-cycle. It is considered
that the industry will further grow, especially in
developing countries, and recycling business will](https://image.slidesharecdn.com/wastemanagementhandbook-160622165900/85/Waste-management-handbook-12-320.jpg)
![Waste to Resources
3
waste is predicted to increase the landfill share of
global anthropogenic Greenhouse Gas emissions
from 8 to 10 per cent.[1]
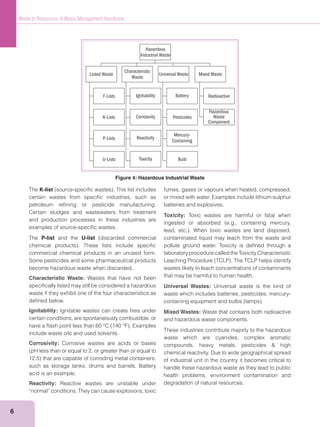
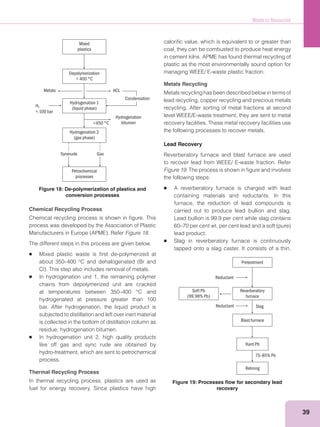
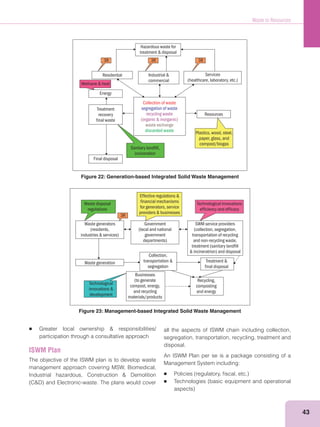
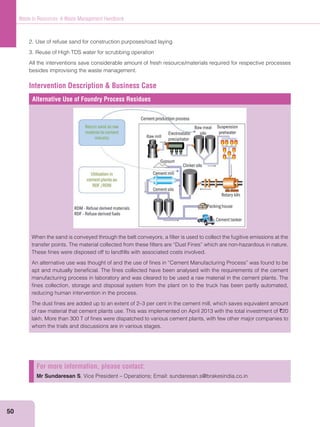
Classification of Waste
Managing waste in an environmentally sound, socially
satisfactory and a techno-economically viable manner
is Sustainable Waste Management. It is achieved
through strategic planning, institutional capacity
building, fiscal incentives, techno-economically
viable technologies, public-private partnerships
and community participation. Waste management
approaches differ for different types of wastes and
also for wastes in different geographical locations
such as urban, rural and hilly areas. While there are
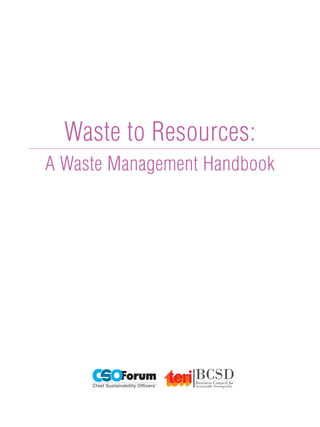
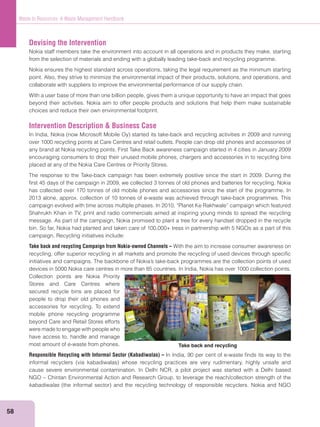
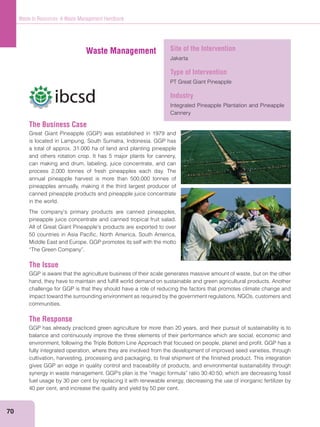
many ways to classify waste, for the purpose of this
paper we will classify waste based on its source
stream. Wastes such as domestic and industrial ones
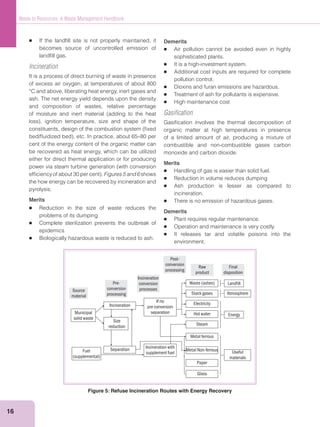
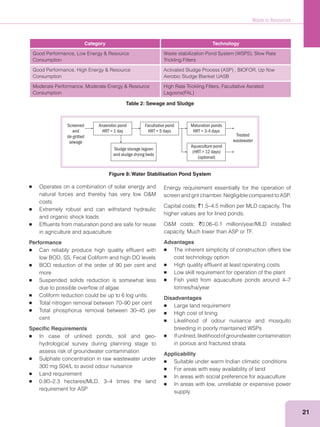
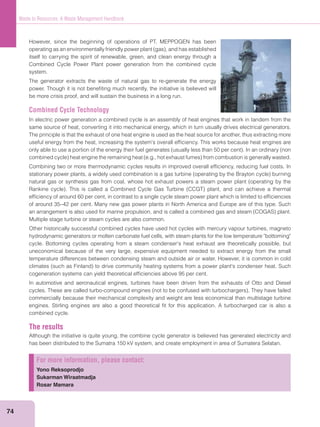
can be classified under the heads of urban, industrial,
biomedical and e-waste as shown in Figure 1. These
are generated during the extraction of raw materials,
manufacturing and processing of raw materials into
intermediate and final products, the consumption of
final products, and other human activities.
Urban waste
Urban Waste comprises of Municipal Solid Waste
Demolition waste.
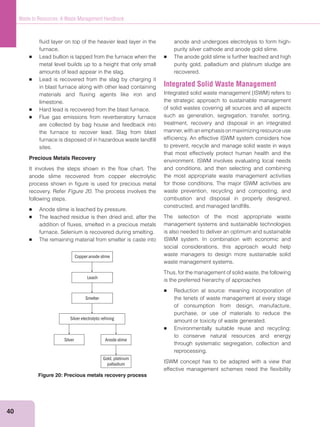
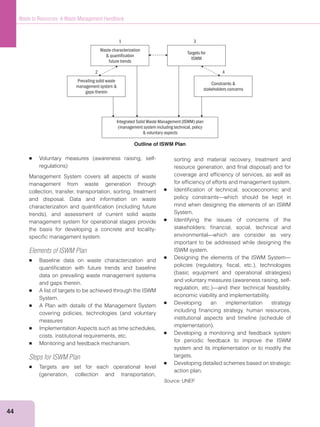
Municipal Solid Waste
Municipal Solid waste comprises of recyclable,
biodegradable as well as inert waste as shown in
Figure 2.[5] The biodegradable waste streams from
urban hotspots dominate the bulk of MSW mainly due
to exorbitant food and yard wastage from households.
Recycling is the recovery of useful materials, such
as paper, glass, plastic, and metals, from the trash
to use to make new products, reducing the amount
of virgin raw materials needed. Waste is the kind
of waste that is neither chemically and biologically
Construction
& Demolition
Non- Hazardous
Municipal
Solid Waste
Sewage &
Sludge
Hazardous
Industrial
Waste Water
Solid Solid
Urban Industrial
Waste
Biomedical E -Waste
Liquid Liquid
Figure 1: Classification of Waste
Municipal
Solid Waste
Bio-
Degradable
Kitchen
Waste
Vegetable
Waste
Garden
Waste
Plastic &
Paper
Glass
Tin Can &
Metals
Sand
Pebbles
Gravels
Recyclable Inert
Figure 2: Municipal Solid Waste](https://image.slidesharecdn.com/wastemanagementhandbook-160622165900/85/Waste-management-handbook-14-320.jpg)
![4
Waste to Resources: A Waste Management Handbook
reactive, nor undergoes decomposition. In most of
the Indian cities, the MSW collection, segregation,
transportation, processing and disposal is carried
out by the respective municipal corporations and the
state governments enforce regulatory policies.
To minimize the quantum of waste for disposal by
optimal utilization of the potential of all components,
MSW is done by adopting the “concept of 5-R”—
Reduce,Reuse,Recover,RecycleandRemanufacture
Municipal Solid Waste Management generates
energy and other useful products and ensures safe
disposal of residual waste.[4]
A major fraction of urban MSW in India is
annual generation of MSW continues to be dumped
without treatment, it will need 3,40,000 cubic meter
Considering the projected waste generation of 165
million tonnes by 2031, the requirement of land for
hectares of precious land, which our country cannot
afford.[4]
Sewage & Sludge
Solid waste going into landfills has a serious impact
on the environment, but disposal is not our only
concern. Waste water also needs to be managed in
order to reduce threats to public health, safety and
the environment. Sewage is a water-carried waste, in
solution or suspension, it is more than 99 per cent
water and is characterized by volume or rate of flow,
physical condition, chemical constituents and the
bacteriological organisms that it contains.
Sludge is the semi-solid precipitate produced in
wastewater treatment plants originating from their
process of treatment. Due to the physical-chemical
processes involved in the treatment, the sludge
tends to concentrate heavy metals and poorly
biodegradable trace organic compounds as well as
in nutrients such as nitrogen and phosphorous and
contains valuable organic matter that is useful when
Indian Scenario for Municipal Solid Waste
Municipal areas in the country generate 1,33,760
only 91,152 TPD waste is collected and 25,884
TPD treated. Considering that the volume of
waste is expected to increase at the rate of 5
per cent per year on account of increase in the
population and change in lifestyle of the people,
it is assumed that urban India will generate
2,76,342 TPD by 2021, 4,50,132 TPD by 2031
and 1,195,000 TPD by 2050. The challenge is
in managing this waste which is projected to be
165 million by 2031 and 436 million by 2050. The
CPCB report also reveals that only 68 per cent of
the MSW generated in the country is collected
of which, 28 per cent is treated by the municipal
authorities. Thus, merely 19 per cent of the
total waste generated is currently treated. The
untapped waste has a potential of generating
439 MW of power from 32,890 tonnes per day of
combustible wastes including Refused Derived
per day or 72 MW of electricity from biogas and
5.4 million metric tonnes of compost annually to
support agriculture.
—Central Pollution Control Board
(CPCB Report 2012–13)
soils are depleted or subject to erosion. The organic
matter and nutrients are the two main elements that
make the spreading of this kind of waste on land as a
fertiliser or an organic soil improver suitable.[9]
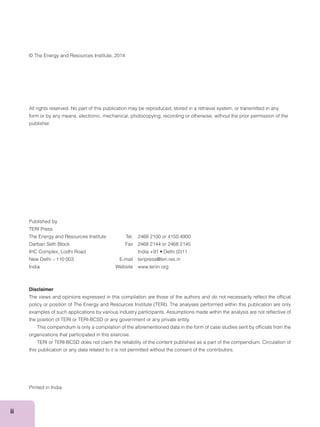
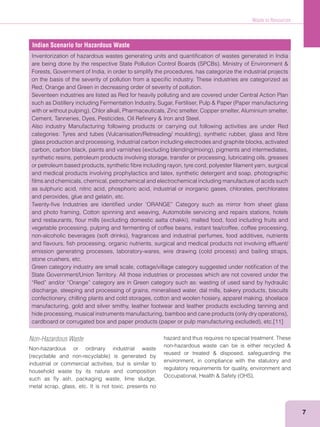
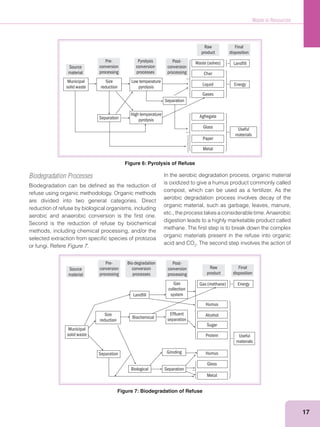
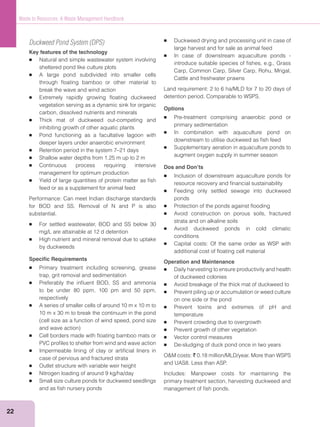
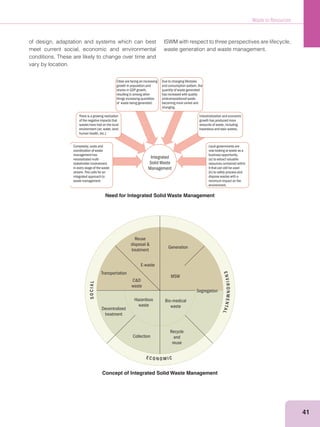
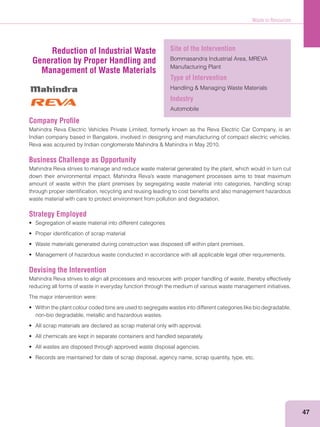
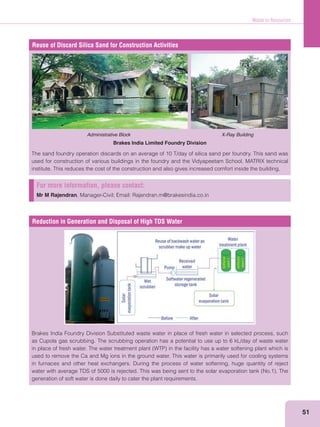
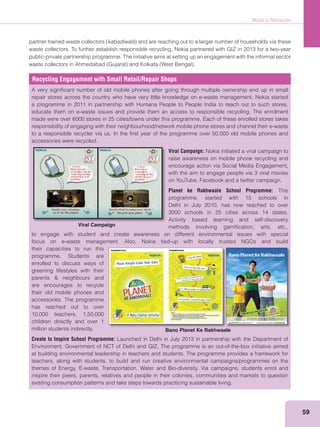
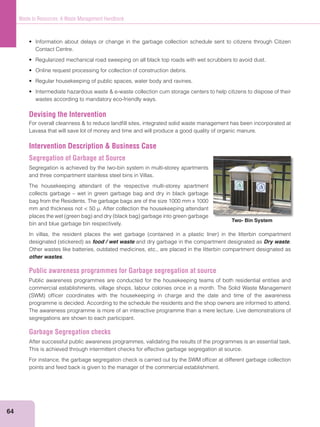
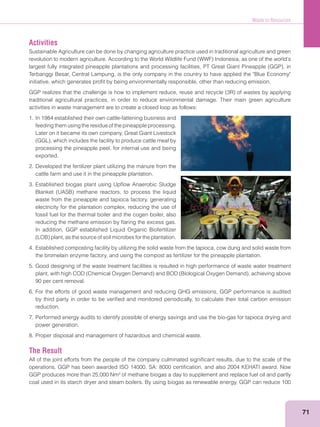
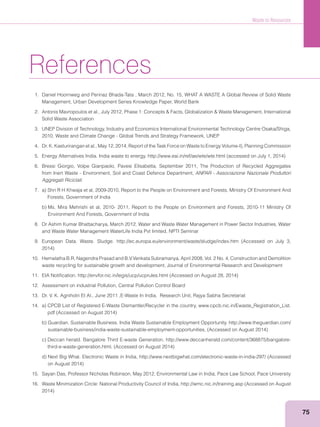
Construction & Demolition Waste
as the solid waste generated by the construction,
remodeling, renovation, repair, alteration or demolition
of residential, commercial, government or institutional
buildings, industrial, commercial facilities and
infrastructures such as roads, bridges, dams, tunnels,
railways and airports. Source based generation of
construction and demolition is shown in Figure 3.
high volume, low risk. It is commonly understood that](https://image.slidesharecdn.com/wastemanagementhandbook-160622165900/85/Waste-management-handbook-15-320.jpg)
![Waste to Resources
5
Construction
& Demolition
Construction
Waste
Civil
Infrastructure
Waste
Demolition
Waste
Demolition
of Building
Maintenance
Road Waste
Construction &
Maintenance
Excavation
Soil & Rocks
Digging
Activities
Earth Works
Industrial Waste
Industrial Waste can be classified as Hazardous,
Non-Hazardous and Waste Water. It can be
discarded commercial products, like cleaning fluids
or pesticides, or the by-products of manufacturing
processes.
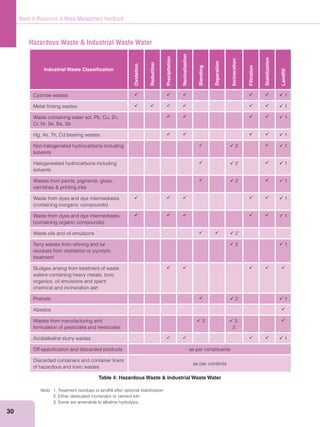
Hazardous Waste
Hazardous waste is divided into listed wastes,
characteristic wastes, universal wastes and mixed
waste as shown in Figure 4. Waste Identification
Process details about the process for identifying,
characterizing, listing and delisting hazardous
wastes.
Listed Wastes: Wastes that Environmental Protection
termed as Listed Wastes. The lists include the F-list
K-list
P-list and U-list
The F-list
identifies wastes from common manufacturing and
industrial processes, such as solvents that have been
used in cleaning or degreasing operations. Because
the processes producing these wastes can occur in
different sectors of industry, the F-listed wastes are
known as wastes from non-specific sources.
this waste can be considered a resource, either for
reuse in its original form or for recycling or energy
recovery. If suitably selected, ground, cleaned and
sieved in appropriate industrial crushing plants,
these materials can be profitably used in concrete.
portion of total solid waste production in the world.
demolition activity takes place, such as building,
roads, bridges, flyover, subway, remodeling, etc.,
this waste is heavy, has high density, often bulky and
occupies considerable storage space either on the
road or communal waste bin. It is not uncommon
to see huge piles of such waste stacked on roads
especially in large projects, resulting in traffic
congestion and disruption.[10]
Indian construction industry is highly employment
intensive and accounts for approximately 50 per cent
of the capital out lay in successive five year plans of
our country. The projected investment in this industrial
sector continues to show a growing trend.
Central Pollution Control Board has estimated
current quantum of municipal solid waste generation
in India to the tune of 62 million tonnes/annum of
which waste from construction industry accounts
for 25 per cent. Thus the total quantum of waste
from construction industry is estimated to be 12 to
14.7 million tonnes per annum.
Figure 3: Construction & Demolition Waste](https://image.slidesharecdn.com/wastemanagementhandbook-160622165900/85/Waste-management-handbook-16-320.jpg)
![8
Waste to Resources: A Waste Management Handbook
Industrial Waste Water
The liquid waste generated from Industrial Source
can be classified into four categories according to
nature of pollutant.
Organic pollution
Effluents generated from industries like dairies,
distilleries, tanneries, polymer processing units,
vegetable oil and food processing units, sugar
industries are rich in organic contents. Municipalities
and Domestic wastes are also rich in organic
constituents. They have High Biological oxygen
Dissolved Solids generated from Chemical
Industry, Fertilizer, Pharmaceutical and Pesticides
Toxic Chemicals from Electroplating, Coke –oven,
Cooling Water from Thermal Power Plants, Cable,
Rolling Mills, Plastic Mounting [12]
Biomedical Waste
from hospitals, healthcare facilities and health
research laboratories. BMW is estimated to be only
a small fraction of the MSW generation. About 80
per cent of this waste – called “general waste” – is
non-infectious and if segregated can be managed
as MSW. However, the remaining 20 per cent is
infectious and hazardous and hence is required to be
treated in dedicated facilities.
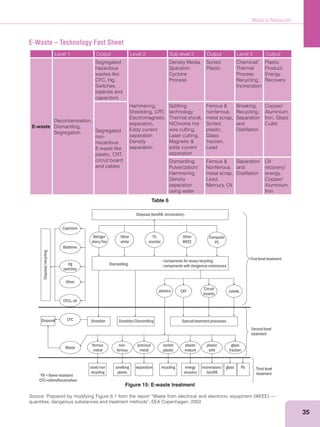
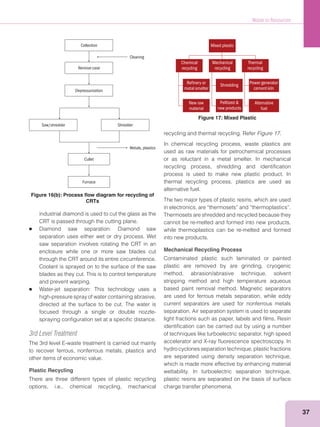
E-Waste
E-waste or electronic waste, broadly describes loosely
discarded, surplus, obsolete, broken, electrical or
electronic devices. The problem of e-waste has
becomeanimmediateandlong-termconcernasitcan
lead to major environmental problems endangering
human health. The Information Technology industry
in India has witnessed unprecedented growth in
recent years and has revolutionized the way we
live, work and communicate bringing countless
benefits and wealth to all its users. It has also led to
unrestrained resource consumption and an alarming
waste generation. [13]
Both developed countries and developing countries
like India face the problem of e-waste management.
The rapid growth of technology, upgradation of
technical innovations and a high rate of obsolescence
in the electronics industry have led to one of the fastest
growing waste streams in the world which consist
of end of life electrical and electronic equipment
products. It comprises a whole range of electrical
and electronic items such as refrigerators, washing
machines, computers and printers, televisions,
mobiles, i-pods, etc., many of which contain toxic
materials.
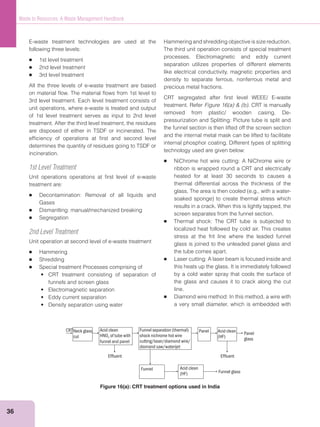
E-Waste Statistics in India
in India from old computers will jump by 500 per cent from 2007 and discarded mobile phones,
televisions will add to the numbers. According to the Assocham study, Bangalore generated over
MT of e-waste. The study of Assocham showed that as many as 8,500 mobile phones, 5,500 TVs and
3,000 personal computers are dismantled in Delhi every day for reuse of their component parts and
materials. In the capital alone, it is estimated that over 150,000 workers are employed in official and](https://image.slidesharecdn.com/wastemanagementhandbook-160622165900/85/Waste-management-handbook-19-320.jpg)
![Waste to Resources
9
Evolution of Laws
Indiaisthefirstcountryintheworldwhichhasprovided
for constitutional safeguards for the protection and
preservation of the environment. Environmental
law, post-independence, started growing its roots
conference, India represented by its head of state,
the only nation to do so, various laws were passed.
statute to be promulgated. [16]
The laws concerning Waste Management in India are:
Year Law
1974
1975
1977
1978
Cess Rules
1981
Act
1986
1989 The Manufacture, Storage and Import of
Hazardous Chemical Rules
1991 The Public Liability Insurance Act
1995 The National Environment Tribunal Act
1997 The National Environment Appellate
Authority Act
1998
2001
Rules
2008
2010 National Green Tribunal Act
2011
2011
Rules
The Water (Prevention and Control of Pollution) Act,
1974 was an effort to reduce and stop pollution in
rivers. The Air (Prevention and Control of Pollution) Act,
1981 is made on similar lines as the Water Act but it
goes a few steps forward in terms of details. It was
made to take appropriate steps for the preservation
of the natural resources of the earth which, among
other things, includes the preservation of the quality
of air and control of air pollution. It became the first
environmental act to not only put into words the
complete spectrum of environmental issues affecting
the air pollution in one act, but also gave guidelines
to not only protected the air but to also improved its
quality. [15]
The Environment (Protection) Act (EPA), 1986, is the first
Indian legislation to deal with environment protection
and its components in a holistic way. The Environment
effect to the decisions taken at the UN conference
on the human environment held in 1972; however,
many critics say that it was the Bhopal tragedy that
precipitated the enactment of the legislation. The EPA
provided a framework for management of hazardous
substances, prior assessment of the environmental
impact of major developmental projects, discharge of
industrial pollutants and effluents into the environment,
guidance for industrial sitting and management of
chemical accidents. [15]
The Public Liability Insurance Act, 1991 came on the
heels of the Bhopal Gas tragedy. Its main aim was to
provide relief to victims of industrial disaster victims.
It became obligatory for industrial set-ups to obtain
insurance which was equivalent to the capital needed
to establish the industry.[15]
Municipal Solid Wastes (Management and Handling) Rules
in 2000, making it mandatory for municipal authorities
to set up waste processing and disposal facilities,
identify sanitary landfill sites, and improve existing
dumpsites. The compliance however remains low,
mainly because of the inability of municipalities to
implement waste segregation, and lack of institutional
and financial means to implement waste processing
and disposal schemes. Efforts have been initiated for
bringing the informal waste recycling sector into the](https://image.slidesharecdn.com/wastemanagementhandbook-160622165900/85/Waste-management-handbook-20-320.jpg)
![10
Waste to Resources: A Waste Management Handbook
formal stream for waste collection and segregation to
form a cooperative/society and then get registered
with the CPCB.
To address industrial waste issues, the Ministry
notified the Hazardous Wastes (Management and
Handling) Rules
Rules were drafted to enable regulatory authorities
to control the handling, movement and disposal of
hazardous wastes generated within the country. The
amendment in 2000 and 2003 were largely aimed at
harmonizing the definition of hazardous waste with
provisions of the Basel Convention. The 2008 Rules
bring issues of e-waste management into the ambit of
hazardous waste management. [7]
The Biomedical Waste (Management and Handling) Rules
The Rules are based on the principle of segregation
lay out colour codes for containers, and treatment
and disposal options for 10 categories of waste.
The state governments have taken initiatives for
setting up of Common Biomedical Waste Treatment
waste. For treatment and disposal of Biomedical
common treatment and disposal facilities in operation
which were developed by the private entrepreneurs.
These are in addition to the 11,921 captive treatment
and disposal facilities developed within health
of bio-medical waste generated from HealthCare
It heralded a new dawn in environmental protection.
The court has been set in Bhopal and five benches
spread around the country with the sole mission to
quickly dispose of environmental protection cases. [7]
The E-waste (Management & Handling) Rules were
notified in May 2011, which became operational
from May 2012. Concept of Extended Producer
Responsibility was introduced in this rule, making
producers responsible for environmentally sound
management of their end of life products including
collection and their channelization to registered
dismantler or recycler. These rules will apply to every
producer, consumer or bulk consumer involved in the
manufacture, sale and purchase and processing of
electrical and electronic equipment or components as
specified in Schedule I, collection centre, dismantler
and recycler of E-waste. [17]
The Ministry of Environment and Forests notified
the draft “Plastics (Manufacture, Usage and Waste
Management) Rules, 2009” to replace the Recycled
Plastics Manufacture and Usage Rules, 1999
and usage of plastic carry bags. The draft rules
were widely published for public comments. An
expert committee was constituted by the Ministry to
examine these comments and to suggest economic
instruments. These Rules were finalized as Plastic
notified on February 4, 2011. [17]
Goa State Pollution Control Board has shut
down 101 industrial units and hotels for flouting
environmental rules and granted consent to
establish to nearly 230 new units. The closure
notices were issued to units for either working
without obtaining Consent to Operate, and
Establish, under Water and Air Acts, for creating
water and air pollution in the vicinity and for
sewage treatment facility.
—Oheraldo News Article, May 28, 2014](https://image.slidesharecdn.com/wastemanagementhandbook-160622165900/85/Waste-management-handbook-21-320.jpg)
![14
Waste to Resources: A Waste Management Handbook
Future Environmental Legislations
Municipal Solid Waste (Management and Handling)
Rules, 2013 (Draft Stage)
up with draft rules for management and handling of
municipal solid waste. After its implementation, it will
become mandatory for the municipalities in the state
to develop landfills and submit annual reports to state
government and pollution control board. Municipal
also have detailed guidelines and specifications for
setting up landfills.
Landfill sites shall be set up as per guidelines of
Ministry of Urban Development. As per the draft
existing landfill sites which are in use for more than
five years shall be improved and the landfill site shall
be large enough to last for at least 20–25 years.
Municipal authority responsible for implementation
of rules and for the necessary infrastructure
development for collection, storage, segregation,
transportation, processing and disposal of municipal
solid waste. State Pollution Control Board and
Pollution Control Committee will monitor the progress
of implementation of Action Plan and the compliance
of the standards regarding ground water, ambient air,
leachate quality and the compost quality. The new
rules will also make it mandatory for the municipal
authority to prepare solid waste management plan as
per the policy of the state government. [18]
Source: http://greencleanguide.com/2013/09/01/
draft-municipal-solid-waste-management-
and-handling-rules-2013/
Bio Medical Wastes (Management and Handling)
Rules 2011 (Draft Stage)
Ministry of Environment and Forests has revised the
Rules promulgated under the Environment Protection
Act of 1986. The Rules now called the Bio Medical
has been notified for information of the masses and
feedback received from all fronts would be considered
by the Central Government. The new Rules are
elaborate, stringent and several new provisions have
been added in it. These are not applicable for the
radioactive waste, hazardous waste, municipal solid
waste and battery waste, which would be dealt under
the respective rules.
required to obtain authorization. Prior to these rules,
only occupiers with more than 1000 beds required
to obtain authorization. Proper training has to be
imparted by the occupier to the healthcare workers
that the BMW is collected from all the Health Care
stored, treated and disposed in an environmentally
sound manner. The operators also have to inform the
prescribed authority if any HCEs are not handing the
segregated BMW as per the guidelines prescribed in
the rules.
The previous rules merely instructed the occupiers
and operators to submit an annual report to the
Prescribed Authority but no information on data to
be furnished in the report was mentioned. A detailed
format for Annual Report has thus been included in
the new Rules. [19]
Source: http://www.cseindia.org/node/3702
Hazardous Substances
(Classification, Packaging and Labeling)
Rules, 2011 (Draft Stage)
Hazardous Substances Rule identifies the key
responsibilities and obligations of consigner,
consignee, occupiers and other stakeholders. Every
Hazardous substances are classified in one or more
hazardous class with divisions as given in the rule.
identified for the hazardous substance. Any activity
involving hazardous substances must use the proper
label match report for chemical hazard classification,
and to provide for the transportation of chemicals and
identification updates chemical safety data sheets](https://image.slidesharecdn.com/wastemanagementhandbook-160622165900/85/Waste-management-handbook-25-320.jpg)
![Waste to Resources
15
The projections made by Planning Commission as
well as Ministry of Power upto 2031–32 indicate that
two-third of power generation in the country would
continue to depend on coal. The annual generation
of fly ash is expected to be around 225 million tonnes
by end of XII Five Year Plan Period and around 500
million tonnes by 2031–32. The Fly Ash Utilization
Notification was issued by Ministry in September
1999 to regulate the disposal of fly ash and ensure
its proper utilization. Restriction was imposed to the
extent that all brick kilns within the radius of 50 Kms
from coal/lignite based thermal power plants should
use 25 per cent flyash while making the bricks. A
second Notification making amendments was issued
in August, 2003 increasing the radius from the thermal
power plants to 100 kms. [7]
Type Components of
Waste
Process
Biodegradable
Kitchen, Garden and
Food Waste
Biological Treatment Aerobic processes, Anaerobic processes
Thermal treatment Incinerations, Pyrolysis systems,
Gasification systems
Transformation Mechanical Transformation, Thermal
Transformation
Recyclable
Plastic
RDF
Paper Dissolution, Screening, De-inking, Sterilization and bleaching process
Glass Vitrification Technology
Inert
Sand
The MSW contains organic as well as inorganic
matter. The latent energy of its organic fraction
can be recovered for gainful utilization through the
adoption of suitable waste processing and treatment
technologies. Table 1 shows the process associated
with different components of Municipal Solid Waste.
A few options could be:
Sanitary landfill
Incineration
Gasification
Biodegradation processes
Composting
Anaerobic digestion
Sanitary Landfill
Landfill implying the final disposal of the MSW on
land has several merits and demerits.
Merits
Reduces emission of methane and toxics
Lowers land and water table contamination
Reduces menace of birds and rodents
Controls fire hazards
Curbs the problem of bad odour in the inhabited
area
Demerits
Involves high initial cost of design and
commitment
Public may object to the site selected
Emits obnoxious gases in the atmosphere
Results in a loss of real estate value of the nearby
areas
Pressure of rodents and birds remains
Site selection depends upon the availability of
land at economically transportable distances.
Technology Factsheet
Municipal Solid Waste
Table 1: Municipal Solid Waste](https://image.slidesharecdn.com/wastemanagementhandbook-160622165900/85/Waste-management-handbook-26-320.jpg)
![20
Waste to Resources: A Waste Management Handbook
components, which are anaerobically digested under
thermophilic conditions. After the process of digestion
at a TS concentration of 30–35 per cent, further
stabilization occurs in 2–3 days. The overall retention
time for the process is 21 days and the biogas yield is
125–180 m3
per tonnes of input. As in the continuous
process, sludge dewatering provides Water for
making up the initial TS concentration and the dried
digested sludge is used as a soil conditioner after
suitable processing to reduce the size. The compost
quality is high due to the absence of pathogens as a
result of processing at thermophilic conditions and a
high C:N ratio 15:1.
VALOGRA process This process can handle the TS
content of the slurry in the range of 35–40 per cent
with the agitation of the reactor contents by occasional
supply of biogas under a pressure of 6–7 bars.
Biogas production in this case is 4 m3
/m3
of reactor/
day, as compared to the conventional process of 1
m3
/m3
reactor per day at a retention time of 15 days
under the mesophilic conditions. The conversion
efficiency is 50 per cent and digested sludge is used
as the combustion material after further processing.
BIOCEL process: A relatively cheaper and low-
maintenance dry anaerobic system is the BIOCEL
process where the organic fraction of solid waste in
the presence of methanogenic bacteria, is allowed to
remain under a plastic cover for 6–8 weeks resulting
in methane, yield of 3750 m3
per tonnes of organic
waste. Preliminary experiments and pilot plant studies
have been carried out by adopting this process.
Two-phase Digestion
The two-phase digestion process involves the
separation of the hydrolysis, acidification and
methanation phases that occur during the anaerobic
digestion of wastes and provides the optimal
conditions for maximum efficiency in both phases.
There are three types of two-phase processes that
have been developed for solid wastes.
The Hitachi process: The Hitachi process was
developed by Hitachi Ltd.
It involves a thermochemical pretreatment process
under alkaline conditions at 60 °C and with a pH of
9.8 for 3 hours. The liquefaction step involves a high
temperature of 60 °C and an alkaline pH of 7.5 to 8.2.
The total retention time for the process is 6–8 days.
The IBVL process The IBVL process was developed
for treating organic solid Wastes, particularly agro-
based products by the Institute for Storage and
Processing of Agricultural Produce, the Netherlands.
The system involves liquefaction and acidification
reactor and a methanogenic reactor: the up-flow
reaction occurs under mesophilic condition. The
digested effluent from the methanogenic reactor
is recirculated into the liquefaction/acidification
reactor resulting in the conversion of the volatile
of methane-producing microbes in the effluent of
the UASB. During this period, the methanogenic
reactor handles the acids being produced from a
just-started liquefaction/acidification reactor. The
rate of degradation becomes constant after a period
of 10–14 days. The digested residue is subjected
to aerobic composting before being used as a soil
conditioner. [21]
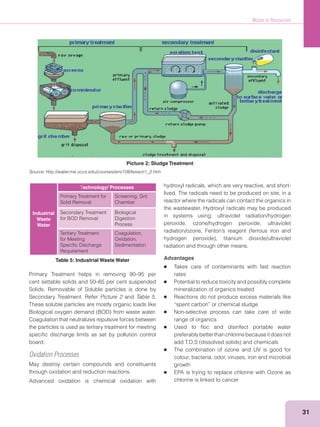
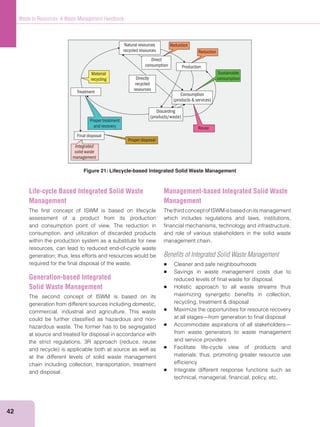
Sewage and Sludge
The categorization of the sewage treatment
technologies has been done on basis of their
performance and cost as shown in Table 2. Waste
Trickling Filters is used where land availability is
not an issue and winter temperature is not very low.
of reliability and are used in areas with land constraint.
High Rate Trickling Filters, Facultative Aerated
wherever the category 2 technology cannot be used.
Also few technology are categorized on the basis of
marginal performance which are not widely used like
UASB system with FPU for downstream treatment.
Waste Stabilisation Pond Systems (WSPS)
Key Features of the Technology
Simple to construct, operate and maintain
Does not involve installation of expensive electro-
mechanical equipment](https://image.slidesharecdn.com/wastemanagementhandbook-160622165900/85/Waste-management-handbook-31-320.jpg)
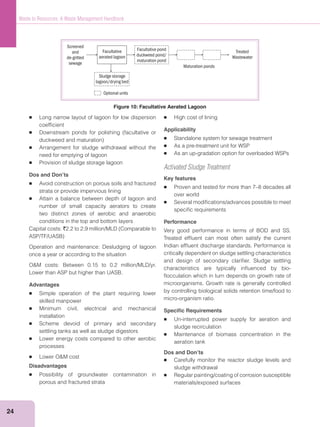
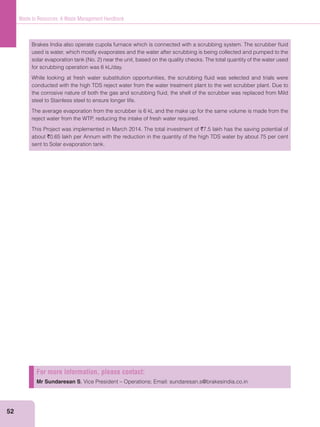
![26
Waste to Resources: A Waste Management Handbook
Energy Requirement: 220–335 kWh/ML treated.
Approximately double of ASP
Land requirement: 0.04 ha per MLD installed capacity
Much lower than ASP.
Sludge production: Thickened sludge @ 1000 kg/
3
Capital costs: `6.5–8.1 million per MLD capacity.
More than double that of ASP.
`0.86 million/year/
Advantages
Compact layout as a result of high rate processes
Higher aeration efficiency through co-current
diffused aeration system
Space saving as secondary sedimentation is
dispensed
Able to withstand fluctuations in flow rate and
organic loads
Compliance with stricter discharge standards
Effluent suitable for industrial applications, e.g.,
cooling water or ground water recharging
Effluent suitable for UV disinfection without
filtration
Absence of aerosol and odour nuisance in the
working area
Absence of corrosive gases in the area
Lower operation supervision enables lesser
manpower requirement
Disadvantages
Continuous and high chemical dosing in primary
clarification
Undigested sludge from primary clarification
requiring post treatment[22]
Sewage Screen & grit
chamber
Densadeg
reactor
Densadeg
clarifier
I II
Sludge digester
Allum Polyeleclrolyic
Sludge
Sludge drying beds
Blower
BIOFOR reactors
Treated
wastewater
Figure 12: BIOFOR Technology](https://image.slidesharecdn.com/wastemanagementhandbook-160622165900/85/Waste-management-handbook-37-320.jpg)
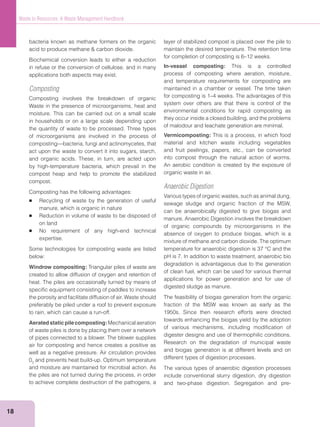
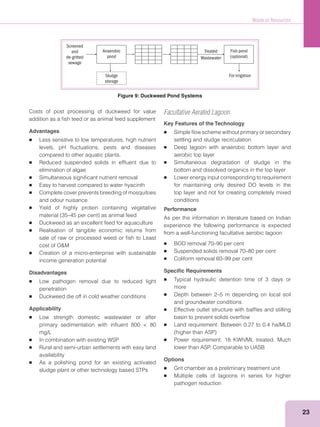
![Waste to Resources
29
using recycled aggregate for filler application,
care must be taken that it is free of contaminants
to avoid risk of ground water pollution use of
recycled aggregate are sub-base for road
construction is widely accepted in most of countries.
Bricks and masonry arise as waste during demolition.
These are generally mixed with cement, mortar or
lime. It is used in the construction of road base and
drayage layer, and mechanical soil stabilizers due to
its inertness after crushing and separation.
Tile materials recycling are almost identical to bricks.
Tile is often mixed with brick in final recycled product.
Metal waste is generated during demolition in the form
ofpipes,lightsheetmaterialusedinventilationsystem,
wires and sanitary fittings and as reinforcement in the
concrete. Metals are recovered and recycled by re-
melting. The metals involved onsite separation by
manual sorting or magnetic sorting. Aluminium can
be recovered without contamination, the material can
be directly sold to a recycler.
Wood recovered in good condition from beams,
window frames, doors, partitions and other fittings is
reused. However, wood used in construction is often
treated with chemicals to prevent termite infestation
and warrants special care during disposal other
problems associated to wood waste are inclusion
of jointing, nails, screws and fixings. In fact, wood
wastes have a high market value for special reuses
wood can be recycled/burned for energy recovery.
Scrap wood is shredded in-site/in a centralized plant.
Shredded wood is magnetically sorted for scrap
metal. Wood chips are stored so as to remain dry and
can be used as fuel. Also, it is used in the production
of various press boards and fiber boards and used
for animal bedding. Bituminous material arises from
road construction, breaking and digging of roads
for services and utilities. Recycling of Bituminous
material can be carried out by hot or cold mixing
techniques either at location or at a central asphalt
mixing plant it offers benefits like saving in use of
asphalt, saving of energy, reduction in aggregate
requirement, etc. Other miscellanies materials that
arise as waste include glass, plastic, paper, etc., can
be recovered and reused.
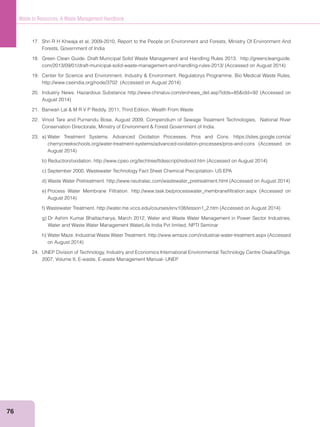
Disposal
not create chemical or bio-chemical pollution. Hence
maximum effort should make to reuse and recycle
them as explained above. The material can be used for
filling/leveling of low-lying areas. In the industrialized
countries, special landfills are sometimes created for
inert waste, which are normally located in abandoned
mines and quarries. [10]
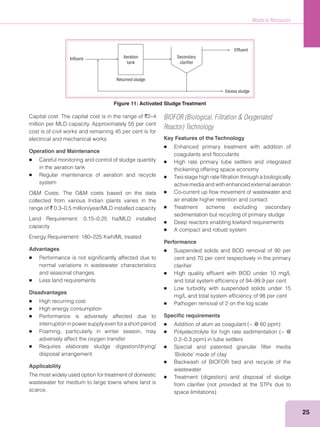
Mobile plant
Demolition
Pre-sieve
Ferrous
RC building material
& mineral mix
RC building
material
Sieving
machine
Sieving
machine
Impact
crusher
Overhead magnet
Figure 14: Mobile Plant](https://image.slidesharecdn.com/wastemanagementhandbook-160622165900/85/Waste-management-handbook-40-320.jpg)
![34
Waste to Resources: A Waste Management Handbook
media filters. A description of each along with the
pros and cons is as follows:
Indexing Paper Filters: A very fine paper filter
continuously unrolls while the waste stream flows
through the paper filter.
Advantages
the waste stream.
Disadvantages
Solids plug up the paper quickly requiring you to use
dispose of the contaminated paper safely.
Cartridge Filters is placed inside a canister or
enclosed tank.
Advantages
Provides excellent filtration even down to 5 microns
in size.
Disadvantages
As with indexing paper filters, they can plug quickly
and, depending on the dirt load, must be removed
often to clean or replace.
Media Filters: Other media, like sand or carbon, are
used to filter contaminants in the water.
Advantages
It provides reasonable removal of solids without
plugging up.
Disadvantages
It requires regular maintenance such as backwashing.
Oil-water separation: Oil-water separation is a
process that enhances the natural separation of oil
from water so the oil floats on the surface of the water.
Advantages
It effectively removes or skims “free” oils from the
water surface.
Disadvantages
It is not effective in removing emulsified oils that
are often trapped within the water molecules by
detergents or other cleaning agents.
Wastewater Evaporation
Like a pan of water on the stove, wastewater
subjected to heat is evaporated leaving the pollutants
to be skimmed off or disposed of as sludge. It
short, wastewater evaporators safely and naturally
eliminates the water portion of a waste stream leaving
behind only the gunk—usually about 5–10 per cent of
the total volume—to dispose of.
The technology use in wastewater evaporators is
systems with both technologies.
Advantages
a fraction left to dispose of.
Disadvantages
It still requires disposal of hazardous wastes plus
heating fuel costs can be expensive.
Electro-coagulation
This is a very effective process that removes
suspended solids, emulsified oils and heavy
metals from wastewater. Electro-coagulation uses
low-voltage DC current to effectively neutralize
the charges of the contaminants allowing them to
coagulate and separate from the waste stream.
Uses advanced electro-coagulation combined with
chemical flocculation to enhance and speed up the
process of removing constituents from waste water.
Advantages
When combined with other technologies, it produces
exceptional water quality with very little maintenance.
It successfully treats a very broad range of waste
streams and requires very little maintenance.
Disadvantages
Only a few manufacturers of environmental systems
truly understand this process and even fewer
know how to combine it with other water treatment
technologies.[23]](https://image.slidesharecdn.com/wastemanagementhandbook-160622165900/85/Waste-management-handbook-45-320.jpg)


The document is a comprehensive guide on waste management, focusing on converting waste into resources while addressing significant challenges faced in developing economies regarding waste disposal and recycling. It discusses various types of waste, such as municipal, industrial, and e-waste, along with management strategies like source segregation and technological innovations that promote recycling and pollution prevention. The guide also highlights the importance of collaboration among government, industries, and communities in achieving effective waste management practices.


