Downloaded 122 times

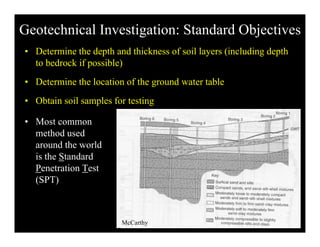
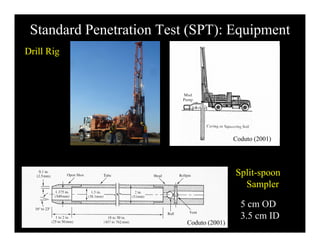
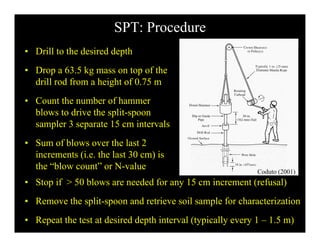
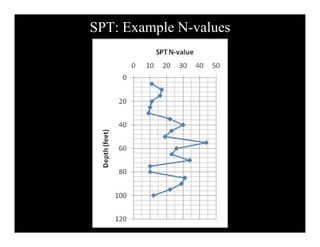

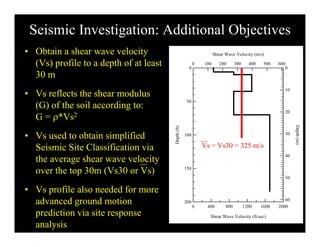
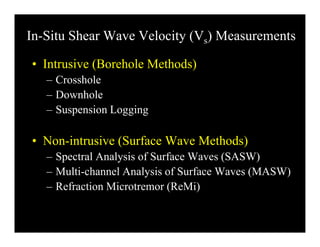
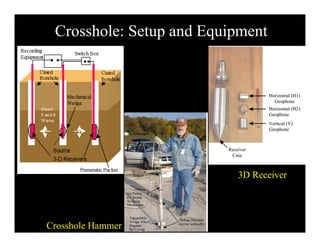
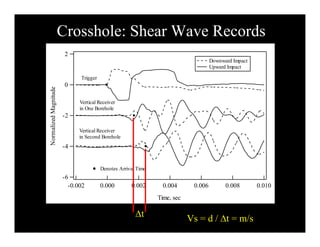
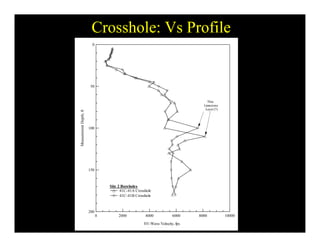
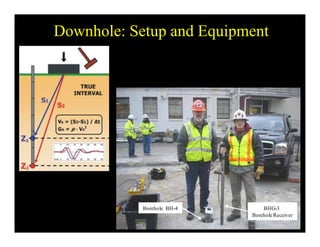
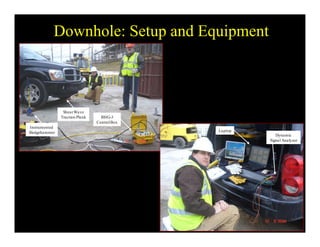
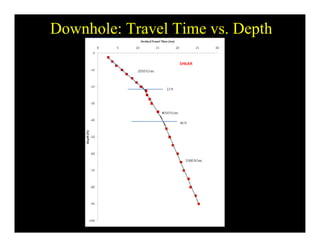
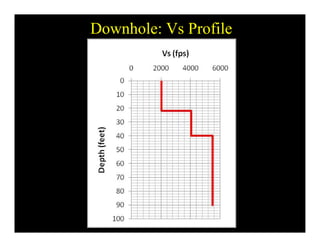
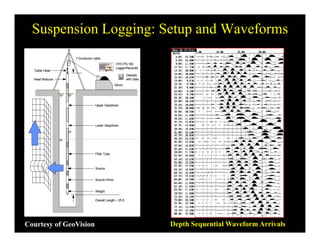
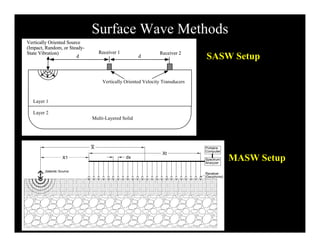


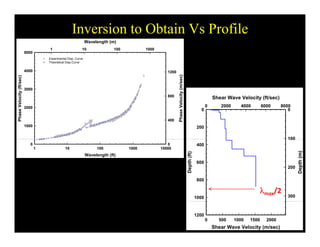

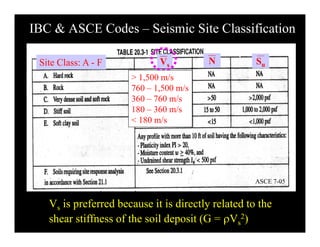
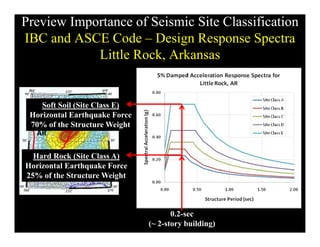
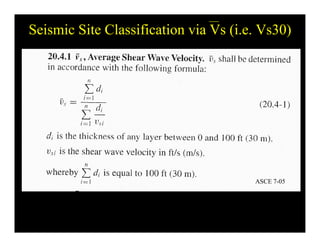
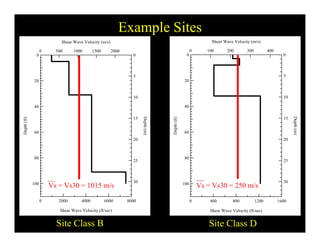
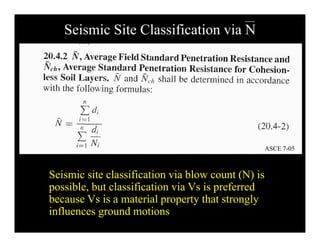


This document summarizes standard penetration testing (SPT) and shear wave velocity profiling, which are important geotechnical investigation techniques for seismic design. SPT involves driving a split spoon sampler into the ground using a hammer and measuring penetration resistance. Shear wave velocity profiling uses borehole, suspension, and surface wave methods to directly measure in-situ shear wave velocities, which are used to classify seismic soil sites according to building codes. Proper site characterization that includes SPT and shear wave velocity data is essential for evaluating soil properties and predicting earthquake ground motions at a site.


![Geotechnical Engineering-II [Lec #13: Elastic Settlements]](https://cdn.slidesharecdn.com/ss_thumbnails/13-181020124852-thumbnail.jpg?width=640&height=640&fit=bounds)


![Geotechnical Engineering-II [Lec #28: Finite Slope Stability Analysis]](https://cdn.slidesharecdn.com/ss_thumbnails/28-181125070402-thumbnail.jpg?width=640&height=640&fit=bounds)

![Geotechnical Engineering-II [Lec #7A: Boussinesq Method]](https://cdn.slidesharecdn.com/ss_thumbnails/7a-181020124807-thumbnail.jpg?width=640&height=640&fit=bounds)


