Downloaded 586 times


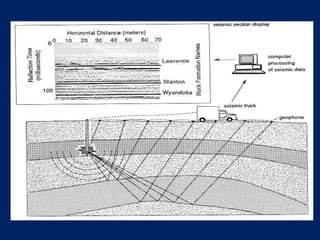
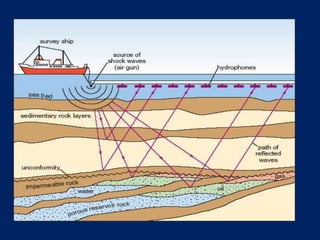

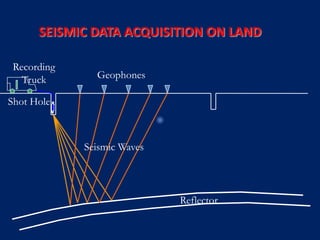


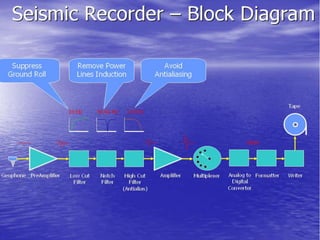
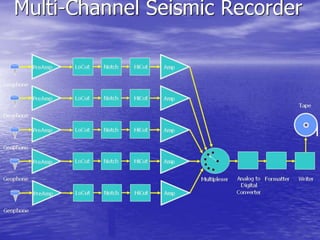


The document describes the seismic-wave travel time method, which is widely used in geophysical exploration for mapping subsurface structures and inferring the presence of petroleum traps. It covers the generation of seismic energy, types of surveys (refraction and reflection), and the technology and equipment involved, including geophones, hydrophones, and various seismic sources. Additionally, it discusses the advantages and disadvantages of different survey methods, noise types, and filtering techniques used to enhance seismic data quality.


