The document discusses voltage stability indices (VSIs) that are used to analyze voltage stability and predict voltage collapse in power systems. It provides a taxonomy and classification of common VSIs, including both Jacobian matrix-based and system variable-based indices. The document also presents the mathematical formulation and calculation algorithms for some example VSIs, including the Voltage Collapse Index, Stability Index, and Line Collapse Proximity Index. It describes testing some of these indices on the IEEE 14-bus test system using simulation tools to validate their theoretical behavior.
![1
International Journal of
Science, Engineering and Innovative Research Vol. 8, February 2016
Voltage Stability Indices
Taxonomy, Formulation and Calculation algorithm
Ebrahim Saadati1
, Ahmad Mirzaei2
1
Yazd University, Faculty of ECE
2
Yazd University, Faculty of ECE
(1
ebrahim.saadati@gmail.com)
Abstract- Modern power systems are operating closer to their
limits, due to load growth and maximum efficiency of usage of
transmission line capacity. Operation of power system under such
condition may endangers the voltage stability of network and
leads to voltage collapse. Voltage stability indices are used as an
efficient, accurate and uncomplicated method in static voltage
stability analysis. In this paper a review of most common line
voltage stability indices which previously studied in literature, is
provided. A model of IEEE-14 Bus System has been presented as
case study. The simulation tool used was DIgSILENT
PowerFactory and the indices were computed using the DPL.
Simulation results approved the theoretical background of
indices.
Keywords- Voltage stability, Voltage collapse, Line stability
index, Calculation algorithm, DIgSILENT Programming
language
I. INTRODUCTION
Electricity consumption growth, complexity and cost of
construction new transmission lines, causing power systems to
be more vulnerable than ever. The more efficient use of
transmission network has already led to a situation in which
many power systems are operated more often longer and closer
to voltage stability limits resulting in a higher probability of
voltage instability or collapse [1]. IEEE defines voltage
collapse as: the process by which voltage instability leads to
loss of voltage in significant part of the power system [2]. In
order to prevent a voltage collapse, there is a desperate need to
identify the methods which is used for predict occurrence of
this phenomenon.
Even though voltage instability is known for long time,
active work involving voltage stability started in 80’s [3] and
attracted the attention of many researchers up to now. Although
stability studies, in general require a dynamic model of the
power system, the static approaches is used widely for
assessment of voltage stability [4]. Static analysis is accurate
and less complex as it requires low computation time to carry
out system stability analysis [5].
Several analytical methods are available for measuring
voltage stability margin and prediction of voltage collapse
points. Static and dynamic bifurcation analysis [6,7], P-V and
Q-V curves (also called nose curves) [2,8], continuation power
flow (CPF) [9] and modal analysis [10,11], are popularly used
in voltage stability research. Another set of papers have studied
the voltage stability by define an index. Voltage stability
indices (also called voltage collapse proximity/prediction
indices), can used as a tool for identifying weakest area, critical
lines and the power stability margin.
VSIs can be used for online and offline purposes. Operators
would be able to observe the monitored value of indices which
change with system parameters and take the appropriate action.
So the online value of VSIs is used to prevent voltage
instability. Furthermore, before operation of power system,
planner and designer would be able to used offline value of
indices for network stability studies.
As expressed in [12,13], VSIs classified in two main
categories: jacobian matrix based and system variable based
VSIs. Table I illustrates a comparison of these two groups.
TABLE I. COMPARISON OF VOLTAGE STABILITY INDEX
Jacobian based VSI System variable based
Offline application Online application
Planner/Designer use Operator use
More computing time Less computing time
Proximity to voltage collapse Determining weak area
Jacobian matrix based VSIs can calculate the voltage
collapse point or maximum loadability limit and determine the
voltage stability margin, so the computation time is high and
they are not suitable for online assessment. On the other hand,
system variables based VSIs, which use the elements of the
admittance matrix and some system variables such as bus
voltages or power flow through lines, require less computation
and therefore these VSIs are adequate for online monitoring.](https://image.slidesharecdn.com/voltagestabilityindices-160803053657/85/Voltage-Stability-Indices-Taxonomy-Formulation-and-Calculation-algorithm-1-320.jpg)
![1
International Journal of
Science, Engineering and Innovative Research Vol. 8, February 2016
Voltage Stability Indices
Taxonomy, Formulation and Calculation algorithm
Ebrahim Saadati1
, Ahmad Mirzaei2
1
Yazd University, Faculty of ECE
2
Yazd University, Faculty of ECE
(1
ebrahim.saadati@gmail.com)
Abstract- Modern power systems are operating closer to their
limits, due to load growth and maximum efficiency of usage of
transmission line capacity. Operation of power system under such
condition may endangers the voltage stability of network and
leads to voltage collapse. Voltage stability indices are used as an
efficient, accurate and uncomplicated method in static voltage
stability analysis. In this paper a review of most common line
voltage stability indices which previously studied in literature, is
provided. A model of IEEE-14 Bus System has been presented as
case study. The simulation tool used was DIgSILENT
PowerFactory and the indices were computed using the DPL.
Simulation results approved the theoretical background of
indices.
Keywords- Voltage stability, Voltage collapse, Line stability
index, Calculation algorithm, DIgSILENT Programming
language
I. INTRODUCTION
Electricity consumption growth, complexity and cost of
construction new transmission lines, causing power systems to
be more vulnerable than ever. The more efficient use of
transmission network has already led to a situation in which
many power systems are operated more often longer and closer
to voltage stability limits resulting in a higher probability of
voltage instability or collapse [1]. IEEE defines voltage
collapse as: the process by which voltage instability leads to
loss of voltage in significant part of the power system [2]. In
order to prevent a voltage collapse, there is a desperate need to
identify the methods which is used for predict occurrence of
this phenomenon.
Even though voltage instability is known for long time,
active work involving voltage stability started in 80’s [3] and
attracted the attention of many researchers up to now. Although
stability studies, in general require a dynamic model of the
power system, the static approaches is used widely for
assessment of voltage stability [4]. Static analysis is accurate
and less complex as it requires low computation time to carry
out system stability analysis [5].
Several analytical methods are available for measuring
voltage stability margin and prediction of voltage collapse
points. Static and dynamic bifurcation analysis [6,7], P-V and
Q-V curves (also called nose curves) [2,8], continuation power
flow (CPF) [9] and modal analysis [10,11], are popularly used
in voltage stability research. Another set of papers have studied
the voltage stability by define an index. Voltage stability
indices (also called voltage collapse proximity/prediction
indices), can used as a tool for identifying weakest area, critical
lines and the power stability margin.
VSIs can be used for online and offline purposes. Operators
would be able to observe the monitored value of indices which
change with system parameters and take the appropriate action.
So the online value of VSIs is used to prevent voltage
instability. Furthermore, before operation of power system,
planner and designer would be able to used offline value of
indices for network stability studies.
As expressed in [12,13], VSIs classified in two main
categories: jacobian matrix based and system variable based
VSIs. Table I illustrates a comparison of these two groups.
TABLE I. COMPARISON OF VOLTAGE STABILITY INDEX
Jacobian based VSI System variable based
Offline application Online application
Planner/Designer use Operator use
More computing time Less computing time
Proximity to voltage collapse Determining weak area
Jacobian matrix based VSIs can calculate the voltage
collapse point or maximum loadability limit and determine the
voltage stability margin, so the computation time is high and
they are not suitable for online assessment. On the other hand,
system variables based VSIs, which use the elements of the
admittance matrix and some system variables such as bus
voltages or power flow through lines, require less computation
and therefore these VSIs are adequate for online monitoring.](https://image.slidesharecdn.com/voltagestabilityindices-160803053657/75/Voltage-Stability-Indices-Taxonomy-Formulation-and-Calculation-algorithm-1-2048.jpg)
![International Journal of Science, Engineering and Innovative Research, Volume 8, February 2016 3
WWW.IJSEIR.ORG Paper ID:ISSN: 4212-513X
C. Line Collapse Proximity Index (LCPI)
The relationship among the network parameters can be
expressed as:
Where A, B, C and D known as transmission parameters.
The current at the receiving end of the line is expressed as:
𝐼𝑗 =
𝑃𝑗 − 𝑗𝑄𝑗
𝑉𝑗
∗ = (𝑃𝑗 − 𝑗𝑄𝑗)/𝑉𝑗∠ − 𝛿𝑗 (13)
Also the sending end voltage can be written as:
𝑉𝑖∠𝛿𝑖 = (𝐴∠𝛼)(𝑉𝑗∠𝛿𝑗) + (𝐵∠𝛽)(𝐼𝑗∠0) (14)
By substituting the value of Eq. 13 into Eq. 14, we have:
𝑉𝑖∠𝛿𝑖 = (𝐴∠𝛼)(𝑉𝑗∠𝛿𝑗) + (𝐵∠𝛽)((𝑃𝑗 − 𝑗𝑄𝑗)/𝑉𝑗∠ − 𝛿𝑗) (15)
TABLE II. TAXONOMY OF VOLTAGE STABILITY INDICES
VSI Type Index Formula Stable Condition Unstable Condition Ref.
JacobianMatrixbased
𝑡 𝑐𝑐 = |𝑒 𝑐
𝑇
𝐽 𝐽𝑐𝑐
−1
𝑒 𝑐|
Quadratic Shape Linear Shape [14]
𝑖 =
1
𝑖0
𝜎 𝑚𝑎𝑥
𝑑𝜎 𝑚𝑎𝑥
𝑑𝜆 𝑡𝑜𝑡𝑎𝑙
⁄ 0 ≤ 𝑖 ≤ 1 𝑖 = 0 [15]
𝑇𝑉𝐼𝑖 = |
𝑑𝑉𝑖
𝑑𝜆
|
−1
𝑇𝑉𝐼𝑖 ≠ 0 𝑇𝑉𝐼𝑖 → 0 [16]
𝑉
𝑉0
⁄ 𝑉
𝑉0
⁄ = 1 𝑉
𝑉0
⁄ = 0 [17]
SystemVariablebased
Bus
Index
𝐿𝑗 = |
𝑆𝑗+
𝑌𝑗𝑗+
∗
𝑉𝑗
2| 𝐿𝑗 < 1 𝐿𝑗 = 1 [18]
𝑉𝐶𝐼𝑖 = (1 +
𝐼𝑖∆𝑉𝑖
𝑉𝑖∆𝐼𝑖
)
𝛼
𝑉𝐶𝐼𝑖 ≤ 1 𝑉𝐶𝐼𝑖 = 0 [19]
𝑆𝐼𝑗 = 2(𝑉𝑖 𝑉𝑗)2
− 𝑉𝑗
4
− 2𝑉𝑗
2
(𝑃𝑗 𝑅 + 𝑄𝑗 𝑋) − |𝑍|2
(𝑃𝑗
2
+ 𝑄𝑗
2
) 𝑆𝐼𝑗 ≥ 0 𝑆𝐼𝑗 < 0 [20]
𝑉𝐶𝑃𝐼 𝑘𝑡ℎ 𝑏𝑢𝑠 = |1 −
∑ 𝑉𝑚
𝑁
𝑚=1,𝑚≠𝑘
𝑉𝑘
| 𝑉𝐶𝑃𝐼𝑘𝑡ℎ < 1 𝑉𝐶𝑃𝐼𝑘𝑡ℎ = 1 [21]
Line
index
𝐿 𝑚𝑛 =
4𝑄𝑗 𝑋
(𝑉𝑖 sin(𝜃 − 𝛿))2
0 ≤ 𝐿 𝑚𝑛 < 1 𝐿 𝑚𝑛 = 1 [22]
𝐿𝑉𝑆𝐼 =
4𝑃𝑗 𝑅
(𝑉𝑖 cos(𝜃 − 𝛿))2
0 ≤ 𝐿𝑉𝑆𝐼 < 1 𝐿𝑉𝑆𝐼 = 1 [23]
𝐿𝑄𝑃 = 4 (
𝑋
𝑉𝑖
2) (
𝑋𝑃𝑖
2
𝑉𝑖
2 + 𝑄𝑗) 0 ≤ 𝐿𝑄𝑃 < 1 𝐿𝑄𝑃 = 1 [24]
𝐹𝑉𝑆𝐼 =
4𝑍2
𝑄𝑗
𝑉𝑖
2
𝑋
0 ≤ 𝐹𝑉𝑆𝐼 < 1 𝐹𝑉𝑆𝐼 = 1 [25]
𝑉𝐶𝑃𝐼(𝑃𝑜𝑤𝑒𝑟) =
𝑃𝑅
𝑃𝑅(𝑚𝑎𝑥)
0 ≤ 𝑉𝐶𝑃𝐼 < 1 𝑉𝐶𝑃𝐼 = 1 [26]
𝐿𝑆𝑍 = 2
|𝑍|. |𝑆𝑗|
|𝑉𝑖|2 − 2|𝑍|(𝑃𝑗 cos 𝜃 + 𝑄𝑗 sin 𝜃)
0 ≤ 𝐿𝑆𝑍 < 1 𝐿𝑆𝑍 = 1 [27]
𝑉𝑄𝐼𝑙𝑖𝑛𝑒 = 4
𝑄𝑗
𝐵𝑖𝑗. |𝑉𝑖|2 0 ≤ 𝑉𝑄𝐼 < 1 𝑉𝑄𝐼 = 1 [5]
𝑁𝑉𝑆𝐼 =
2𝑋√ 𝑃𝑗
2
+ 𝑄𝑗
2
2𝑄𝑗 𝑋 − 𝑉𝑖
2
0 ≤ 𝑁𝑉𝑆𝐼 < 1 𝑁𝑉𝑆𝐼 = 1 [28]
[
𝑉𝑖
𝐼𝑖
] = [
𝐴 𝐵
𝐶 𝐷
] [
𝑉𝑗
𝐼𝑗
] (12)](https://image.slidesharecdn.com/voltagestabilityindices-160803053657/85/Voltage-Stability-Indices-Taxonomy-Formulation-and-Calculation-algorithm-3-320.jpg)
![International Journal of Science, Engineering and Innovative Research, Volume 8, February 2016 4
WWW.IJSEIR.ORG Paper ID:ISSN: 4212-513X
𝐿𝐶𝑃𝐼 =
4𝐴 cos 𝛼 (𝑃𝑗 𝐵 cos 𝛽 + 𝑄𝑗 𝐵 sin 𝛽)
(𝑉𝑖 cos 𝛿)2 0 ≤ 𝐿𝐶𝑃𝐼 < 1 𝐿𝐶𝑃𝐼 = 1 [29]
Separating Eq. 15 into real and imaginary parts and
considering 𝛿𝑖 − 𝛿𝑗 = 𝛿 we obtain following quadratic
equation from real part:
𝑉𝑗
2
(𝐴. cos 𝛼) − 𝑉𝑗(𝑉𝑖 cos 𝛿) + (𝑃𝑗 𝐵 cos 𝛽 + 𝑄𝑗 𝐵 sin 𝛽) = 0 (16)
The roots of quadratic equation will be:
𝑉𝑗
=
−𝑉𝑖 cos 𝛿 ± √(𝑉𝑖 cos 𝛿)2 − 4𝐴 cos 𝛼 (𝑃𝑗 𝐵 cos 𝛽 + 𝑄𝑗 𝐵 sin 𝛽)
2𝐴 cos 𝛼
(17)
In order to satisfy the stability criteria, the discriminant of
Eq. 17 must be greater than zero and the LCPI defined by:
𝐿𝐶𝑃𝐼 =
4𝐴 cos 𝛼 (𝑃𝑗 𝐵 cos 𝛽 + 𝑄𝑗 𝐵 sin 𝛽)
(𝑉𝑖 cos 𝛿)2
(18)
The value of LCPI change from “0” at no load to “1” at
unstable condition.
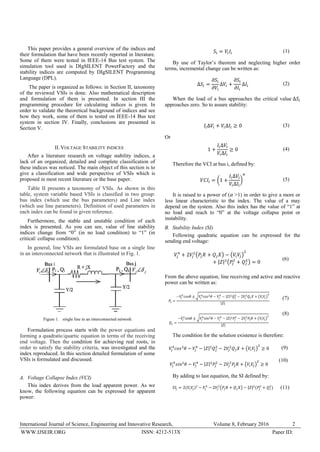
D. Novel Voltage Stability Index (NVSI)
In lossless condition, the current of line can be expressed
as:
𝐼𝑖𝑗 =
𝑉𝑖∠𝛿𝑖 − 𝑉𝑗∠𝛿𝑗
𝑗𝑋
(19)
Also the apparent power can be written as:
𝑆𝑗 = 𝑉𝑗
̅ 𝐼𝑖𝑗
∗̅̅̅̅ (20)
By substituting Eq. 19 in Eq. 20 we have a quartic equation
in term of receiving end voltage that the discriminant must be
greater than zero. So:
(2𝑄𝑗 𝑋 − 𝑉𝑖
2
)
2
− 4𝑋2
(𝑃𝑗
2
+ 𝑄𝑗
2
) ≥ 0 (21)
And the NVSI defined as:
𝑁𝑉𝑆𝐼 =
2𝑋√𝑃𝑗
2
+ 𝑄𝑗
2
2𝑄𝑗 𝑋 − 𝑉𝑖
2 ≤ 1
(22)
III. CALCULATION PROCEDURE
In order to find out effectiveness of line VSIs in a power
system, we should increase the load of network. In each step
we need to run a load flow and then by having the voltage,
current and power, calculate the index by use of their formula.
The flowchart of this algorithm is shown in Fig. 2.
DIgSILENT programming language (DPL) is used for
programming calculation procedure. The program is capable
to run on any optional power test system and it will give a
suitable conception from voltage stability of network based on
VSIs.
It’s necessary to mention that increase of load can be done in
all loads of power system or in specific load bus. If use the
second state, we can identify the weak bus in addition to the
critical lines.
Figure 2. VSIs calculation procedure algorithm
IV. TEST SYSTEM AND SIMULATION RESULT
A. Power system model
IEEE-14 Bus test system, is considered as the case study in
this paper and the network is simulated in DIgSILENT. Fig.3
illustrated single line diagram of this network.
B. Simulation result
VSIs calculation algorithm executed for considered case
study. Here the increase of reactive power in specific load bus
considered as the load pattern. In following some of plots and
results derived from executing programed algorithm are
presented.](https://image.slidesharecdn.com/voltagestabilityindices-160803053657/85/Voltage-Stability-Indices-Taxonomy-Formulation-and-Calculation-algorithm-4-320.jpg)
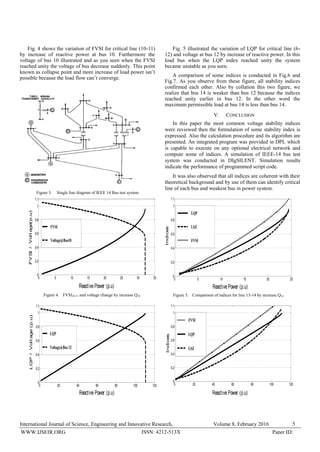
![International Journal of Science, Engineering and Innovative Research, Volume 8, February 2016 6
WWW.IJSEIR.ORG Paper ID:ISSN: 4212-513X
Figure 6. QP6-12 and voltage change by increase Q12 Figure 7. Comparison of indices for line 6-12 by increase Q12
REFERENCES
[1] P. Kundur, Power system stability and control, New York: McGraw-
Hill, 1994.
[2] M.K. Jalboub, A.M. Ihbal, H.S. Rajamtani, and R.A. Abd-Alhameed,
“Determination of static voltage stability-margin of the power system
prior to voltage collapse”, International Multi-Conference on
Systems, Signals and Devices (SSD), Sousse, pp. 1-6, March 2011.
[3] V. Ajjarapu and B. Lee, “Bibliography on voltage stability”, IEEE
Transactions on Power Systems, vol. 13, no. 1, pp. 115-125, 1998.
[4] C. Reis, A. Andrade, and F.P. Maciel, “Line stability indices for
voltage collapse prediction”, International Conference on Power
Engineering, Energy and Electrical Drives, Lisbon, pp. 239-243,
March 2009.
[5] F.A. Athowibi, and M.W. Mustafa, “Line voltage stability
calculations in power systems”, IEEE International Conference on
Power and Energy (PE Con2010), Kuala Lampur, Malaysia, pp. 396-
401, Dec. 2010.
[6] L. Guo, Y. Zhang, and Zh. Gang Wu, “An algorithm for voltage
collapse point based on the theory of transversality in power
systems”, Transmission and Distribution Conference and Exhibition,
Dalian, pp. 1-5, 2005.
[7] M.K.M. Rabby, and A.H. Chowdhury, “Bifurcation analysis to
identify voltage collapse in Bangladesh power system”, International
Conference on Informatics, Electronics & Vision (ICIEV), Dhaka, pp.
1-5, May 2013.
[8] Lee CY, Tsai SH, Wu YK. “A new approach to the assessment of
steady-state voltage stability margins using the P–Q–V curve”,
International Journal of Electrical Power & Energy Systems, vol. 32,
no. 10, pp. 1091–1098, 2010.
[9] V. Ajjarapu and C. Christy, “The Continuation Power Flow: A Tool
for Steady State Voltage Stability Analysis”, IEEE Transactions on
Power Systems, vol. 7, no. 1, pp 416-423, February 1992.
[10] B. Gao, G.K. Morison, and P. Kundur, “Voltage stability evaluation
using modal analysis”, IEEE Transactions on Power Systems, vol. 7,
no. 4, November 1992.
[11] H. Pradeep, and N. Venugopalan, “A study of voltage collapse
detection for power systems”, International Journal of Emerging
Technology and Advanced Engineering, vol. 3, no. 1, pp. 325-331,
Jan. 2013.
[12] F. Karbalaei, H. Soleymani and S. Afsharnia, “A comparison of
voltage collapse proximity indicators”, IPEC 2010 Conference
Proceedings, pp. 429-432, 27-29 Oct. 2010.
[13] M. Cupelli, C. Doig Cardet, and A. Monti, “Comparison of line
voltage stability indices using dynamic real time simulation”, IEEE
PES International Conference and Exhibition on Innovative Smart
Grid Technologies (ISGT Europe), Berlin, pp. 1-8, Oct. 2012.
[14] H.D. Chiang and R.J. Jumeau, “Towards a practical performance
index for predicting voltage collapse in electrical power system”,
IEEE Transactions on Power Systems, vol. 10, no. 2, pp. 584-592,
May 1995.
[15] A. Berizzi, P. Finanzzi, D. Dorsi, P. Marannino and S. Corsi, “First
and second order methods for voltage collapse assessment and
security enhancement”, IEEE Transactions on Power Systems, vol.
13, no. 2, pp.543-551, May 1998.
[16] A.C.Z. de Souza, C. A. Cañizares and V. H. Quintana, “New
techniques to speed up voltage collapse computations using tangent
vectors”, IEEE Transactions on Power Systems, vol. 12, no. 3,
pp.1380-1387, Aug. 1997.
[17] N.D. Hatziargyriou and T. Van Cutsem, “Indices for predicting
voltage collapse including dynamic phenomena”, technical report TF-
38-02-11, CIGRE, 1994.
[18] P. Kessel and H. Glavitsch, “Estimating the voltage stability of a
power system”, IEEE Transactions on Power Delivery, vol. PWRD-1,
no. 3, pp. 346-353, July 1986.
[19] M.H. Haque, “Use of local information to determine distance to
voltage collapse”, The 8th
International Power Engineering
Conference IPEC 2007, pp. 407-411, 2007.
[20] U. Eminoglu and M.H. Hocaoglu, “A voltage stability index for radial
distribution networks”, UPEC, pp.408-413, 2007.
[21] V. Balamourougan, T.S. Sidhu and M.S. Sachdev, “Technique for
online prediction of voltage collapse”, IEE Proceedings-Generation,
Transmission and Distribution, vol. 151, no. 4, pp. 453-460, July
2004.
[22] M. Moghavvemi and F.M. Omar, “Technique for contingency
monitoring and voltage collapse prediction”, IEE Proceedings-
Generation, Transmission and Distribution, vol. 145, no. 6, pp. 634-
640, November 1998.
[23] H. Naishan et al., “The analysis of abundance index of voltage
stability based circuit theory”, Guangxi Electric Power, pp.12-14,
Feb. 2006.
[24] A. Mohamed, G.B. Jasmon and S. Yusoff, “A static voltage collapse
indicator using line stability factors”, Journal of Industrial
Technology, vol. 7, no. 1, pp. 73-85, 1989.
[25] I. Musirin, and T.K.A. Rahman, “On-line voltage stability based
contingency ranking using fast voltage stability index (FVSI)”,
Transmission and Distribution Conference and Exhibition, vol. 2,
Oct. 2002.
[26] M. Moghavvemi, and O. Faruque, “Real-time contingency evaluation
and ranking technique”, IEE Proceedings Generation, Transmission
and Distribution, vol. 145, no. 5, pp. 517-524, Aug. 2002.
[27] M. Jalboub, H.S. Rajamani, R. Abd-AlHameed, and A. Ihabal
“Investigation of Voltage Stability Indices to Identify Weakest Bus
(TBC)”, 6th International JCST Conference on Mobile Multimedia
Communications, Portugal, pp. 682-687, Sept. 2010.
[28] R. Kanimozhi and K. Selvi, “A Novel Line Stability Index for
Voltage Stability Analysis and Contingency Ranking in Power](https://image.slidesharecdn.com/voltagestabilityindices-160803053657/85/Voltage-Stability-Indices-Taxonomy-Formulation-and-Calculation-algorithm-6-320.jpg)
![International Journal of Science, Engineering and Innovative Research, Volume 8, February 2016 7
WWW.IJSEIR.ORG Paper ID:ISSN: 4212-513X
System Using Fuzzy Based Load Flow”, Journal of Electrical
Engineering and Technology, vol. 8, no. 4, pp. 694-703, 2013.
[29] R. Tiwari, K.R. Niazi, and V. Gupta, “Line collapse proximity index
for prediction of voltage collapse in power systems”, International
Journal of Electrical Power & Energy Systems, vol. 41, pp. 105-111,
2012.
[30] Power System Test Archive-UWEE, University of
Washington.<http://www.ee.washington.edu/research/p
stca>.
BIOGRAPHY
Ebrahim Saadati was born in Isfahan, Iran. He graduated
from Yazd University, Iran, with master
degree in electrical power engineering in
2015. He is familiar with specialized
software, including Matlab/ Simulink
and DIgSILENT.
Ahmad Mirzaei was born in Yazd, Iran. He received the
Ph.D. degree in electrical engineering
from the Isfahan University of
Technology, Iran. He is with the faculty
of ECE, Yazd University, where he was
an Assistant Professor.](https://image.slidesharecdn.com/voltagestabilityindices-160803053657/85/Voltage-Stability-Indices-Taxonomy-Formulation-and-Calculation-algorithm-7-320.jpg)


