Download as PDF, PPTX


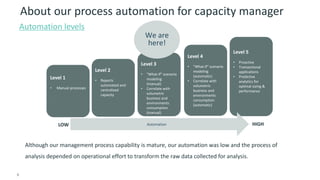
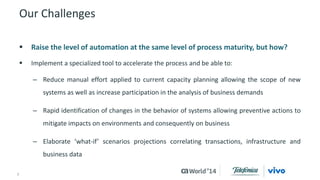
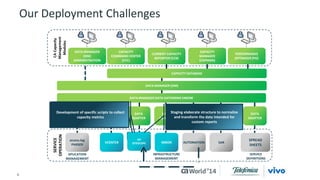
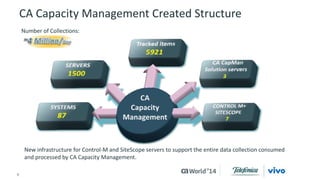
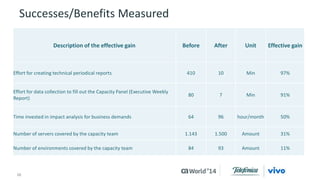


The case study discusses how Vivo, a major telecommunications company in Brazil, optimized its IT capacity management through CA Capacity Management to enhance infrastructure usage, automate processes, and comply with regulatory standards. This initiative reduced manual effort, expedited responses to business requests, and improved overall efficiency in capacity planning, which significantly increased the number of servers and environments managed. Vivo's ongoing goals include further automation and predictive analytics for improved infrastructure performance.


![5G Explained! A High Level Overview [Introduction]](https://cdn.slidesharecdn.com/ss_thumbnails/5gexplainedahighleveloverview-260119165306-cc137a3e-thumbnail.jpg?width=640&height=640&fit=bounds)


