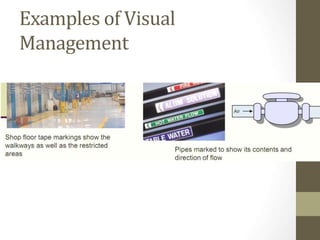
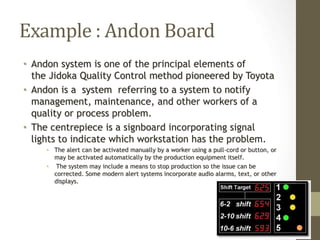
Visual Management
& Control
a picture is worth a thousand words
What’s Wrong With This ?
What Do You Do When It Goes
Green
Visual Display & Control
Visual display relates information and data to employees in
the area.
 For example, charts showing the monthly revenues of the
company or a graphic depicting a certain type of quality issue that
group members should be aware of.
A visual control is intended to actually control or guide the
action of the group members.
 Examples of controls are readily apparent in society: stop signs,
handicap parking signs, no smoking signs, etc.
 Visual controls describe workplace safety, production throughput,
material flow, quality metrics, or other information
Audio signals in the factory are also very important because
they signal malfunctioning equipment, sound warnings before
the start of machine operation, or other useful information.
Benefits of Visual Management
Visual management techniques express information in a way
that can be understood quickly by everyone.
Visual displays and controls help keep things running as
efficiently as they were designed to run.
Sharing information through visual tools helps keep
production running smoothly and safely
Visual information can also help prevent mistakes. Colour
coding is a form of visual display often used to prevent error
The most important benefit of a visual factory is that it shows
when something is out of place or missing
Examples of Visual
Management
Colour-coded pipes and wires
Painted floor areas for good stock, scrap, trash, etc.
Shadow boards for parts and tools
Indicator lights
Workgroup display boards with charts, metrics, procedures,
etc
 Communicating goals and objectives
 Publishing results of continuous improvement efforts
Production status boards
Direction of flow indicators
Indicate the quantity or the maximum amount of inventory
Provide a document form that tells employees the items so
they can distinguish them from other items.
Examples of Visual
Management
Shadow Boards
Inventory Control
Workgroup Display Boards
SOP Displayed at Workplace
Visual Control
Continuous Improvement
Board
Example : Andon Board
• Andon system is one of the principal elements of
the Jidoka Quality Control method pioneered by Toyota
• Andon is a system referring to a system to notify
management, maintenance, and other workers of a
quality or process problem.
• The centrepiece is a signboard incorporating signal
lights to indicate which workstation has the problem.
• The alert can be activated manually by a worker using a pull-cord or button, or
may be activated automatically by the production equipment itself.
• The system may include a means to stop production so the issue can be
corrected. Some modern alert systems incorporate audio alarms, text, or other
displays.
Maintenance Boards
Example of a Hospital
A Visual Workplace is a More
Productive, More Dynamic &
More Mistake-Free
Workplace

visual control and management.ppt

  • 1.
    Visual Management & Control apicture is worth a thousand words
  • 3.
  • 4.
    What Do YouDo When It Goes Green
  • 5.
    Visual Display &Control Visual display relates information and data to employees in the area.  For example, charts showing the monthly revenues of the company or a graphic depicting a certain type of quality issue that group members should be aware of. A visual control is intended to actually control or guide the action of the group members.  Examples of controls are readily apparent in society: stop signs, handicap parking signs, no smoking signs, etc.  Visual controls describe workplace safety, production throughput, material flow, quality metrics, or other information Audio signals in the factory are also very important because they signal malfunctioning equipment, sound warnings before the start of machine operation, or other useful information.
  • 6.
    Benefits of VisualManagement Visual management techniques express information in a way that can be understood quickly by everyone. Visual displays and controls help keep things running as efficiently as they were designed to run. Sharing information through visual tools helps keep production running smoothly and safely Visual information can also help prevent mistakes. Colour coding is a form of visual display often used to prevent error The most important benefit of a visual factory is that it shows when something is out of place or missing
  • 7.
    Examples of Visual Management Colour-codedpipes and wires Painted floor areas for good stock, scrap, trash, etc. Shadow boards for parts and tools Indicator lights Workgroup display boards with charts, metrics, procedures, etc  Communicating goals and objectives  Publishing results of continuous improvement efforts Production status boards Direction of flow indicators Indicate the quantity or the maximum amount of inventory Provide a document form that tells employees the items so they can distinguish them from other items.
  • 8.
  • 9.
  • 10.
  • 11.
  • 12.
  • 13.
  • 14.
  • 15.
    Example : AndonBoard • Andon system is one of the principal elements of the Jidoka Quality Control method pioneered by Toyota • Andon is a system referring to a system to notify management, maintenance, and other workers of a quality or process problem. • The centrepiece is a signboard incorporating signal lights to indicate which workstation has the problem. • The alert can be activated manually by a worker using a pull-cord or button, or may be activated automatically by the production equipment itself. • The system may include a means to stop production so the issue can be corrected. Some modern alert systems incorporate audio alarms, text, or other displays.
  • 16.
  • 17.
    Example of aHospital
  • 18.
    A Visual Workplaceis a More Productive, More Dynamic & More Mistake-Free Workplace