The goal of visual management is to translate shop floor processes and production statuses into easy-to-understand visual overviews. Think of it as manufacturing's scoreboard. With one glance, the whole team can get an understanding of a factory's performance
LECTURE maintenance management is important 1.pptx
Visual Management by Samsher Singh.pptx
1. Visual Management
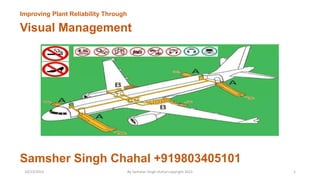
Improving Plant Reliability Through
Samsher Singh Chahal +919803405101
10/23/2023 By Samsher Singh chahal copyright 2023 1
2. Visual Management
Visual management is the display of information in the workplace to inform teams, enforce work standards, and highlight or
prevent problems. There are many ways to use visual management, and this concept is deeply embedded in Lean thinking
Visual management system is designed to create a visual workplace – a work environment that is self- explaining, self-ordering,
self-improving. A good 5S condition is a clean, well-ordered workplace that is the foundation of improvement.
10/23/2023 By Samsher Singh chahal copyright 2023 2
3. Visual Management
Research shows that people tend to learn and
process information more visually. Our Brains
simply respond better and faster to colors,
shapes, patterns, graphics and pictures
The aim is to enable anyone working In the
workplace to be assess the current situation at
a glance.
This should bring the workplace to the point
where all problems, abnormalities and waste to
be immediately recognized
Employees need visuals that show what is
expected from them and to keep them informed
about production status and other goals
Visual Management Can also be used to share
goals and ideas, indicate safety risks, promote
safe behaviors at work, and to report and
kaizen progress.
10/23/2023 By Samsher Singh chahal copyright 2023 3
4. Visual Management
Lean Organization rely heavily on visual
management to defect abnormalities, reinforce
standards, and ensure stability and safety are
Maintained in the workplace.
A lean leader should ensure that these visuals
are useful and are being used constantly
A Good Illustration of visual management are
road signs, just as road sings are easier to
understand than written signs, workplace
visuals are easier to understand than written
instructions, Traffic lights and lane markers on
the road.
The messages they convey are so clear that
when you see a traffic light for example, you
know exactly what you should be doing.
Therefore, effective workplace visuals can have
positive impact on Productivity, Safety, Quality.
And on- time delivery.
10/23/2023 By Samsher Singh chahal copyright 2023 4
5. Visual Management Benefits
1. Improved Safety and Ergonomics
2. Continuous Improvement
3. Sets a Baseline for Standard work
4. Less Defects
5. Satisfy Consumer Demand
6. Quick Changeover and Less Downtime
7.Create Workflow
8. Reduce Waste ad Improve Productivity
10/23/2023 By Samsher Singh chahal copyright 2023 5
6. Visual Management
Two Tools of visual Management
Displays
To make staff aware of related data and
information
Charts, graphs etc.
Controls
To guide the action of staff members
Sign boards, do’s and don’ts signs
10/23/2023 By Samsher Singh chahal copyright 2023 6
7. Phase of Visual Management
4. Visual Control
2. Visual Display
3. Visual Measures
1. Workplace Organization
10/23/2023 By Samsher Singh chahal copyright 2023 7
8. 1. Workplace Organization
WPO is a vital link to continuous improvement
and combination of both 5S and Visual
Management
It Would be very difficult to improve and implement
lean manufacturing principles such as quick
changeover. Low inventories. FIFO, JIT, and many
more, Without workplace organization.
The 5S’s are an important part of the Workplace
organization process
10/23/2023 By Samsher Singh chahal copyright 2023 8
9. 2. Visual Display
It is a method to visually communicate important
information in the workplace. It contain information
regarding safety, Quality, Operations, Equipment, Work
Environment, Progress /achievements.
• Benefits:-
Make work safer and easier
Communication information about performance
Makes standards visible
Makes Problems recognizable
Creates a shared knowledge base
10/23/2023 By Samsher Singh chahal copyright 2023 9
10. 3. Visual Measures
Visual measures indicator of performance
measurement that allow everyone to know the score
and help them to track the work
In this, Company uses some standard measurement
tools and indicators to track the activity and goals like
Changeover Clock
Downtime Clock
Production Counters
Process Capability Logo
Error Proof Symbols
Bottleneck Symbols
P.I. Indicator
Current Part Running
Lost Time Accidents
Limbo Bars
5S Audit
BOS Charts
10/23/2023 By Samsher Singh chahal copyright 2023 10
11. 4. Visual Control
Visual Controls are any device or symbol that effectively
places information at the point of use which create a
mistake - proofed environment to Promote easy
adherence to standards
Followings are some tools to use in visual control :-
Indicators
Labels
Meters
Scales
Lights
10/23/2023 By Samsher Singh chahal copyright 2023 11
12. Process For Development of Visual Workplace
Input
Confirm &
share clear
understanding
of customer
needs
Confirm
optimum
process to add
value, add &
ensure flow
Identify
information
needed by
staff to operate
an effective &
efficient
process
Identify most
appropriate
tools to
maximize
visual
management
Apply tools
and review
value with staff
Out put
(workplace)
10/23/2023 By Samsher Singh chahal copyright 2023 12
13. Visual Management Tools
Visual control
boards
Andon
Footprints Red tagging
10/23/2023 By Samsher Singh chahal copyright 2023 13
14. 1. Visual Board
A color –coded, Physical visual control system used for
monitoring of shop- floor activities and KPIs.
Use of Visual Control board:-
Visual boards are used as activators and data communication
centre.
The visual board area is used for shop-floor meetings.
A centre of periodical progress reviews and updates.
Used to drive the business processes from the boardroom to the
shop floor
Benefits of visual control board:
It quickly gives visibility to the progress of each tasks for further
action
Identifies the resources and activities being undertaken
10/23/2023 By Samsher Singh chahal copyright 2023 14
15. 1. Visual Board
Red zone indicates the supplier is on the verge of not
satisfying their customer. Very low level of goods
maintained
Yellow zone indicates customer requirements are being
met. Low level of finished good maintained
Green zone indicates the customer’s needs are being
fulfilled. Supplier is building more than the customer is
requiring and it may be time to stop production until
demand is more in line with supply
Other pertinent information (e.g. Quality performance)
would be contained in the information
The Cards hanging on the hooks in the colored zones
reflect the part number identified in the section, a given
quantity of material in one container. When a card is on
the hook it indicates an empty container
10/23/2023 By Samsher Singh chahal copyright 2023 15
16. 2. Andon
Andon (Japanese for lantern) is a tool for visual
management and refers to a system of signals used to
indicate the operational status (at a glance) of a
machine or work center.
• Benefits
Reduces operation & maintenance costs by identifying
problems before they become major issues.
Increases equipment availability by making downtime issues
more visible, thus prompting immediate rectification to the
issues.
Supports jidoka implementation by making the problem status
visual
10/23/2023 By Samsher Singh chahal copyright 2023 16
17. 2. Andon
Andon
Text
-Display production data in
real time.
-Calculate shift efficiencies
and production targets
Graphics
-Ideal for stop/wait/go signaling in busy
factories
-Boost health and safety
Coded signal lights
-Green- No problem
-Yellow- Situation requires attention production flow at risk
-Red – Production stoppage immediate assistance required
10/23/2023 By Samsher Singh chahal copyright 2023 17
18. 3. Footprints
It is a markings on the floor or work area outlining
specifically where items should be placed .
• Benefits
To ease employees during storage or retrieval
It avoids employees wasting time looking for things or pondering
their next move.
The workplace becomes clean and better organized.
Operation on the shop floor and office become easier and safer,
Visible location of parts or equipment for easy traceability and
save time of searching
10/23/2023 By Samsher Singh chahal copyright 2023 18
19. 3. Footprints
Light Blue for
raw material White for equipment
Black for
finished part
Red for non-
conforming
part
Yellow for work area border
10/23/2023 By Samsher Singh chahal copyright 2023 19
20. 4. Tagging
Tagging is a method that involves placing tags on items
to designate their status
It us used to identify unnecessary items that need ti be
either thrown out, recycled, sold or relocated.
They are especially useful as a visual management tool
as they easily communicate visually to other staff
members that the tagged items are unneeded/
unwanted
5S short event :- red tagging on items which are
unwanted or to be removed see the pic.
10/23/2023 By Samsher Singh chahal copyright 2023 20
21. 4. Tagging
Above :- Tagging (common called ‘FUGUAI
Tagging’) of production equipment during initial
cleaning in TPM activities
Below :- Tag is removed only after repair is made
10/23/2023 By Samsher Singh chahal copyright 2023 21
22. Floor Color Coding Standards
These Colors are widely accepted and comply with international standard
Aisle ways and traffic lanes
Scrap, Rework and Red tag
Material or product held for inspection
Raw materials Work in Progress
Finished Goods
Areas to be kept clear for safety reasons Physical and health risk areas
Areas to be kept clear for operational
reasons
10/23/2023 By Samsher Singh chahal copyright 2023 22
23. Example
Pipe Marking and Color Coding Standards
Pipe marking communicates all the necessary information about the pipeline in workplace.
Arrows are used to indicate the flow direction while colors often indicate the nature of the content
You may also post the labels on the pipelines
These colors are widely accepted and comply with international standards
10/23/2023 By Samsher Singh chahal copyright 2023 23
24. Example
Colored sleeves can be used to identify all the tools within a particular kit and team area. This will help
reducing the time spent looking for lost tools
10/23/2023 By Samsher Singh chahal copyright 2023 24
25. Example
Transparent machine guards and covers will enable
to see the running process of the machine, and as a
result, the machine will be stopped less frequently.
It is recommended to post Visual work- related
instructions trouble logs at every machine
10/23/2023 By Samsher Singh chahal copyright 2023 25
26. Example
Making gauges, oil levels and lube points are examples
of visual controls that enable employees to easily defect
abnormalities and out of specification condition
Color coding can be applied to gauges and other
measuring devises to visually monitor whether
process parameters remain within acceptable or
safe ranges
10/23/2023 By Samsher Singh chahal copyright 2023 26
27. Meetings
Daily meetings can be conducted in front of the board
to discuss the previous day’s issues and plan for the
work ahead
Reviewing the board regularly is very important for the
meeting to be productive. Data should be collected on a
daily basis to update the board
10/23/2023 By Samsher Singh chahal copyright 2023 27
28. Visual management is a Collaborative process, and people engagement is key to the contribution they will provide
later. Listen to them, and let them own the visuals
10/23/2023 By Samsher Singh chahal copyright 2023 28
29. Thank you for listening !
10/23/2023 By Samsher Singh chahal copyright 2023 29