Downloaded 183 times
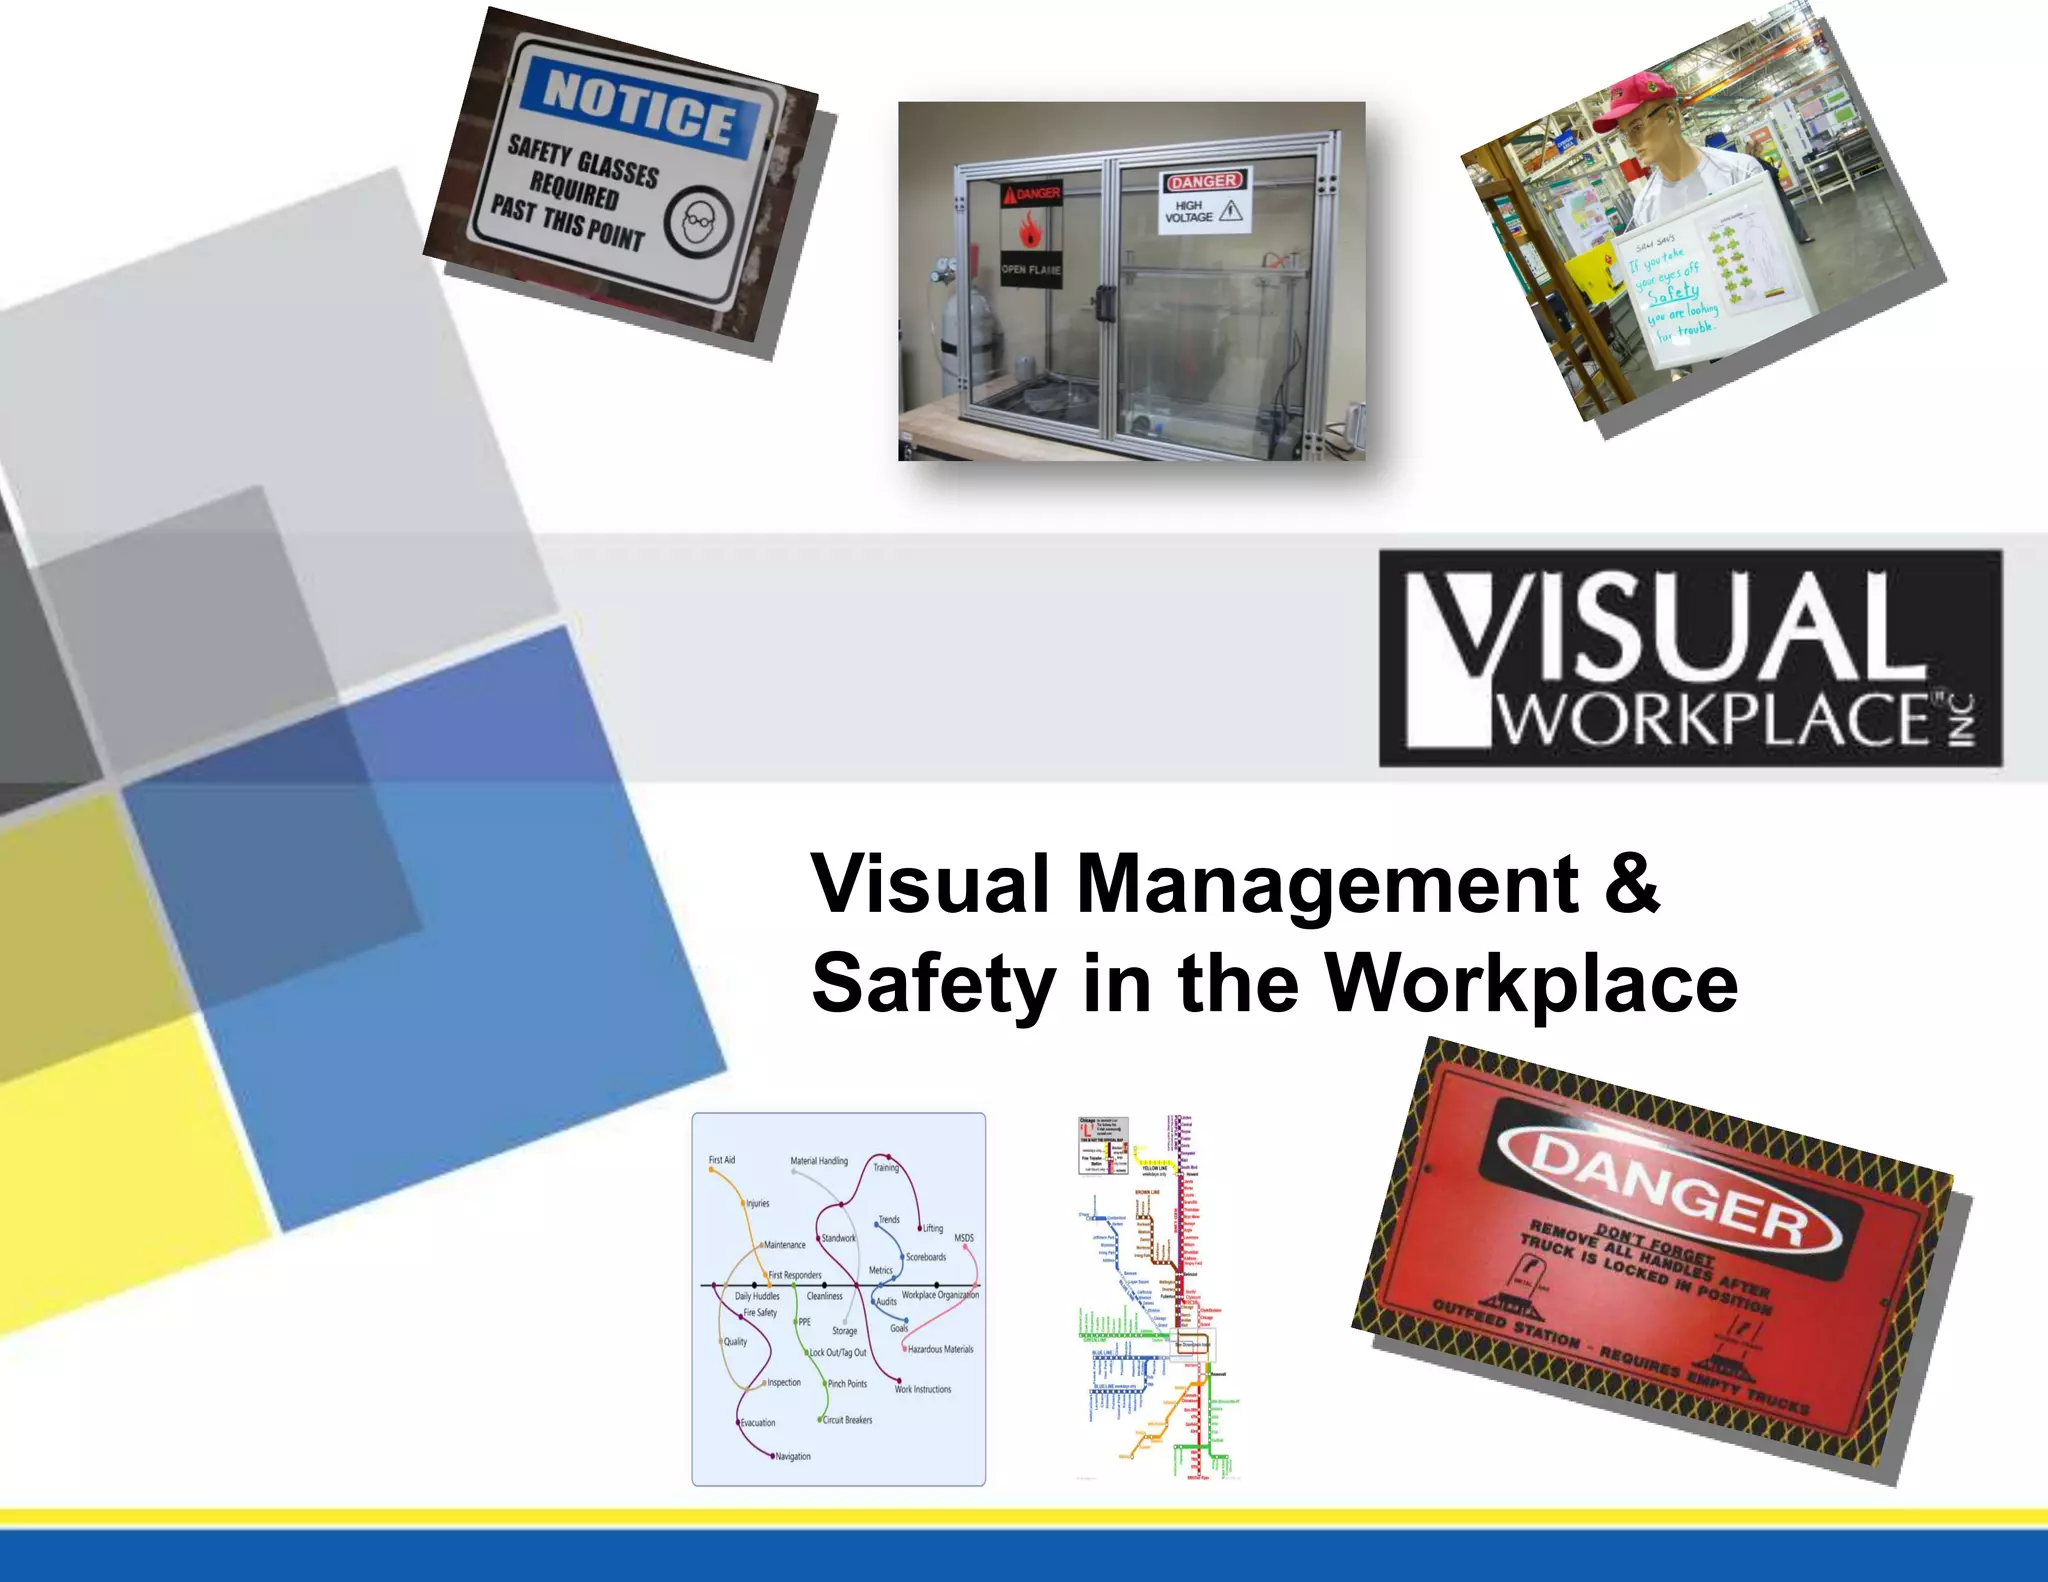
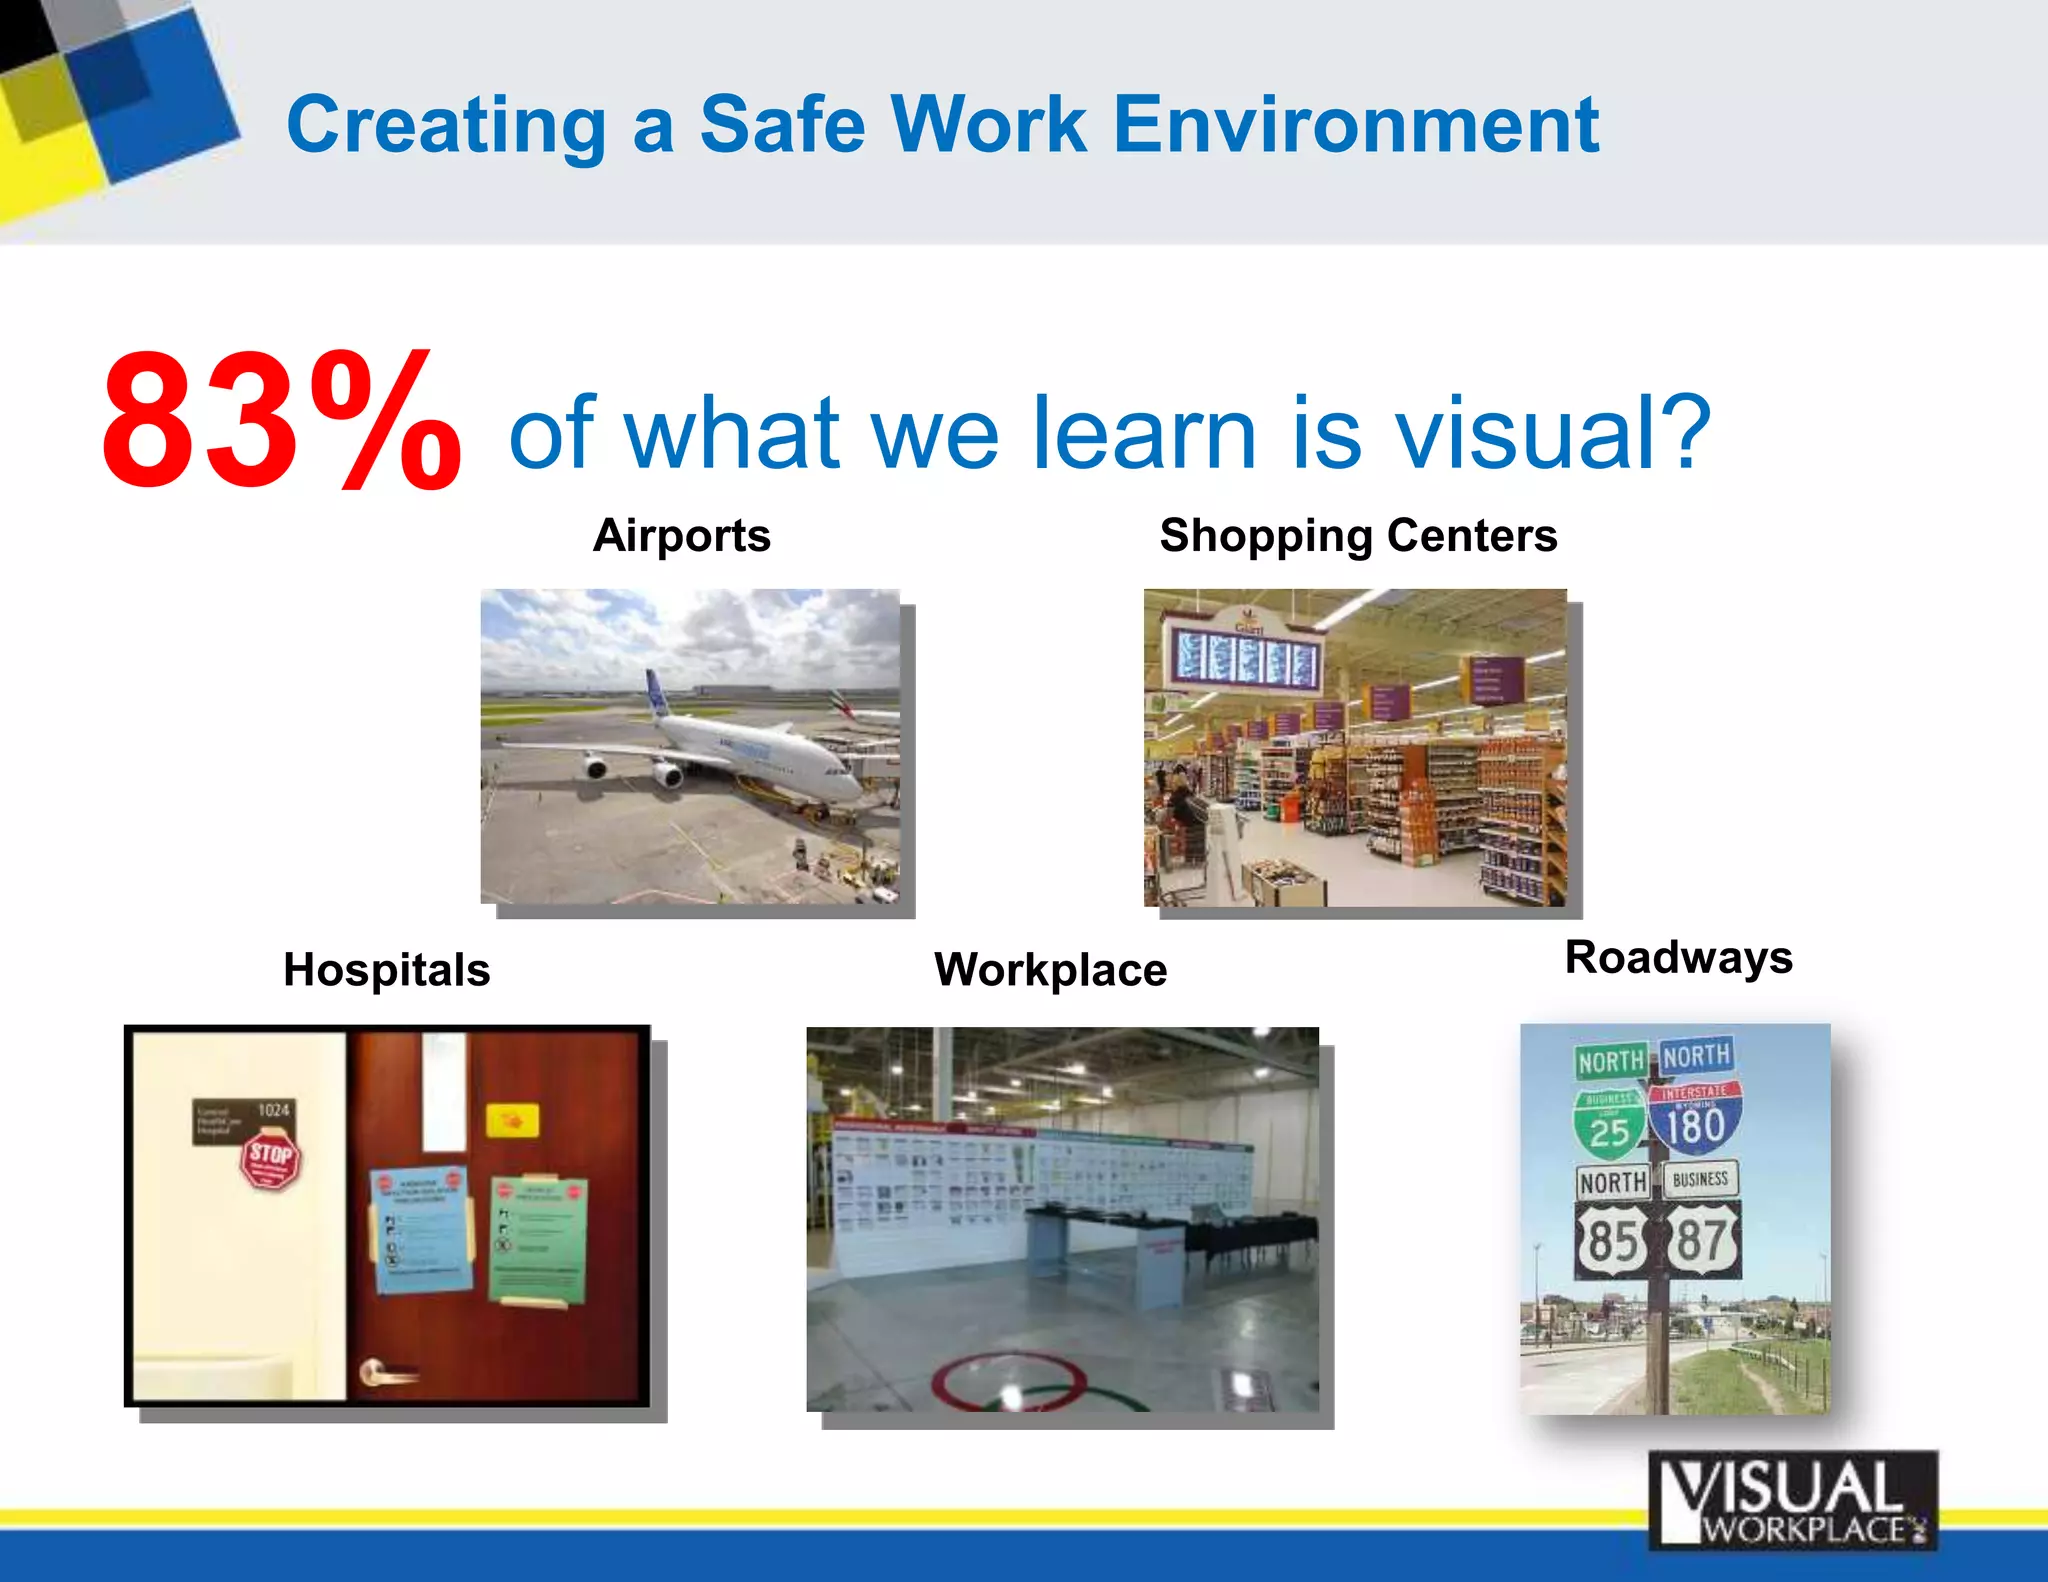
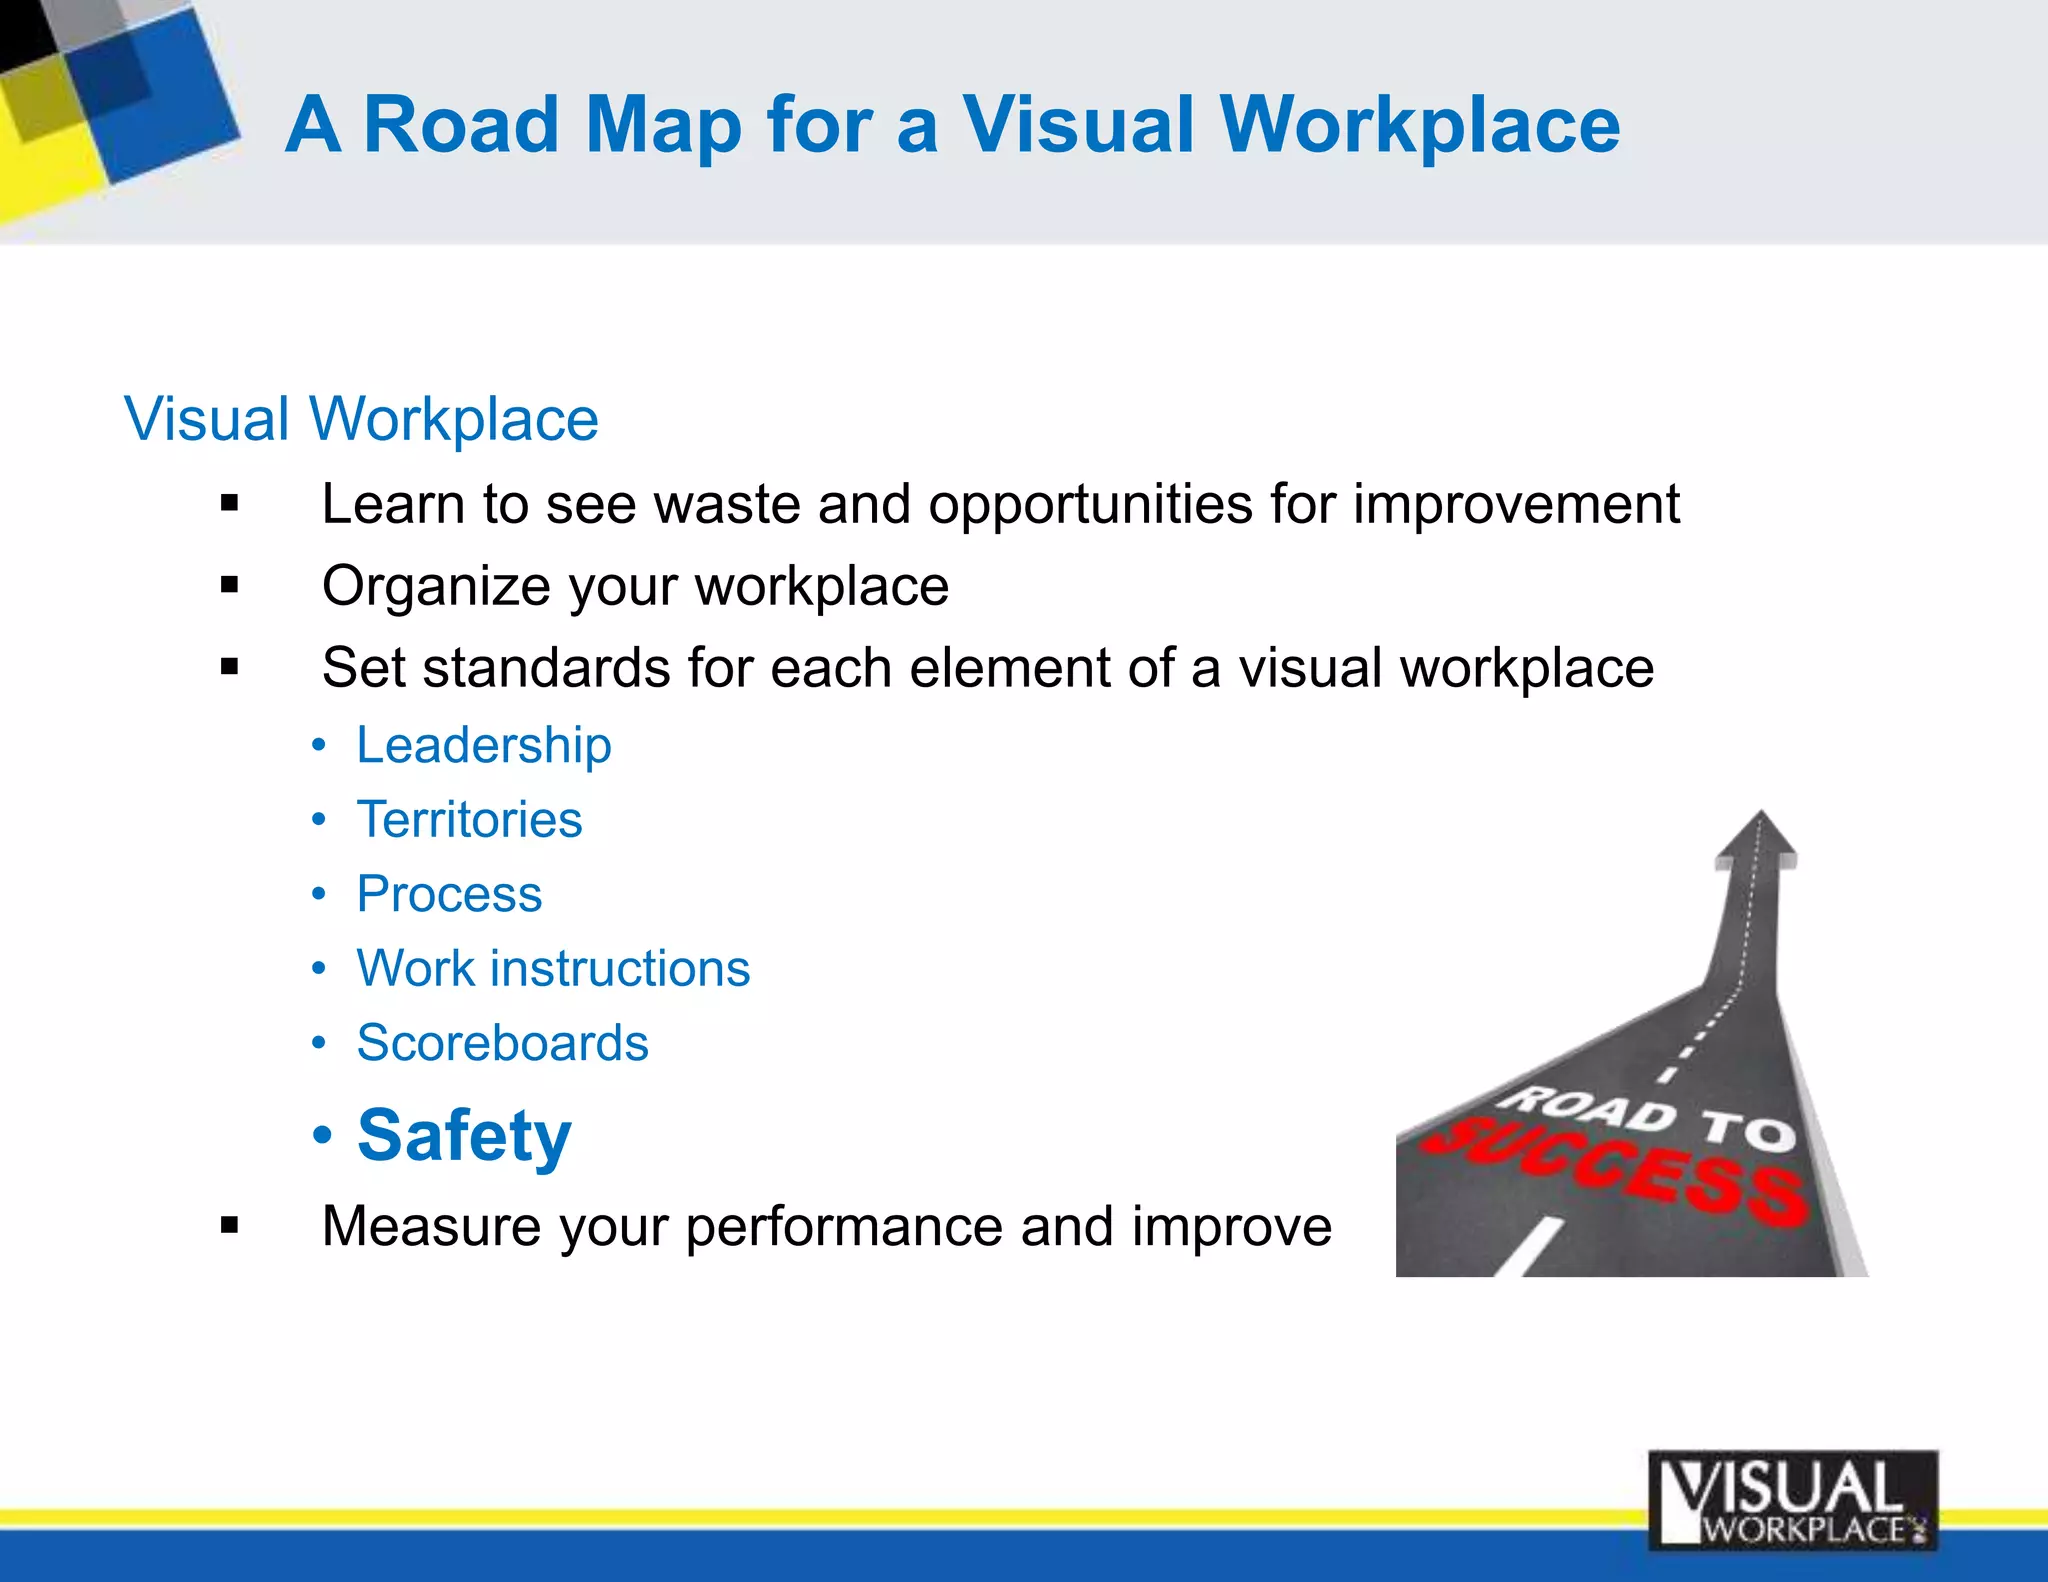
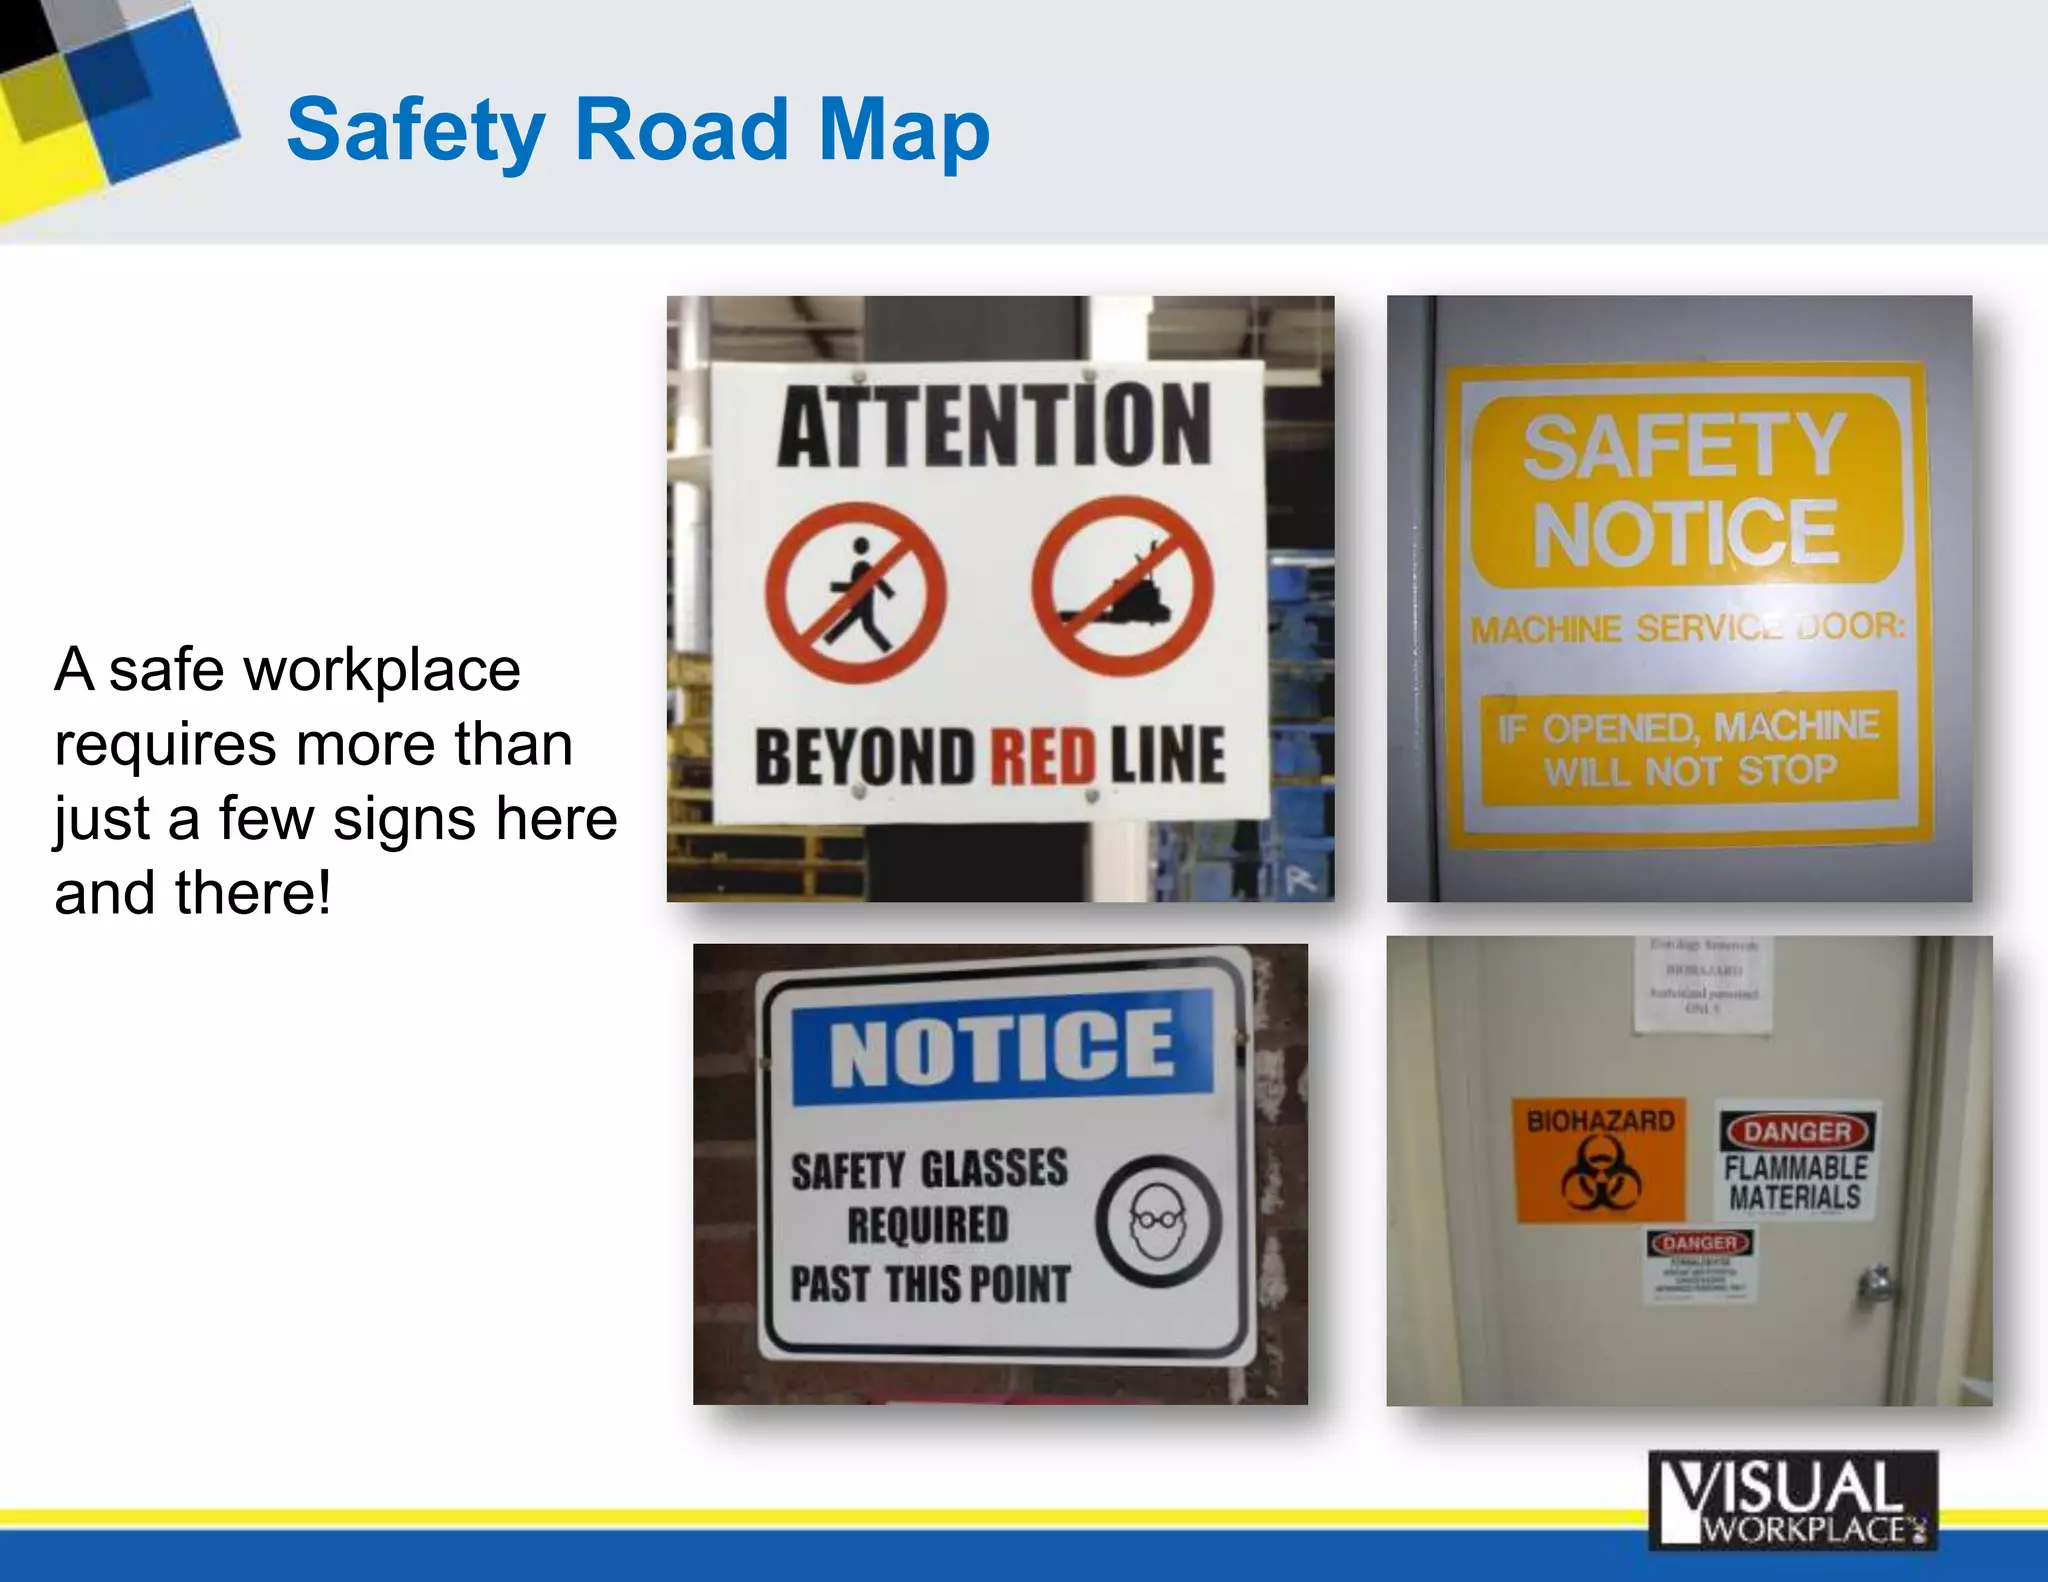
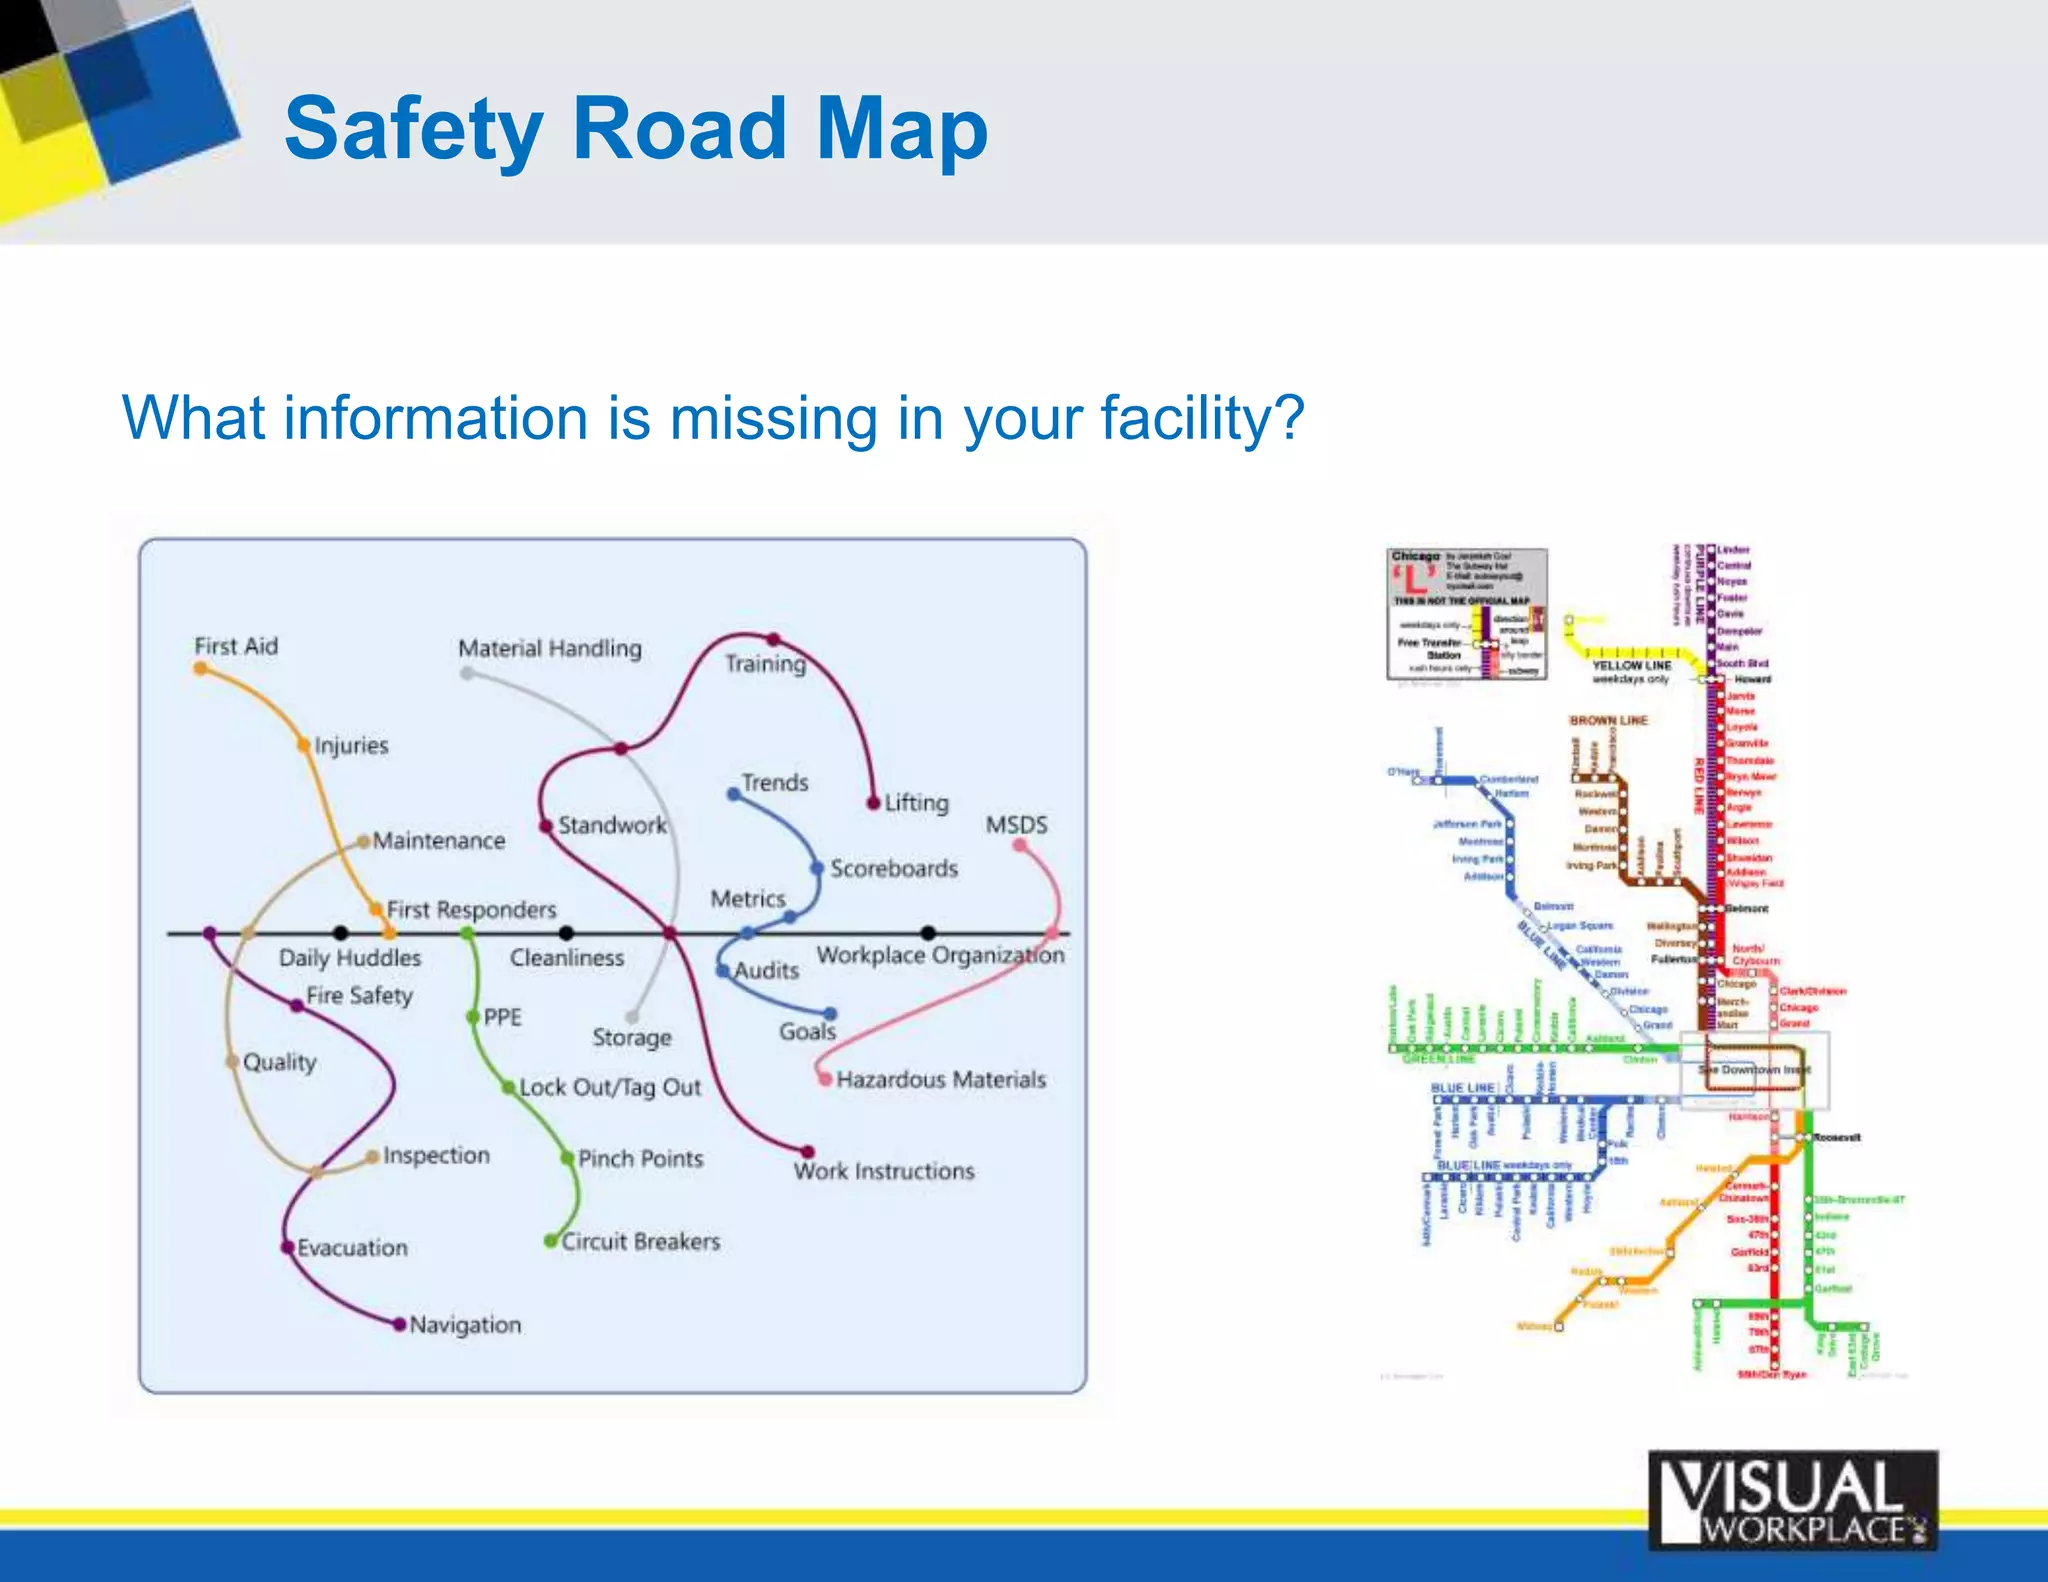


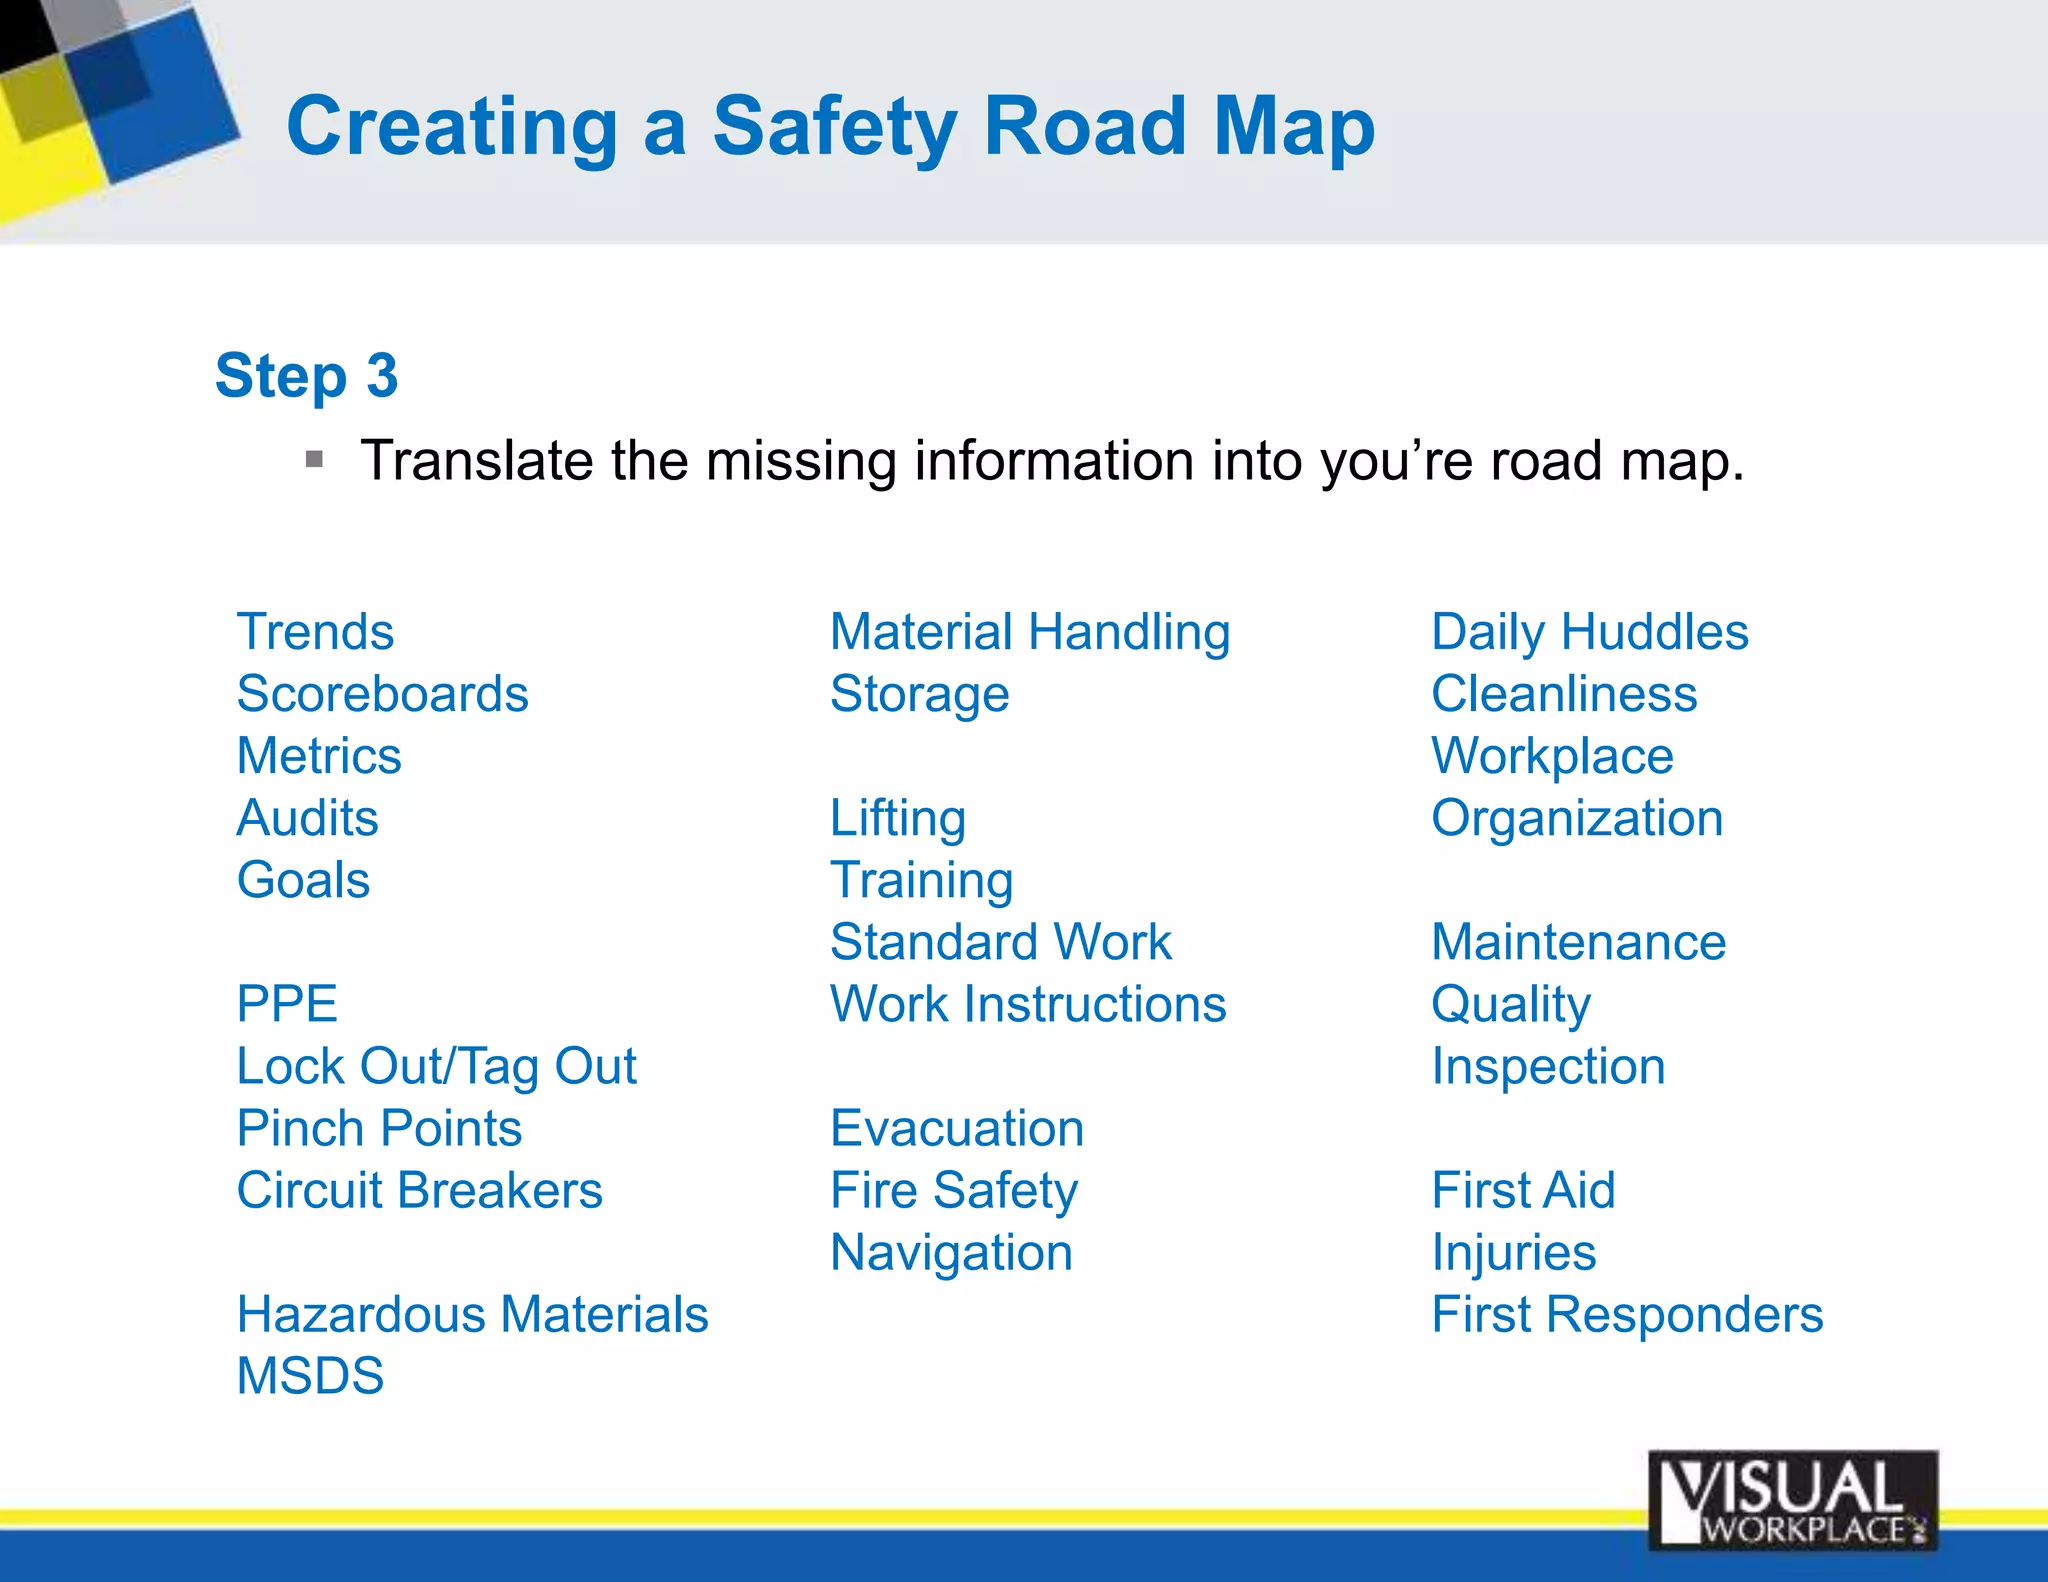
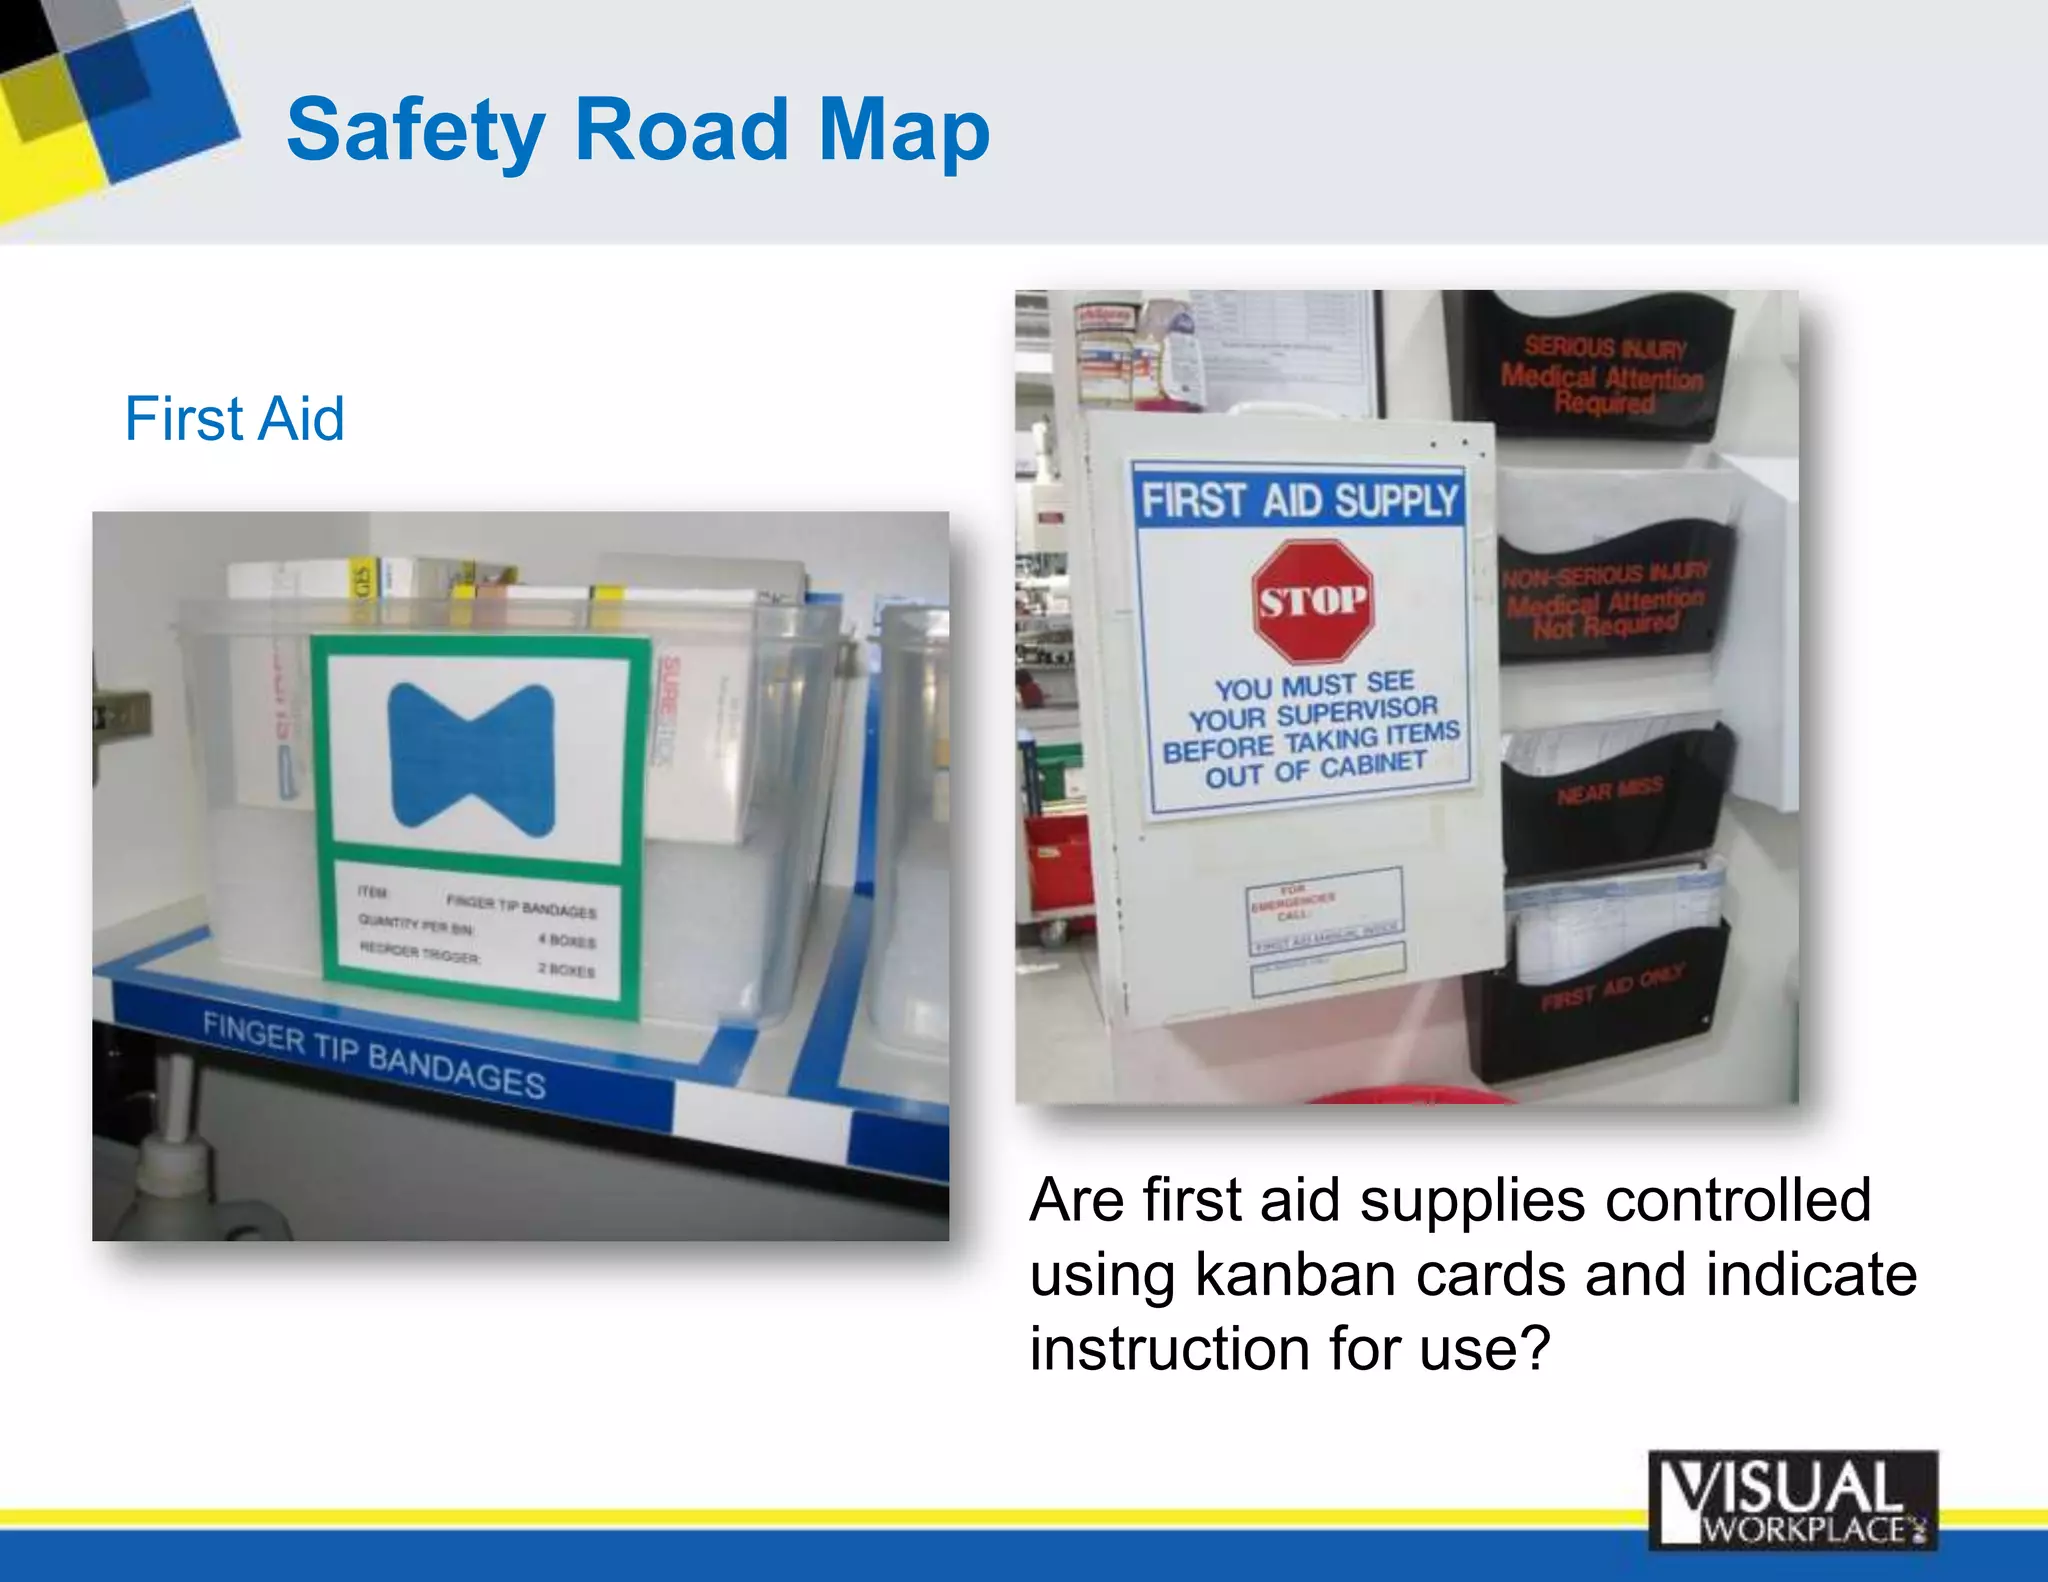


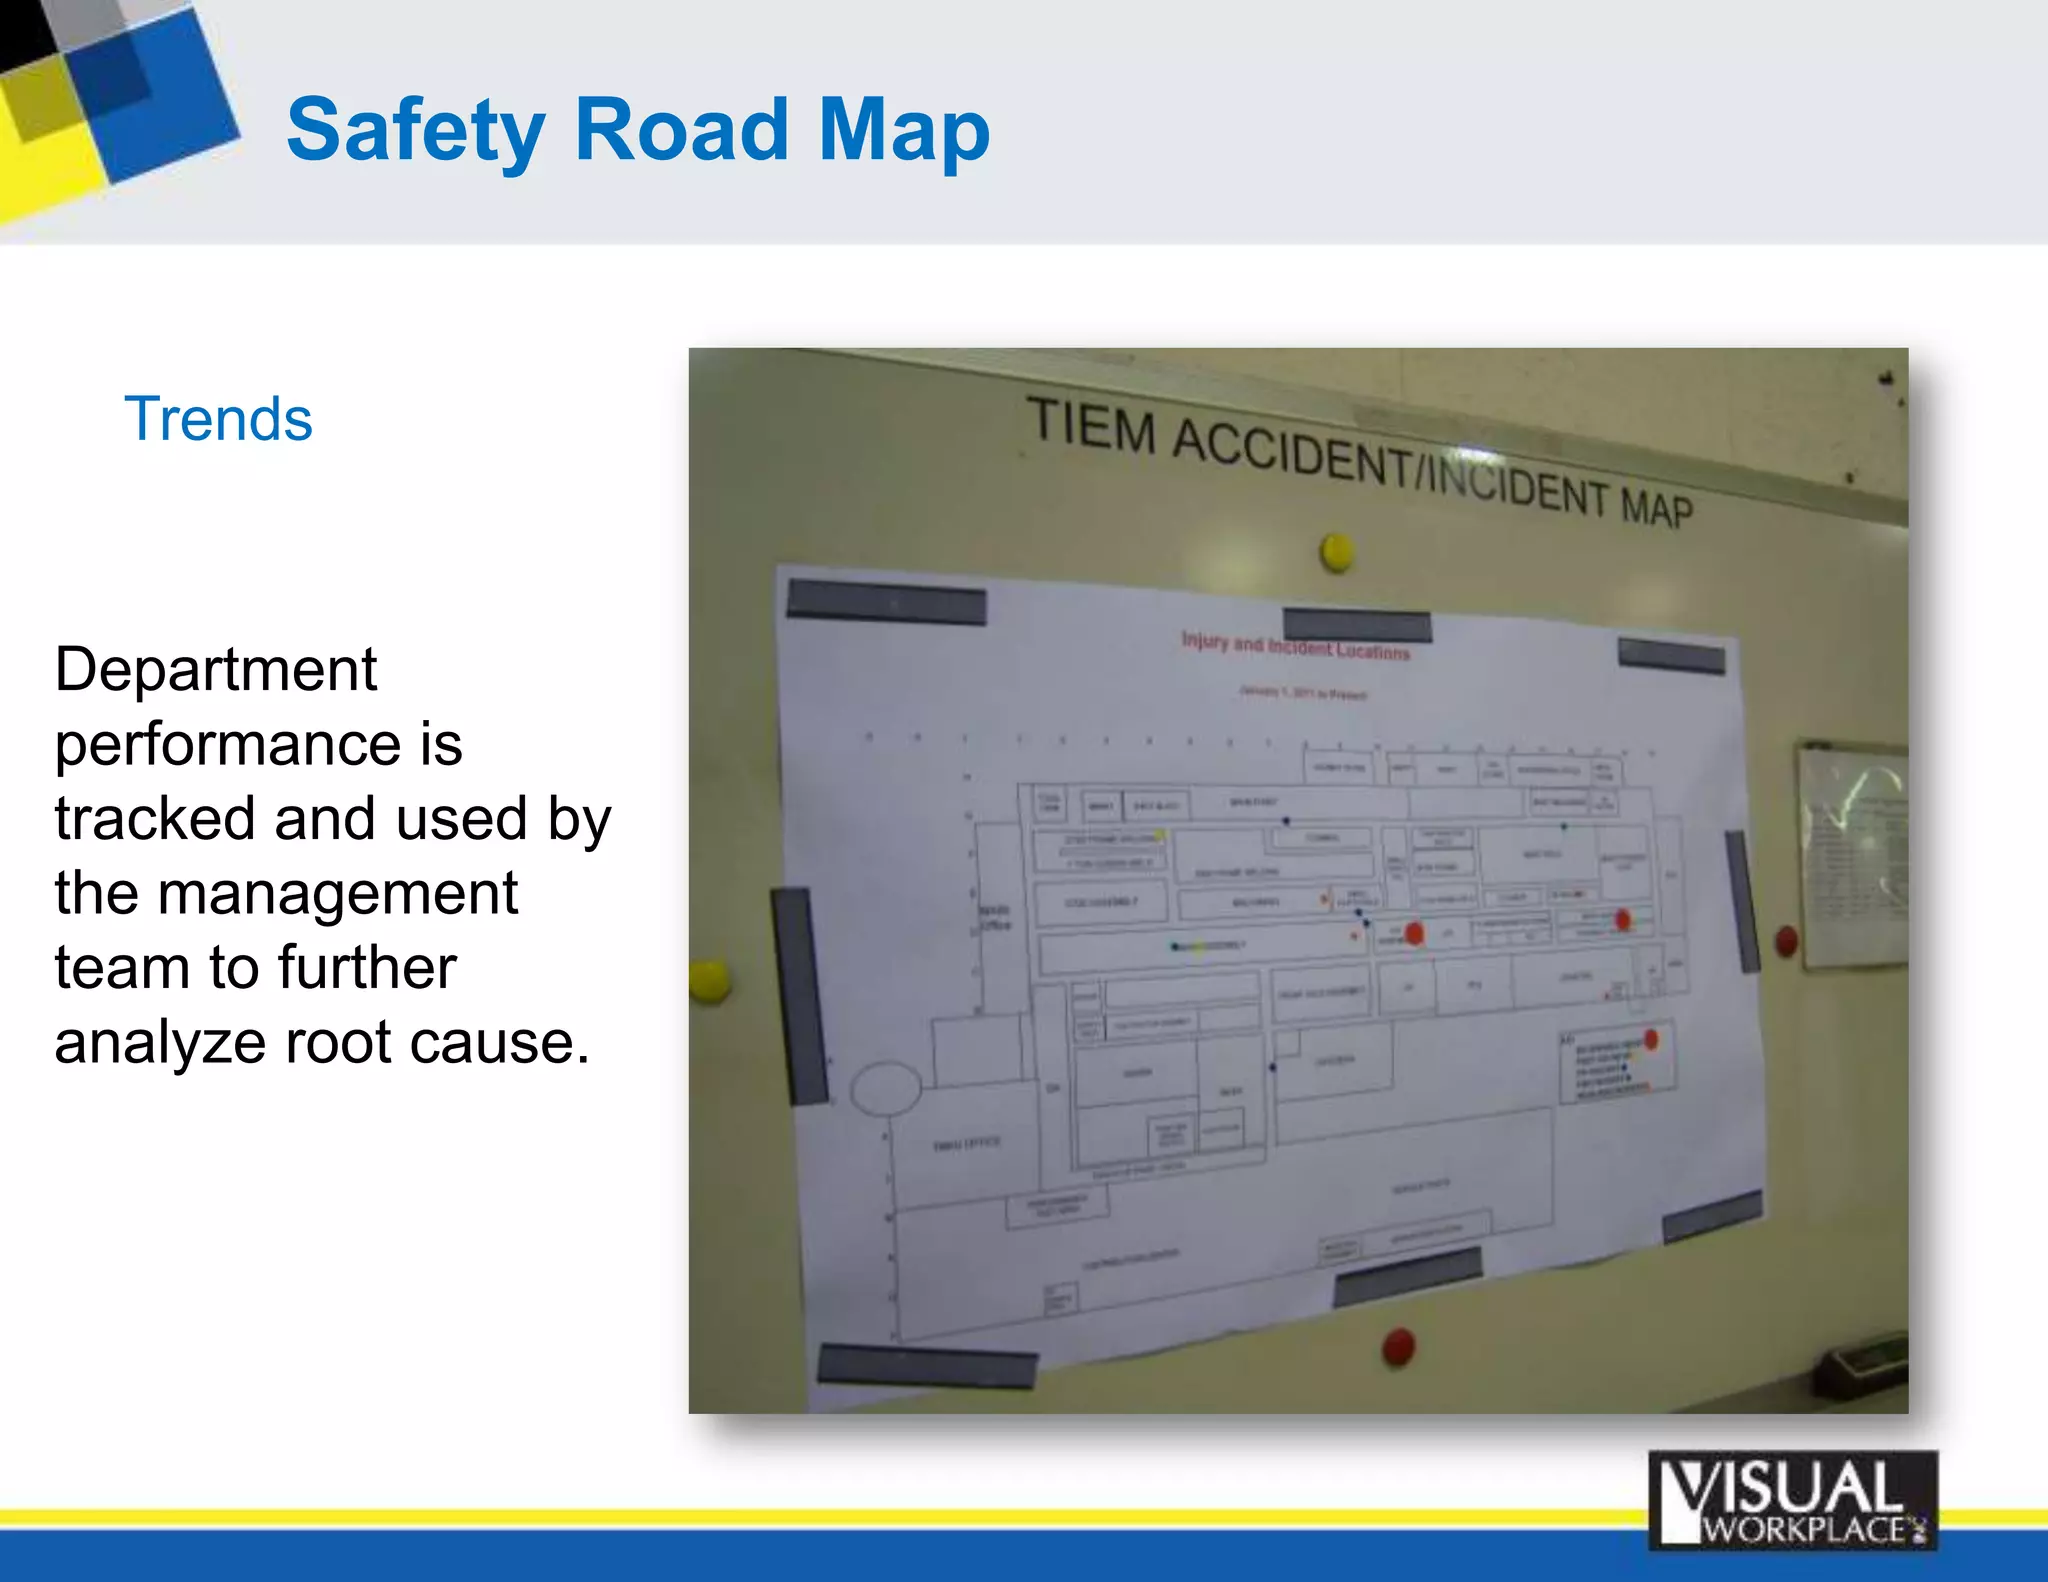

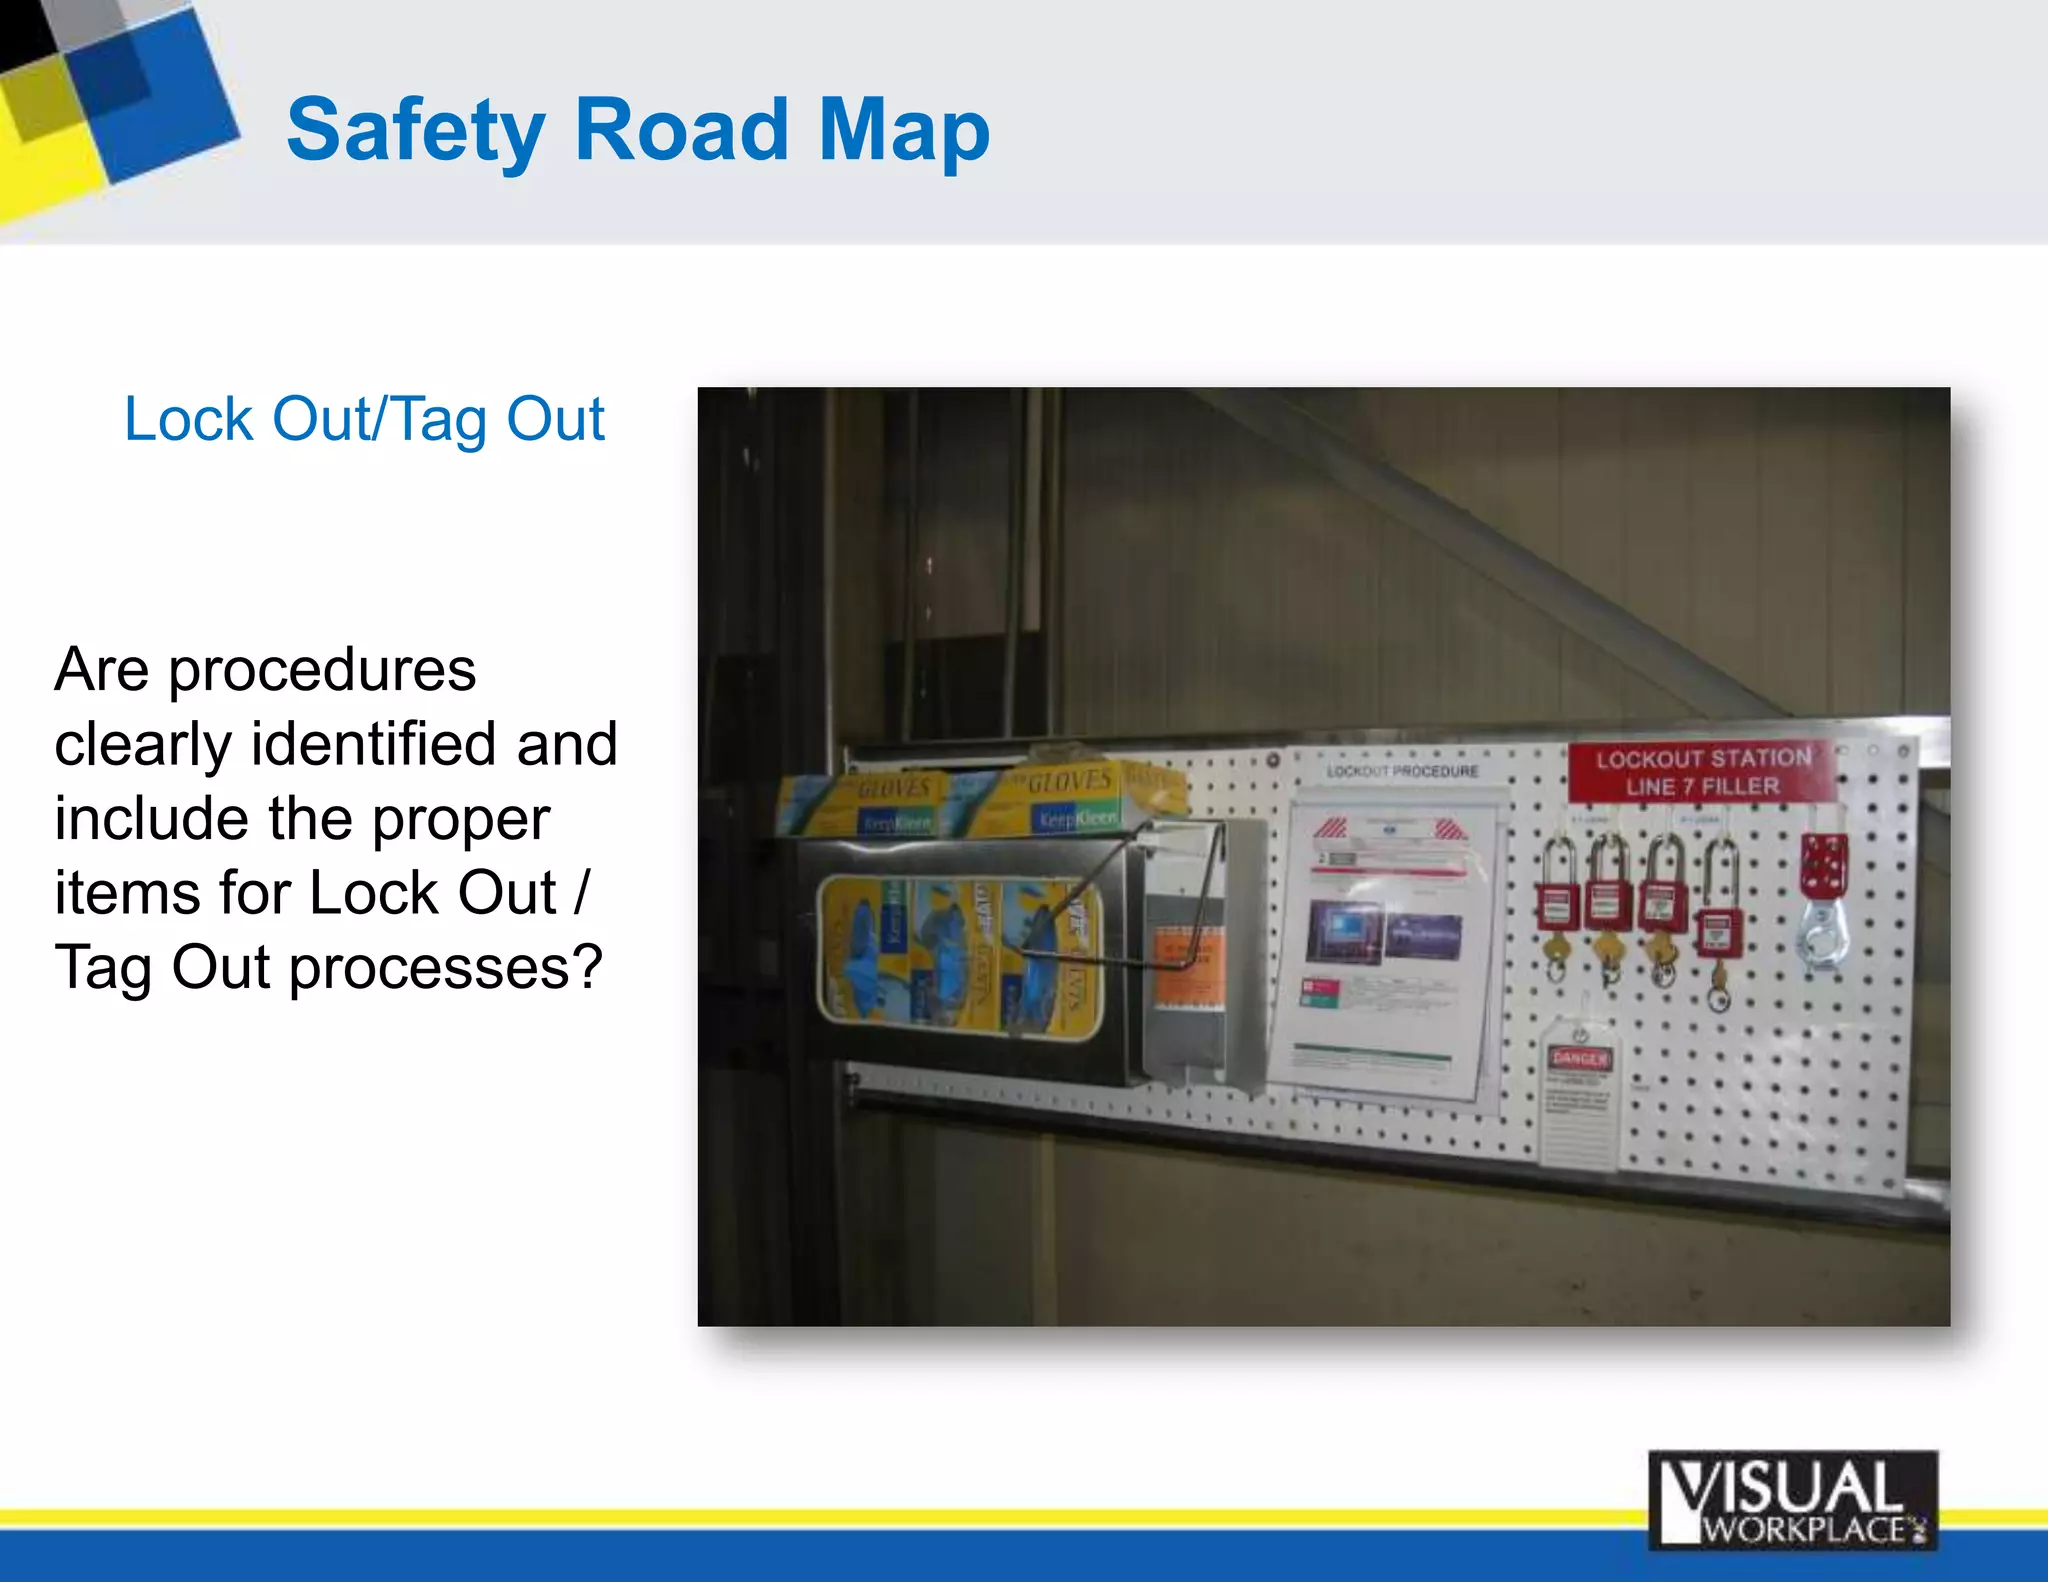


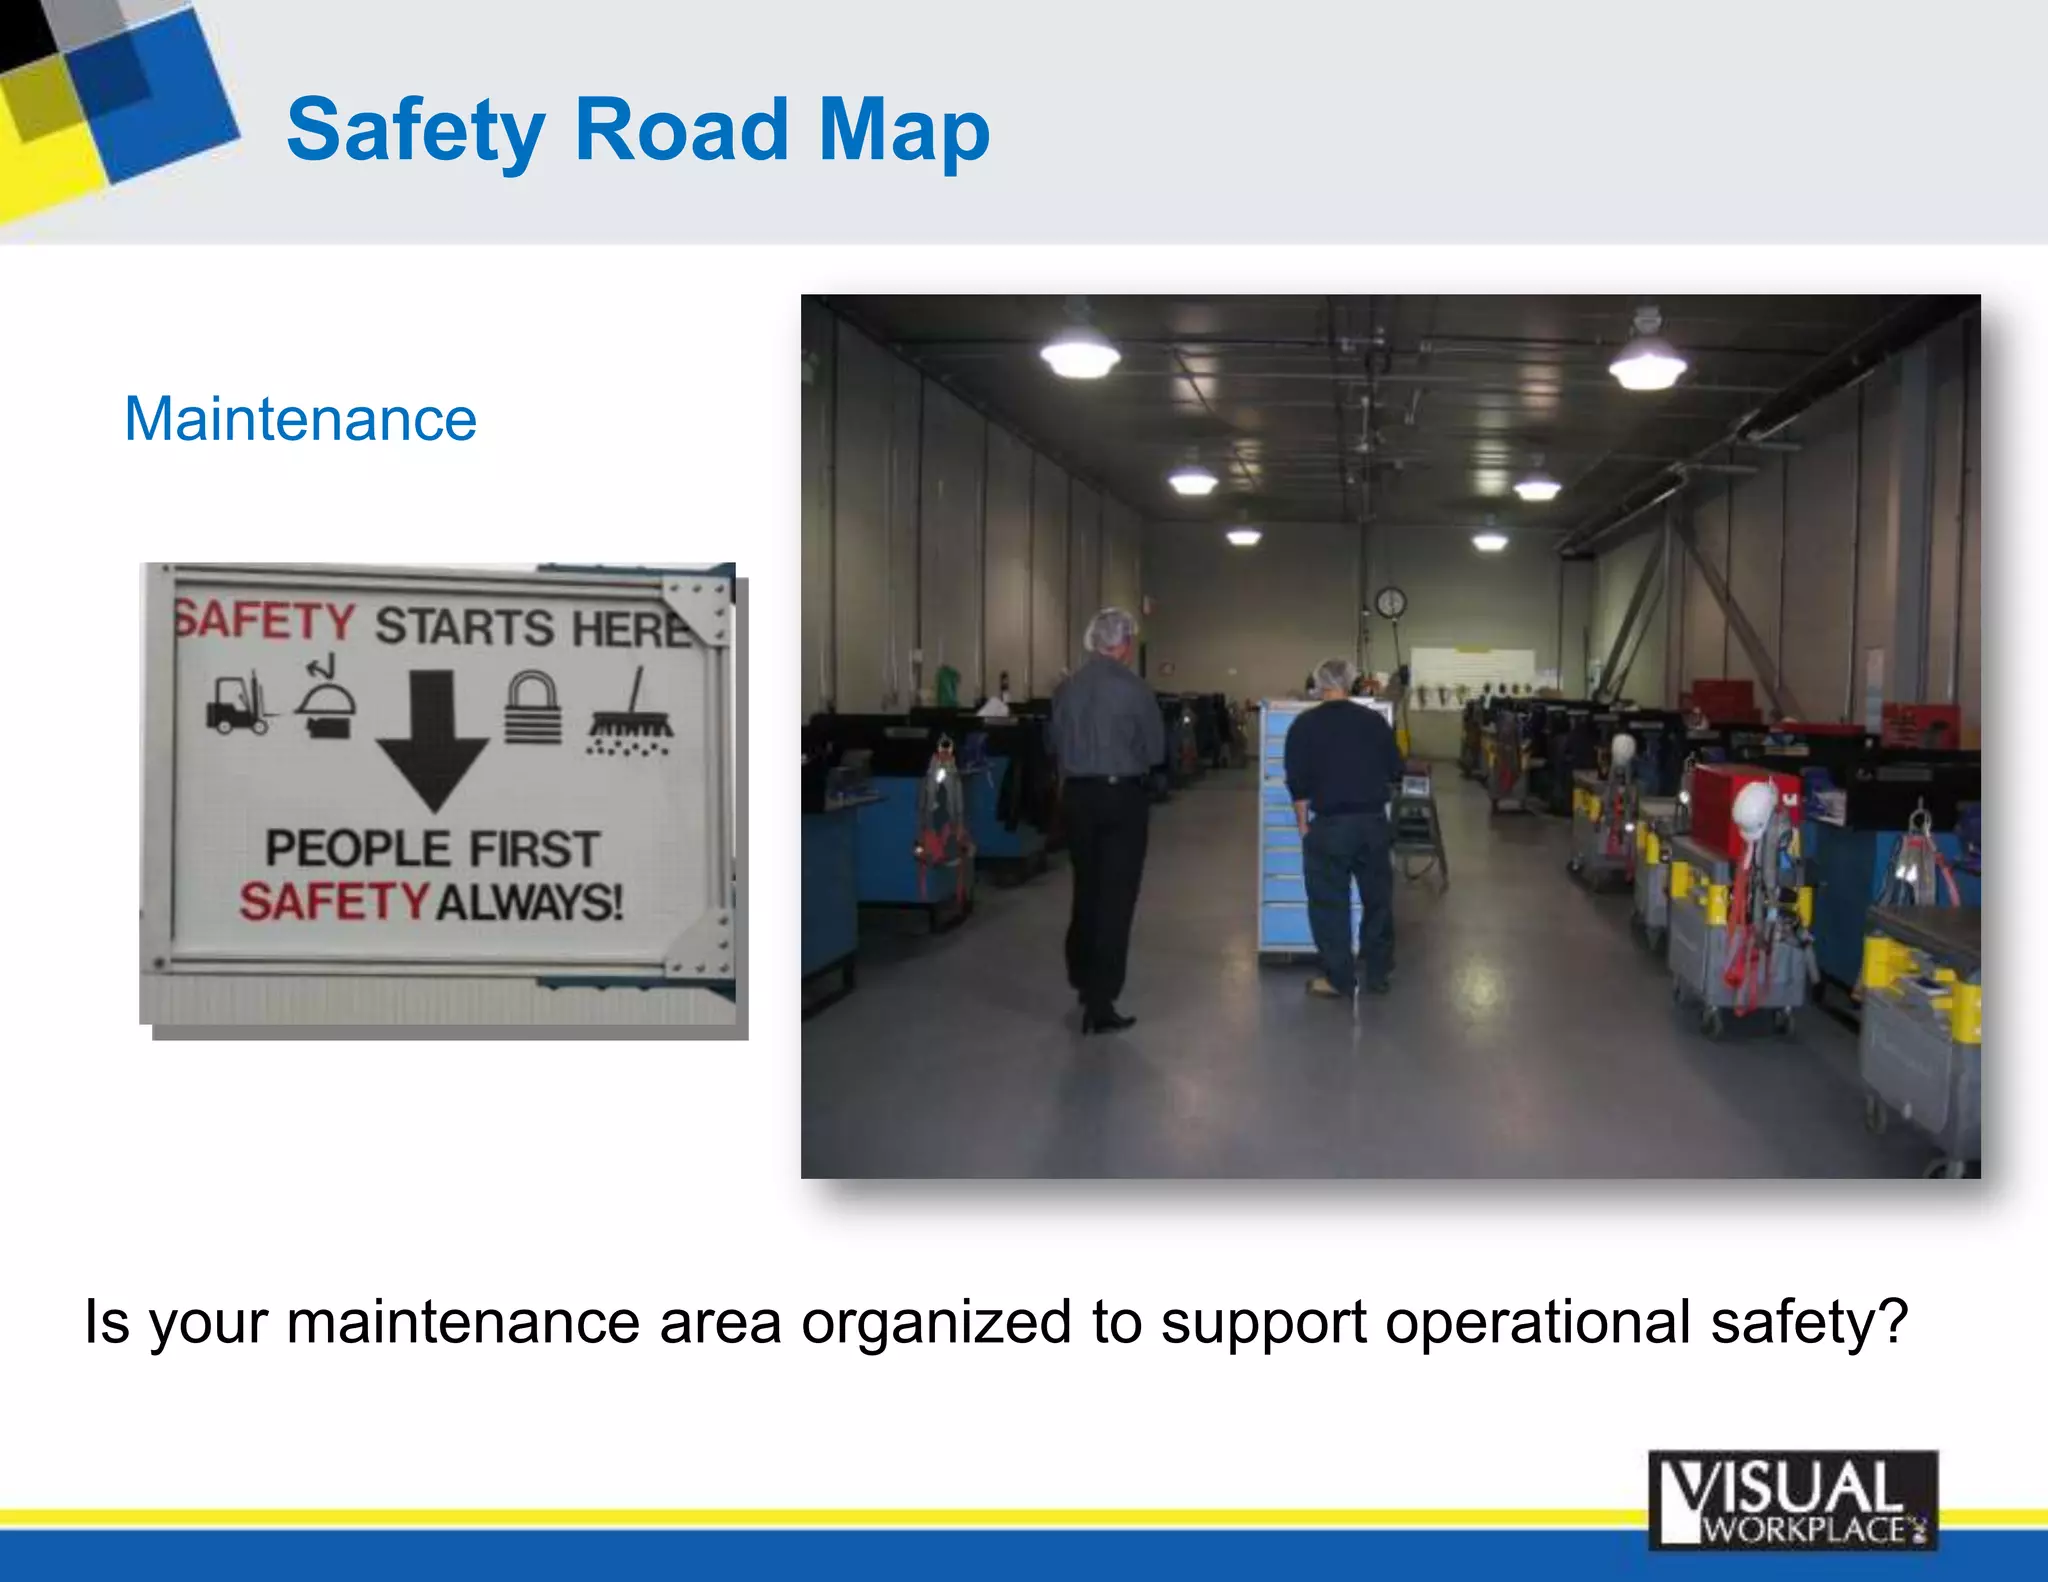

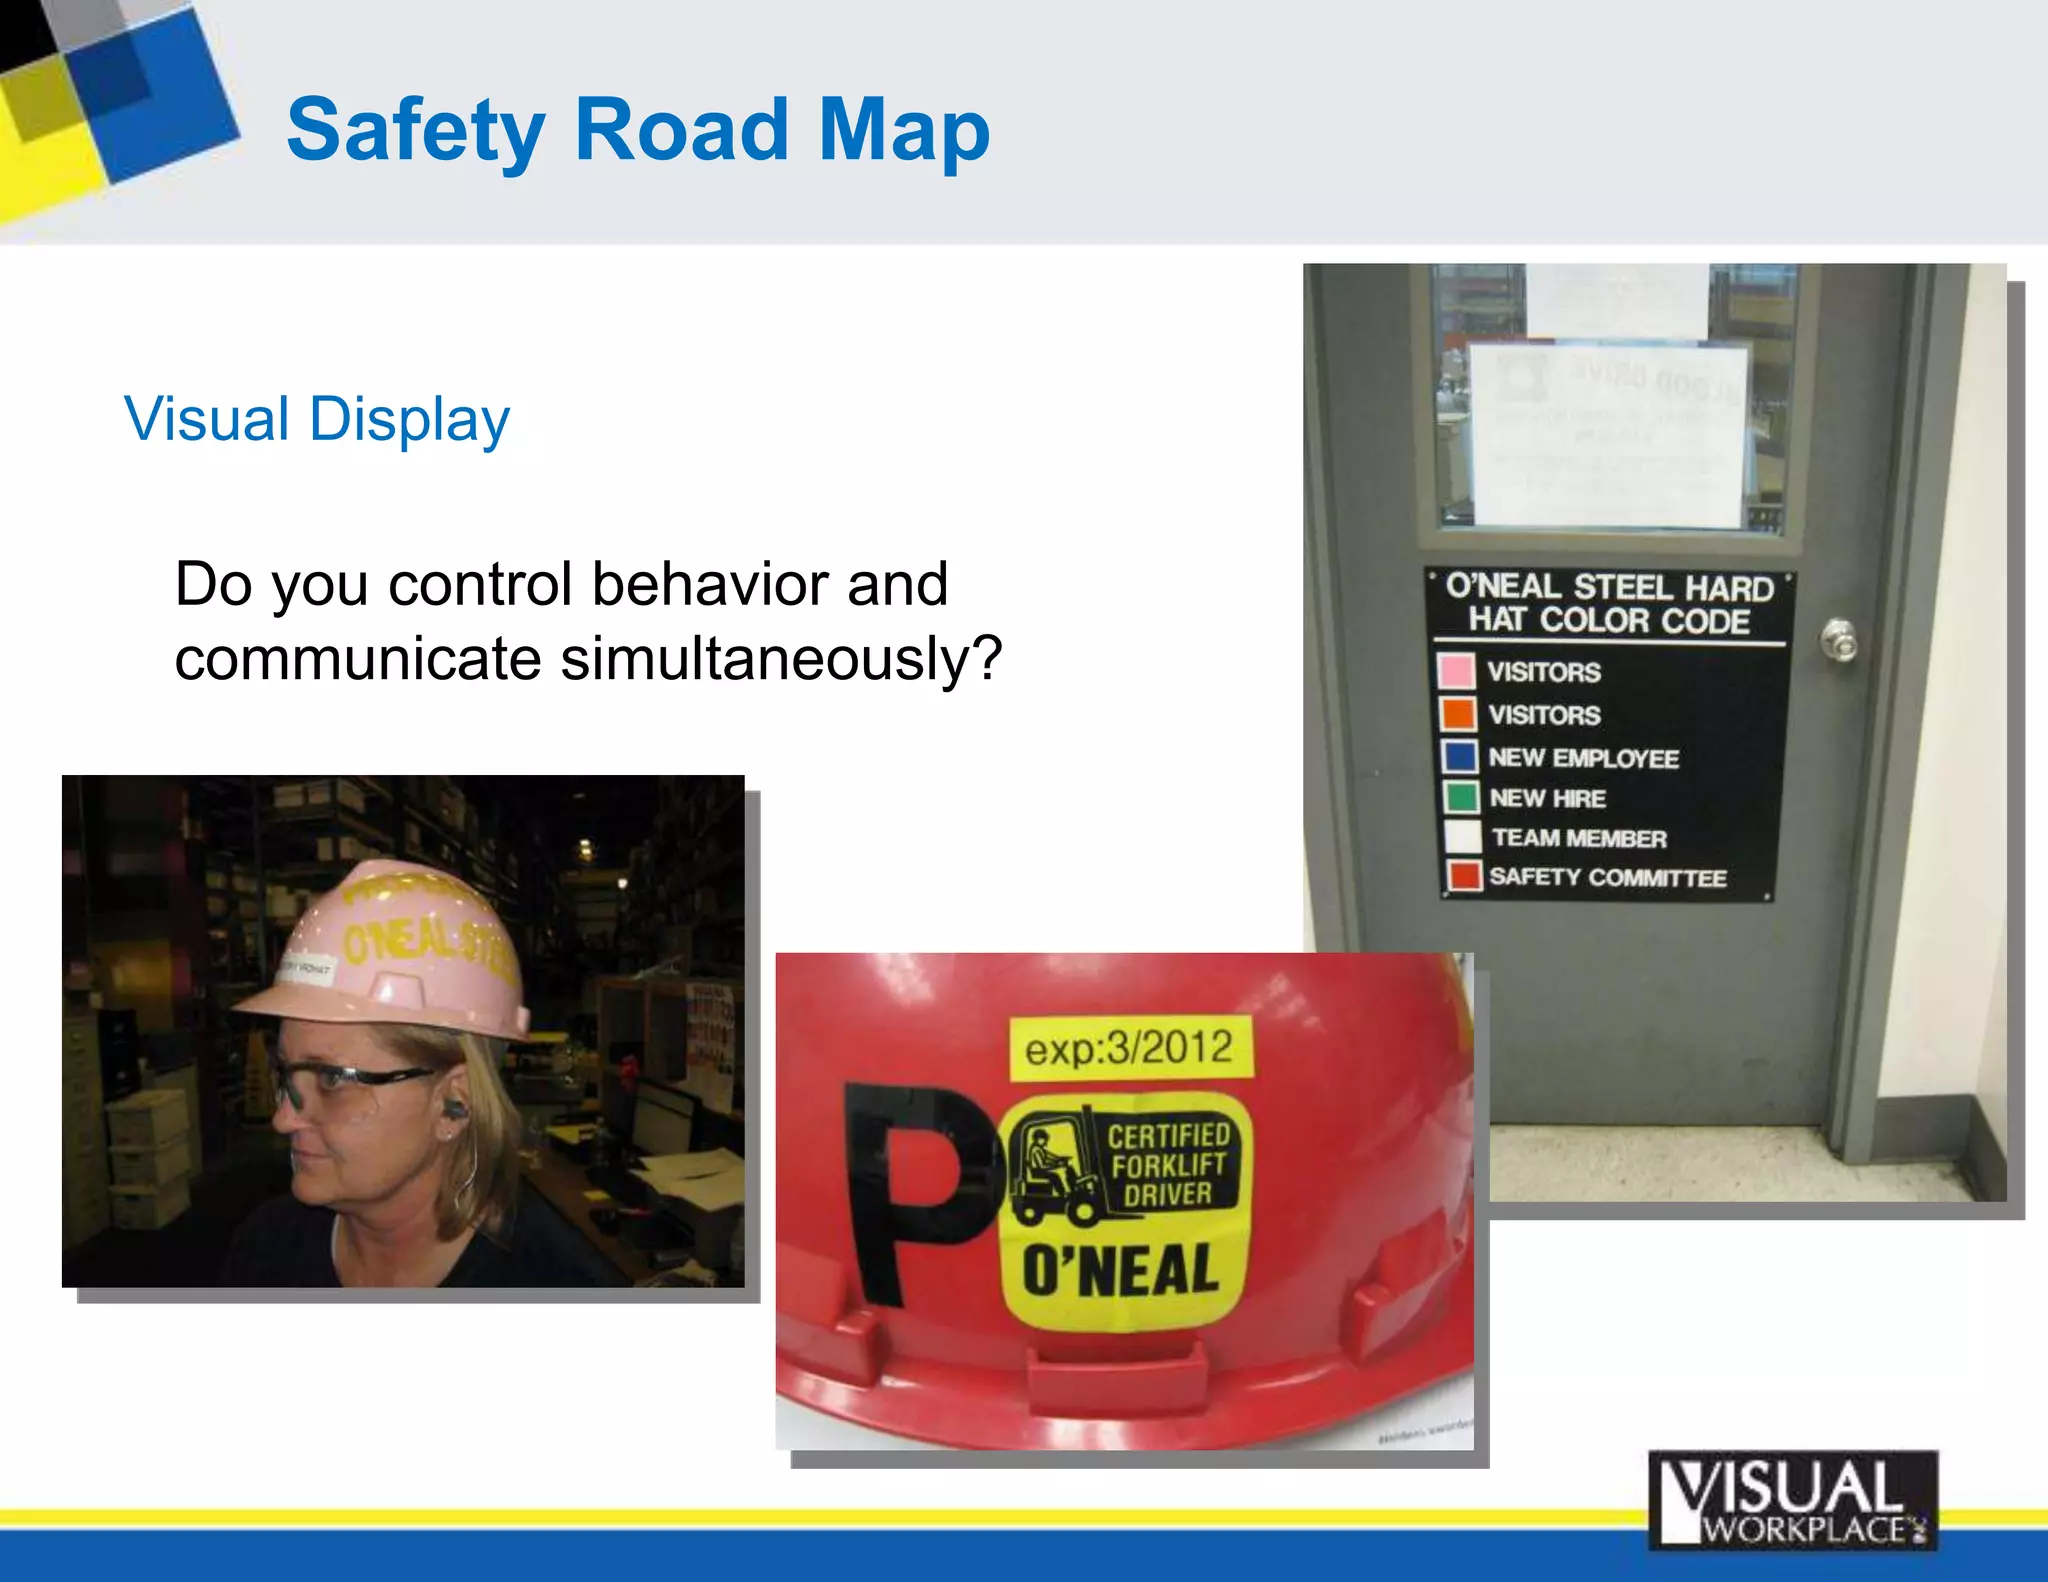


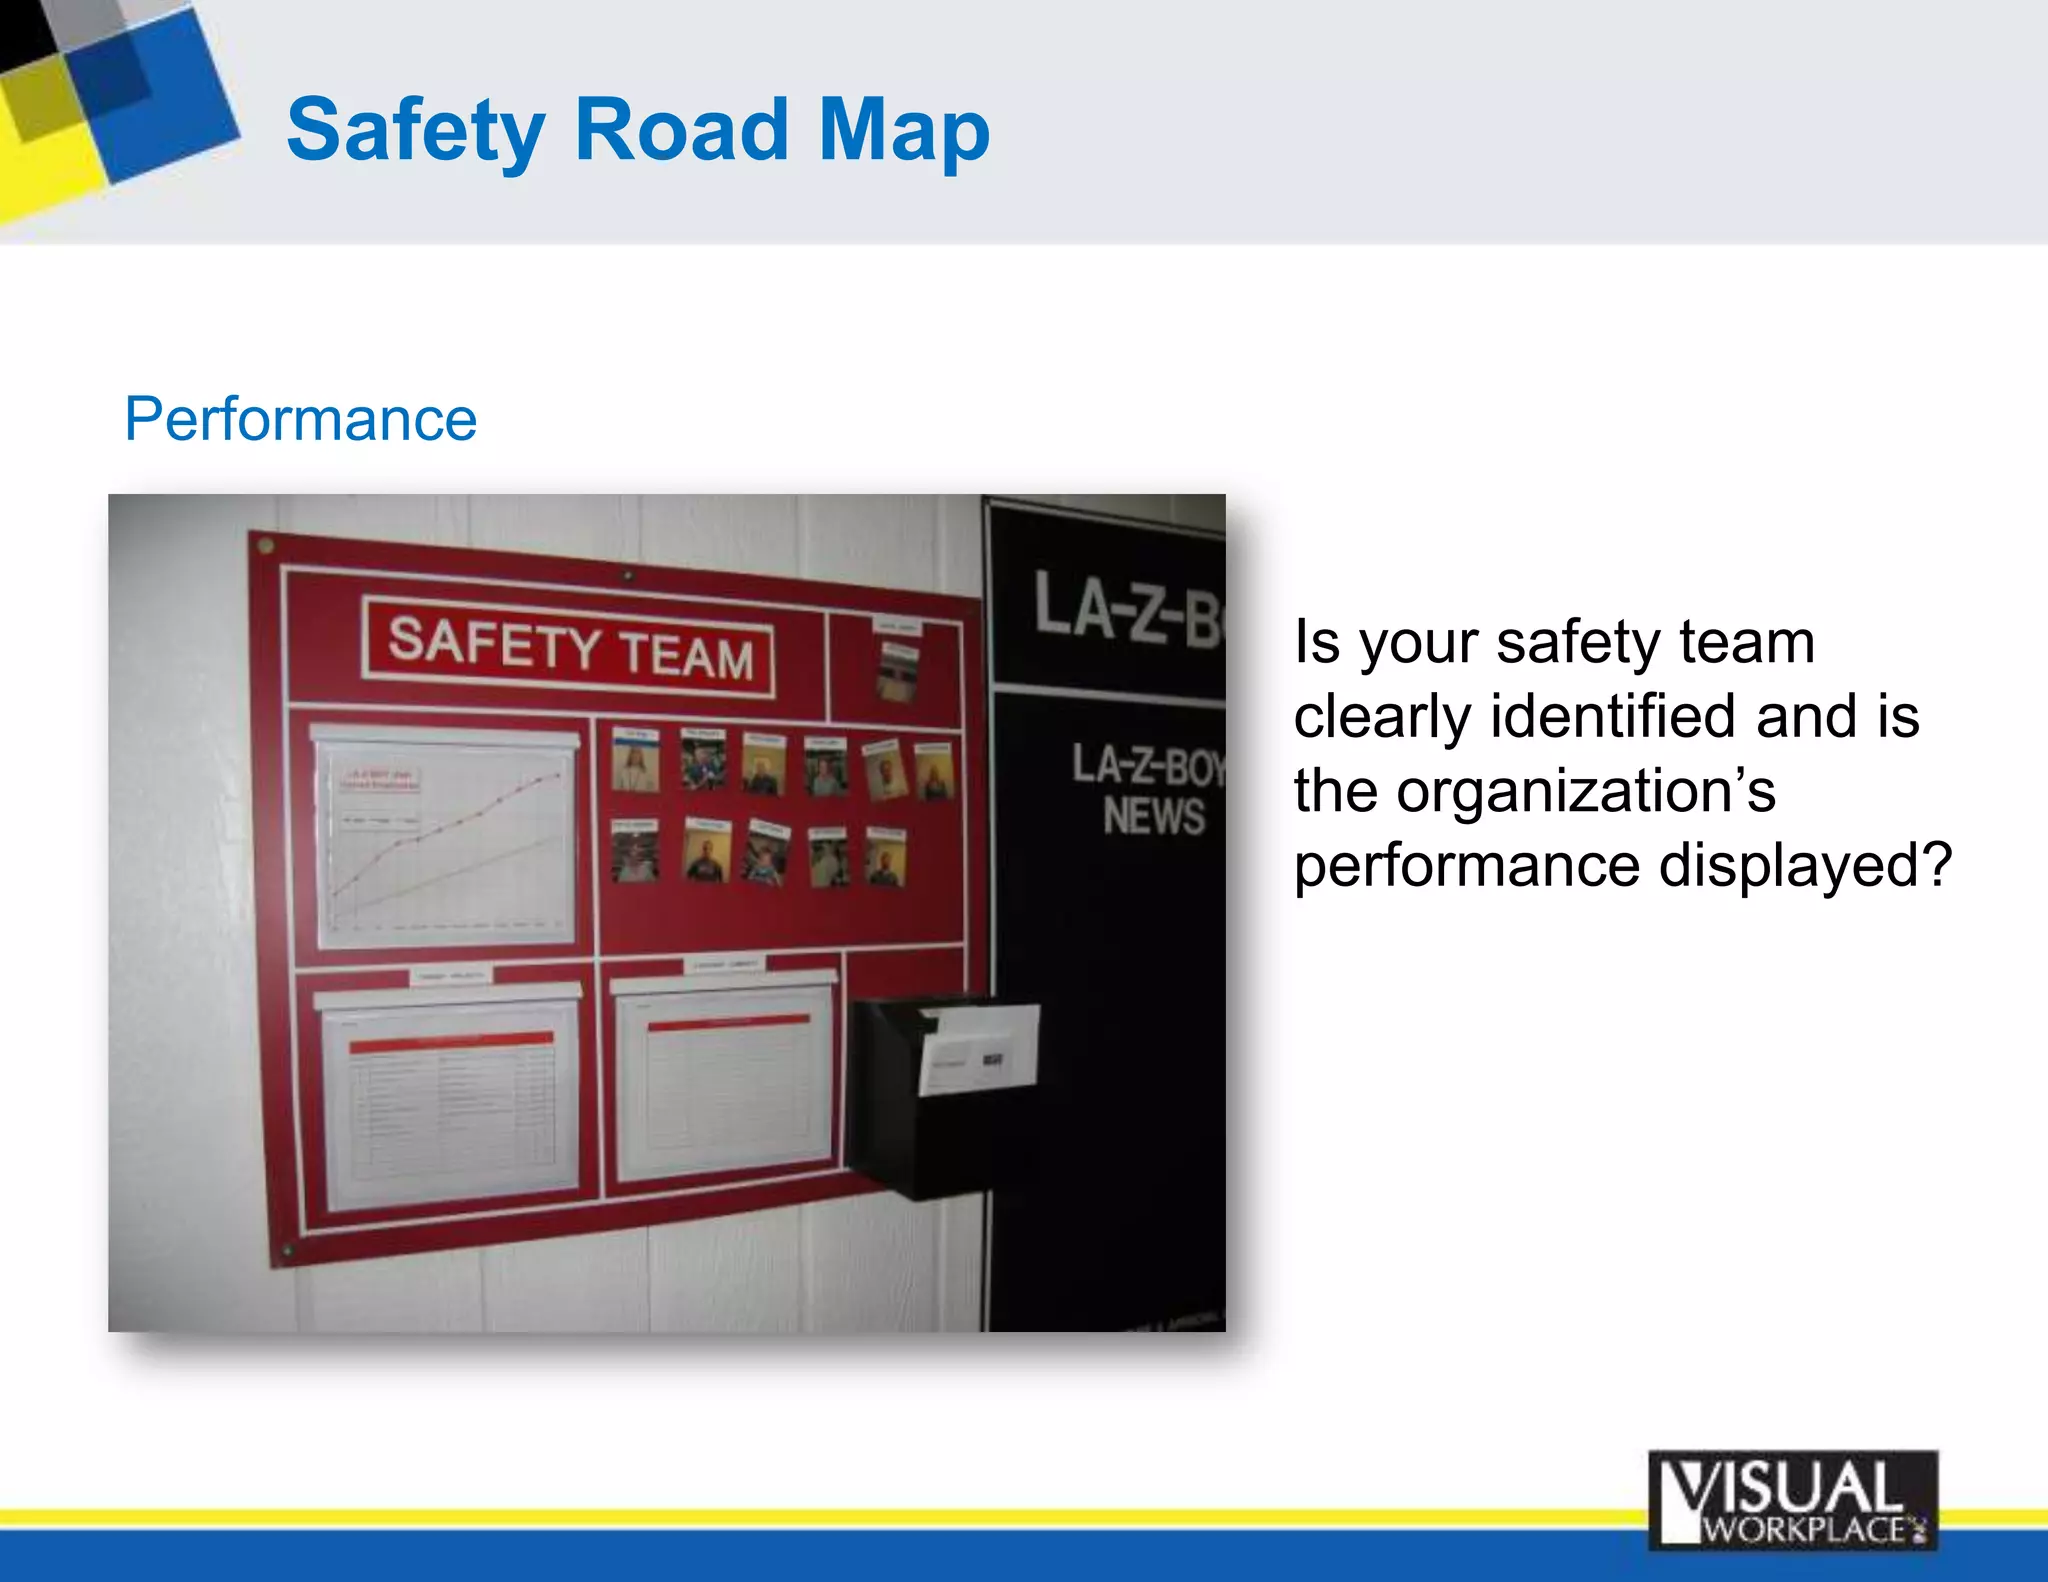
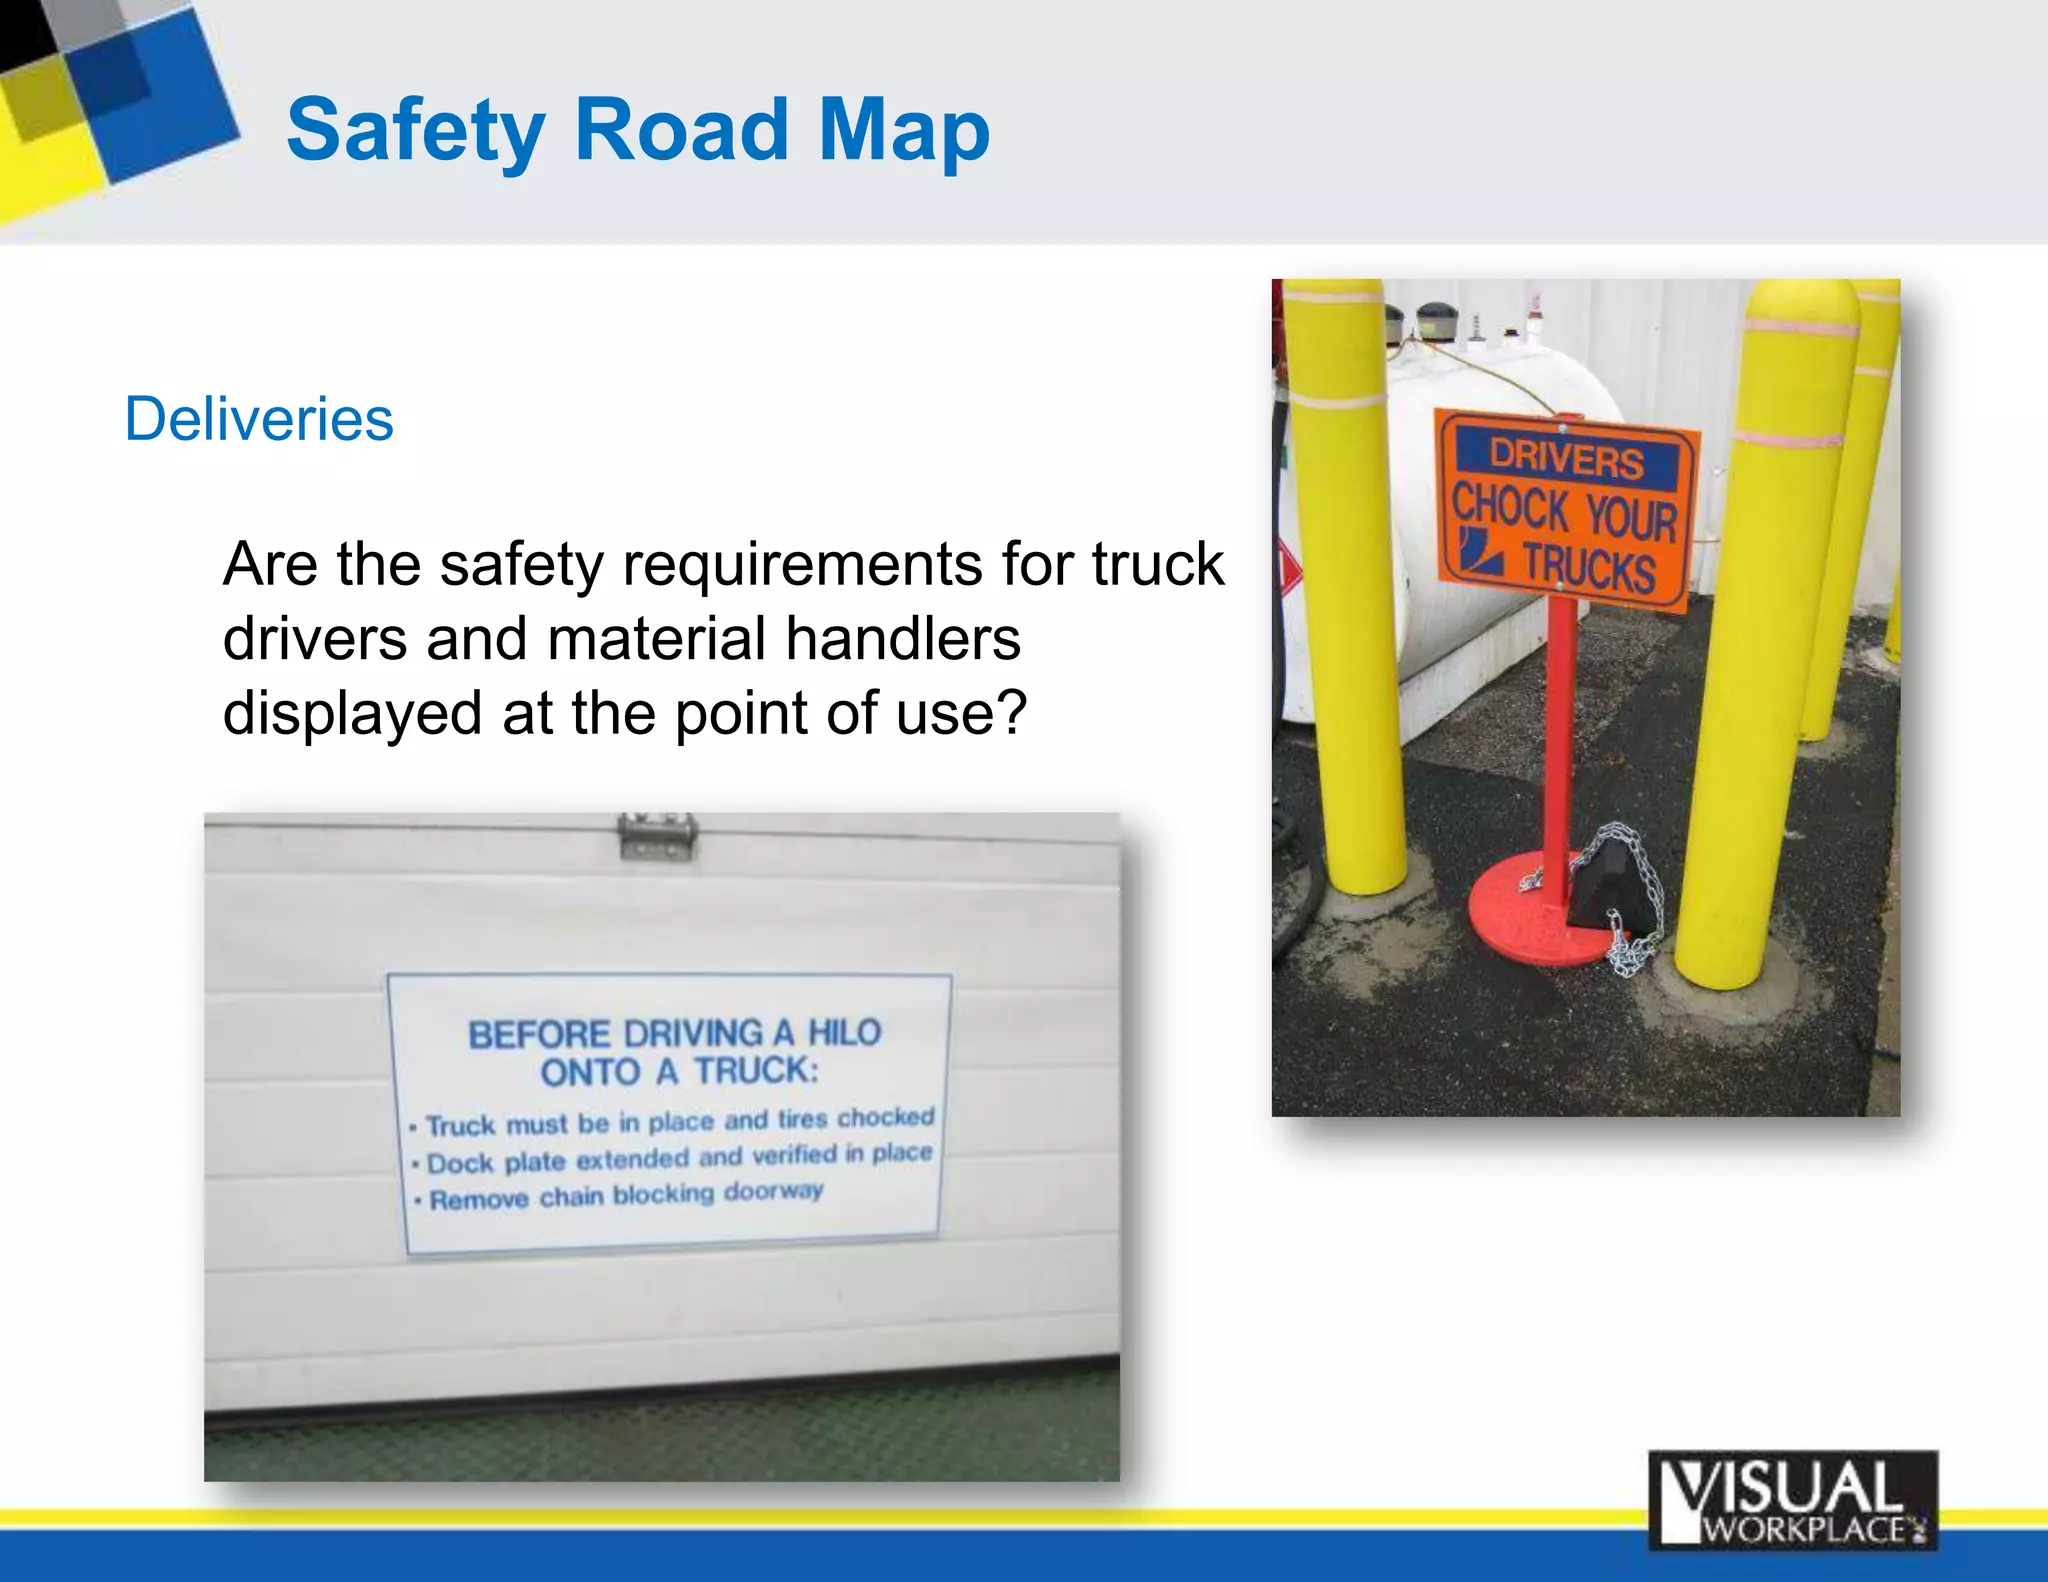
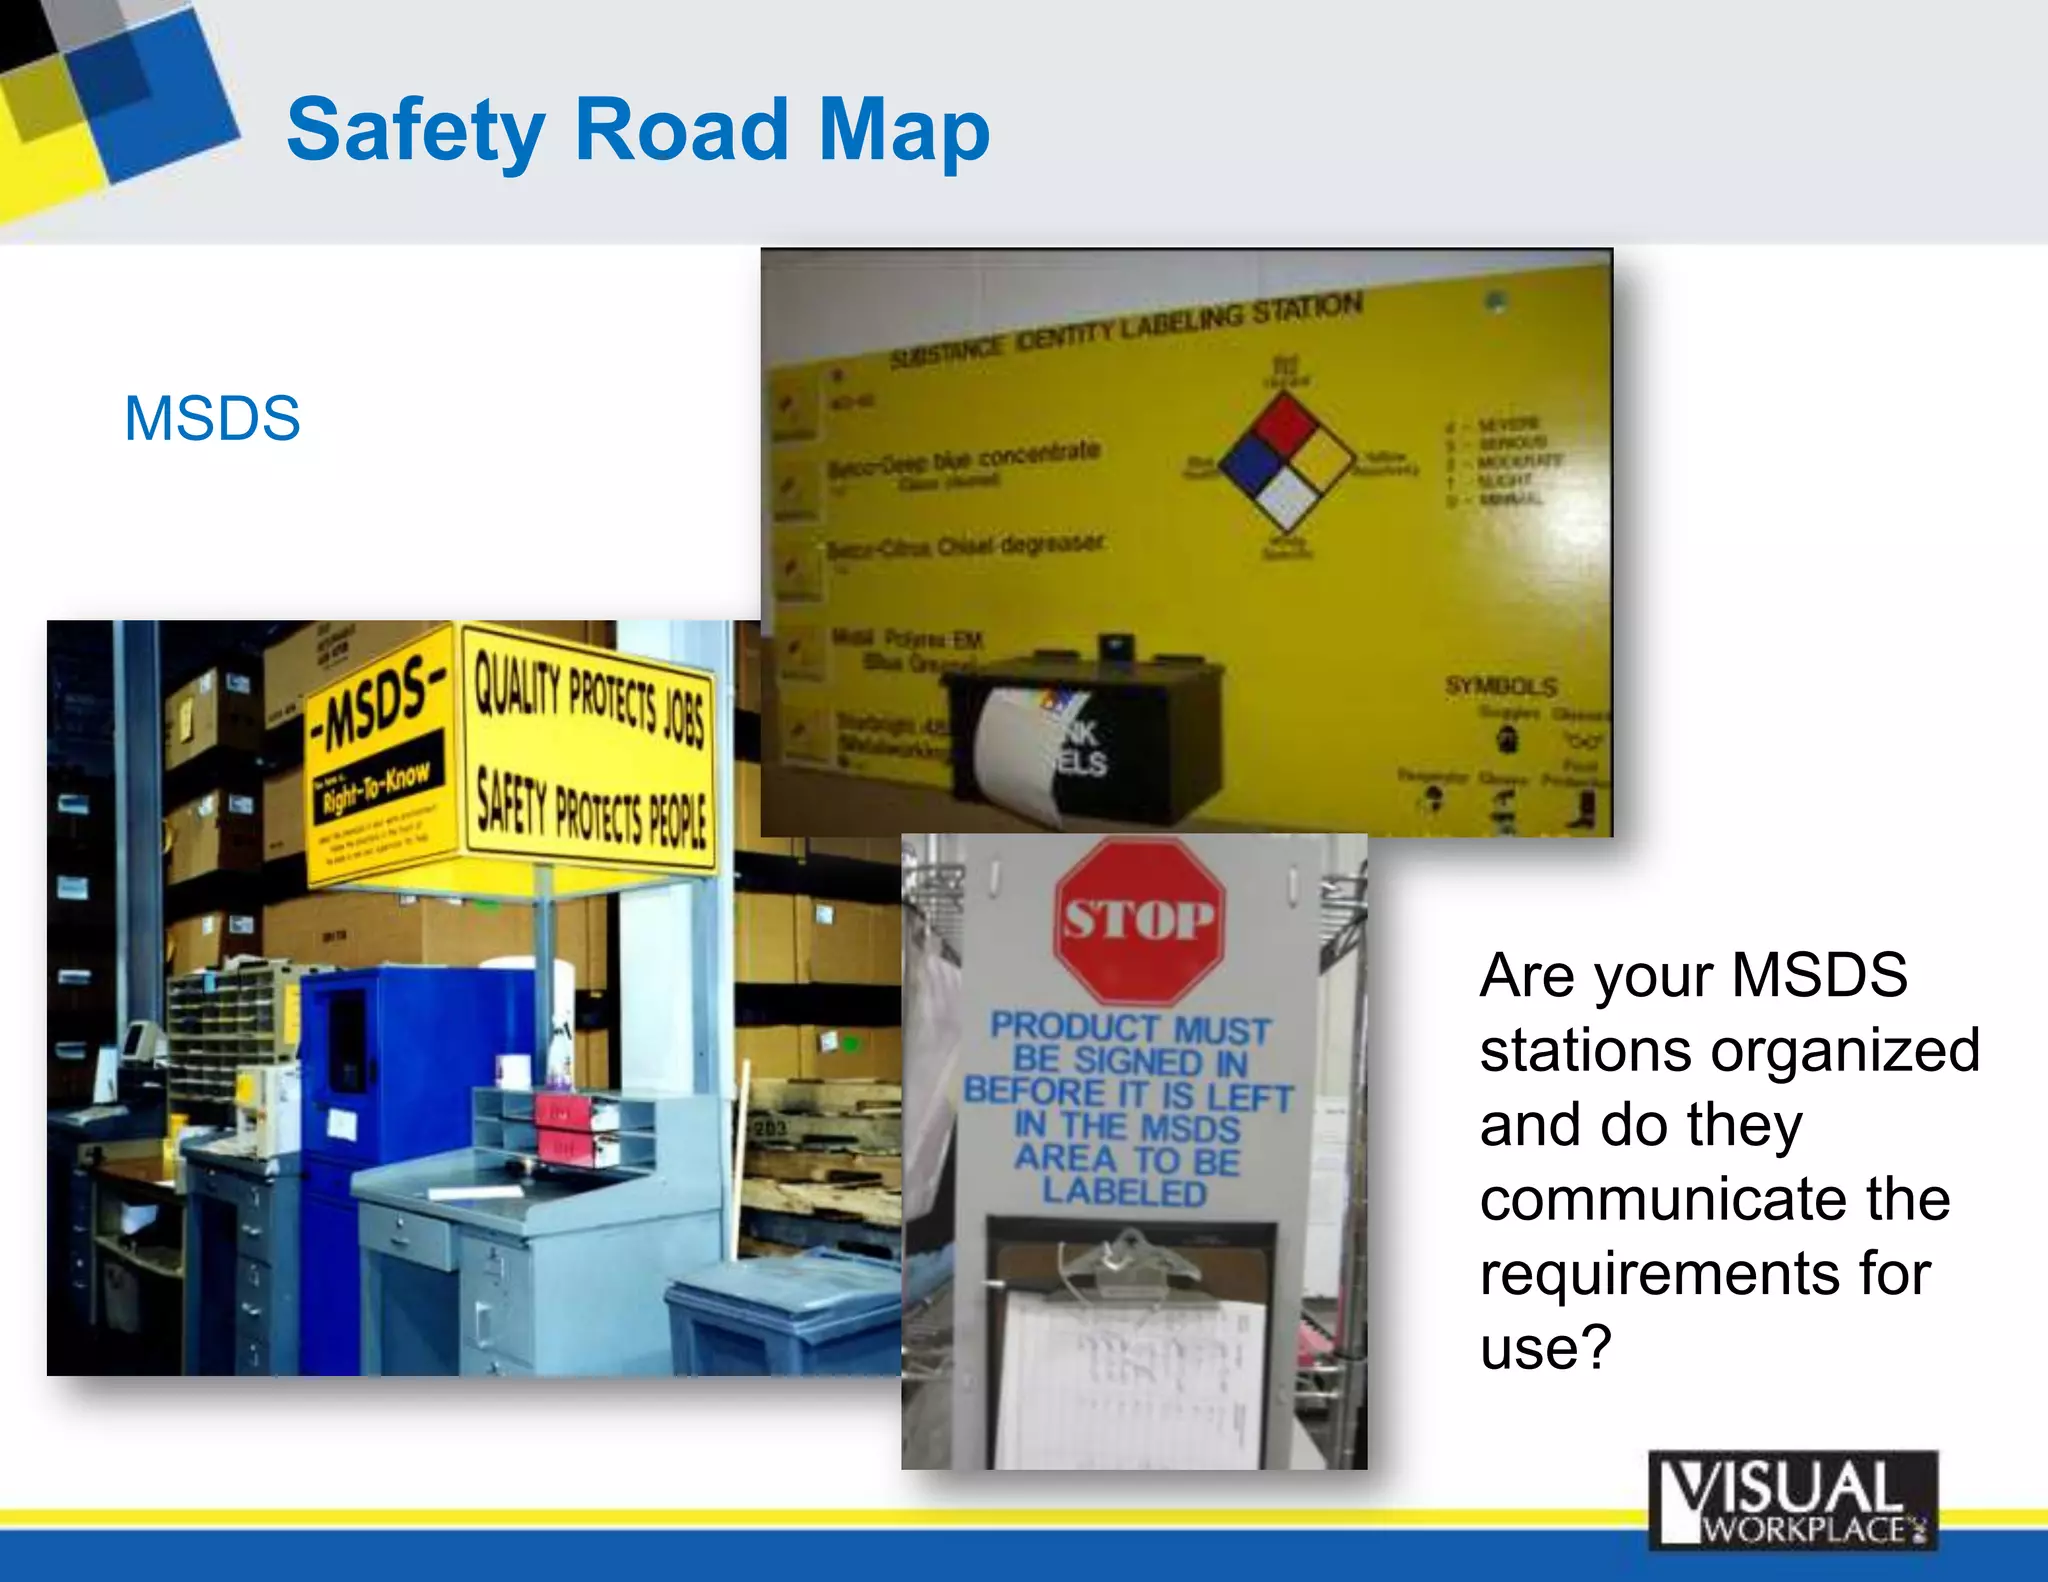


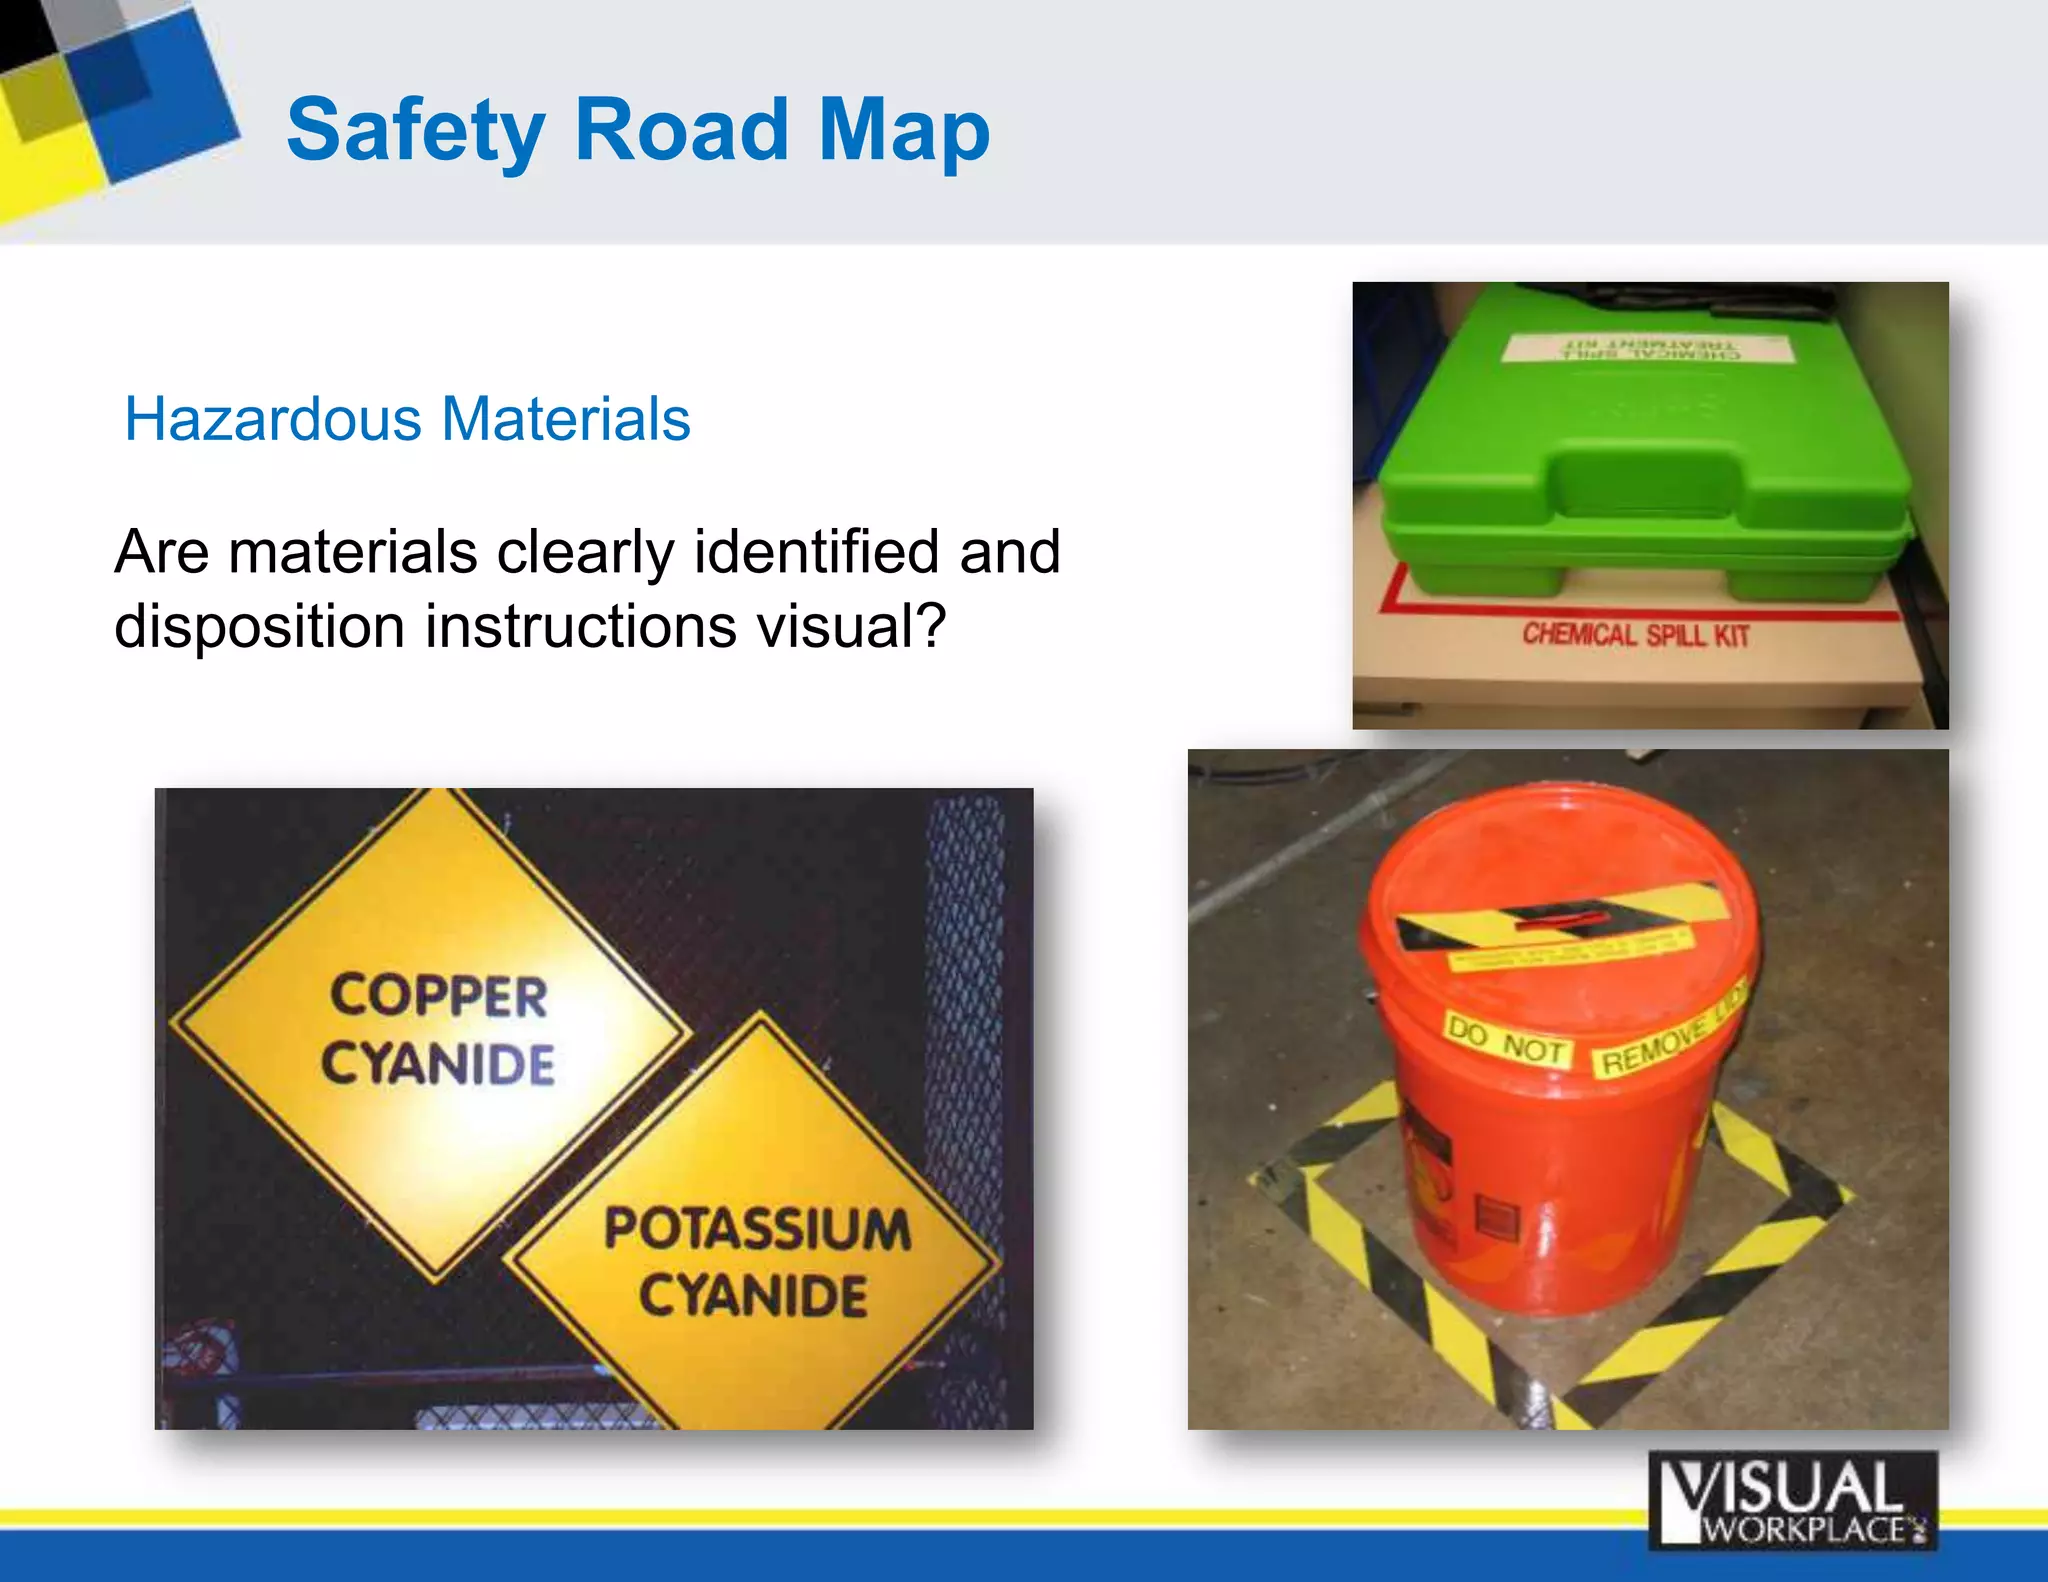
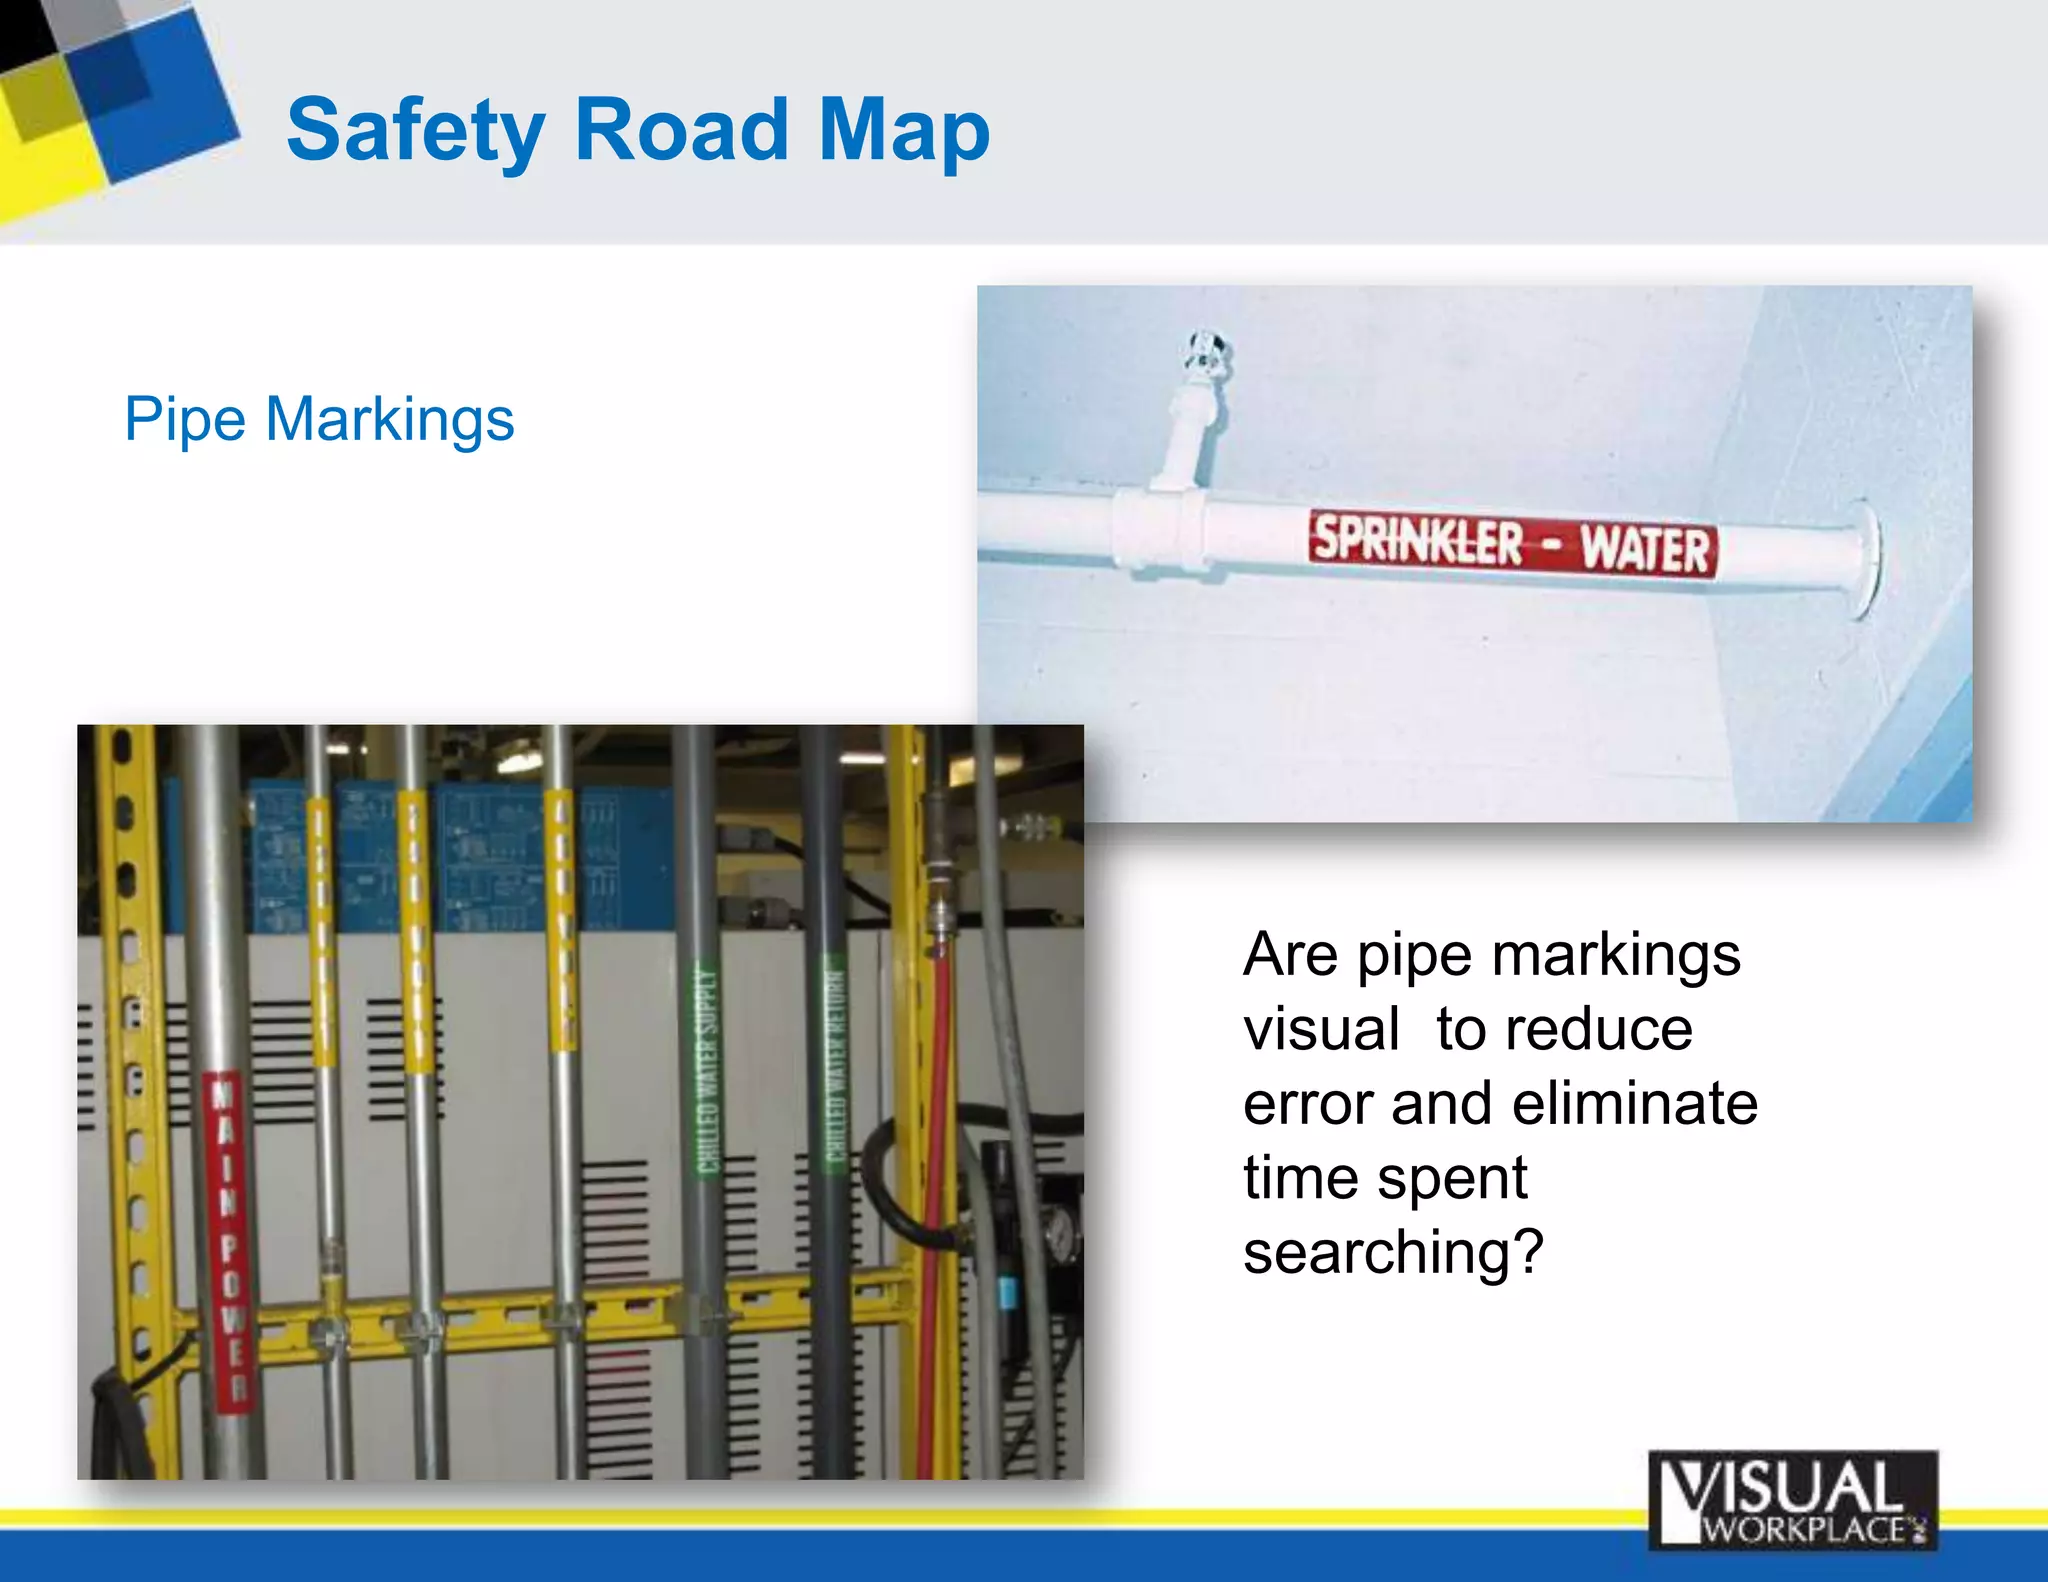
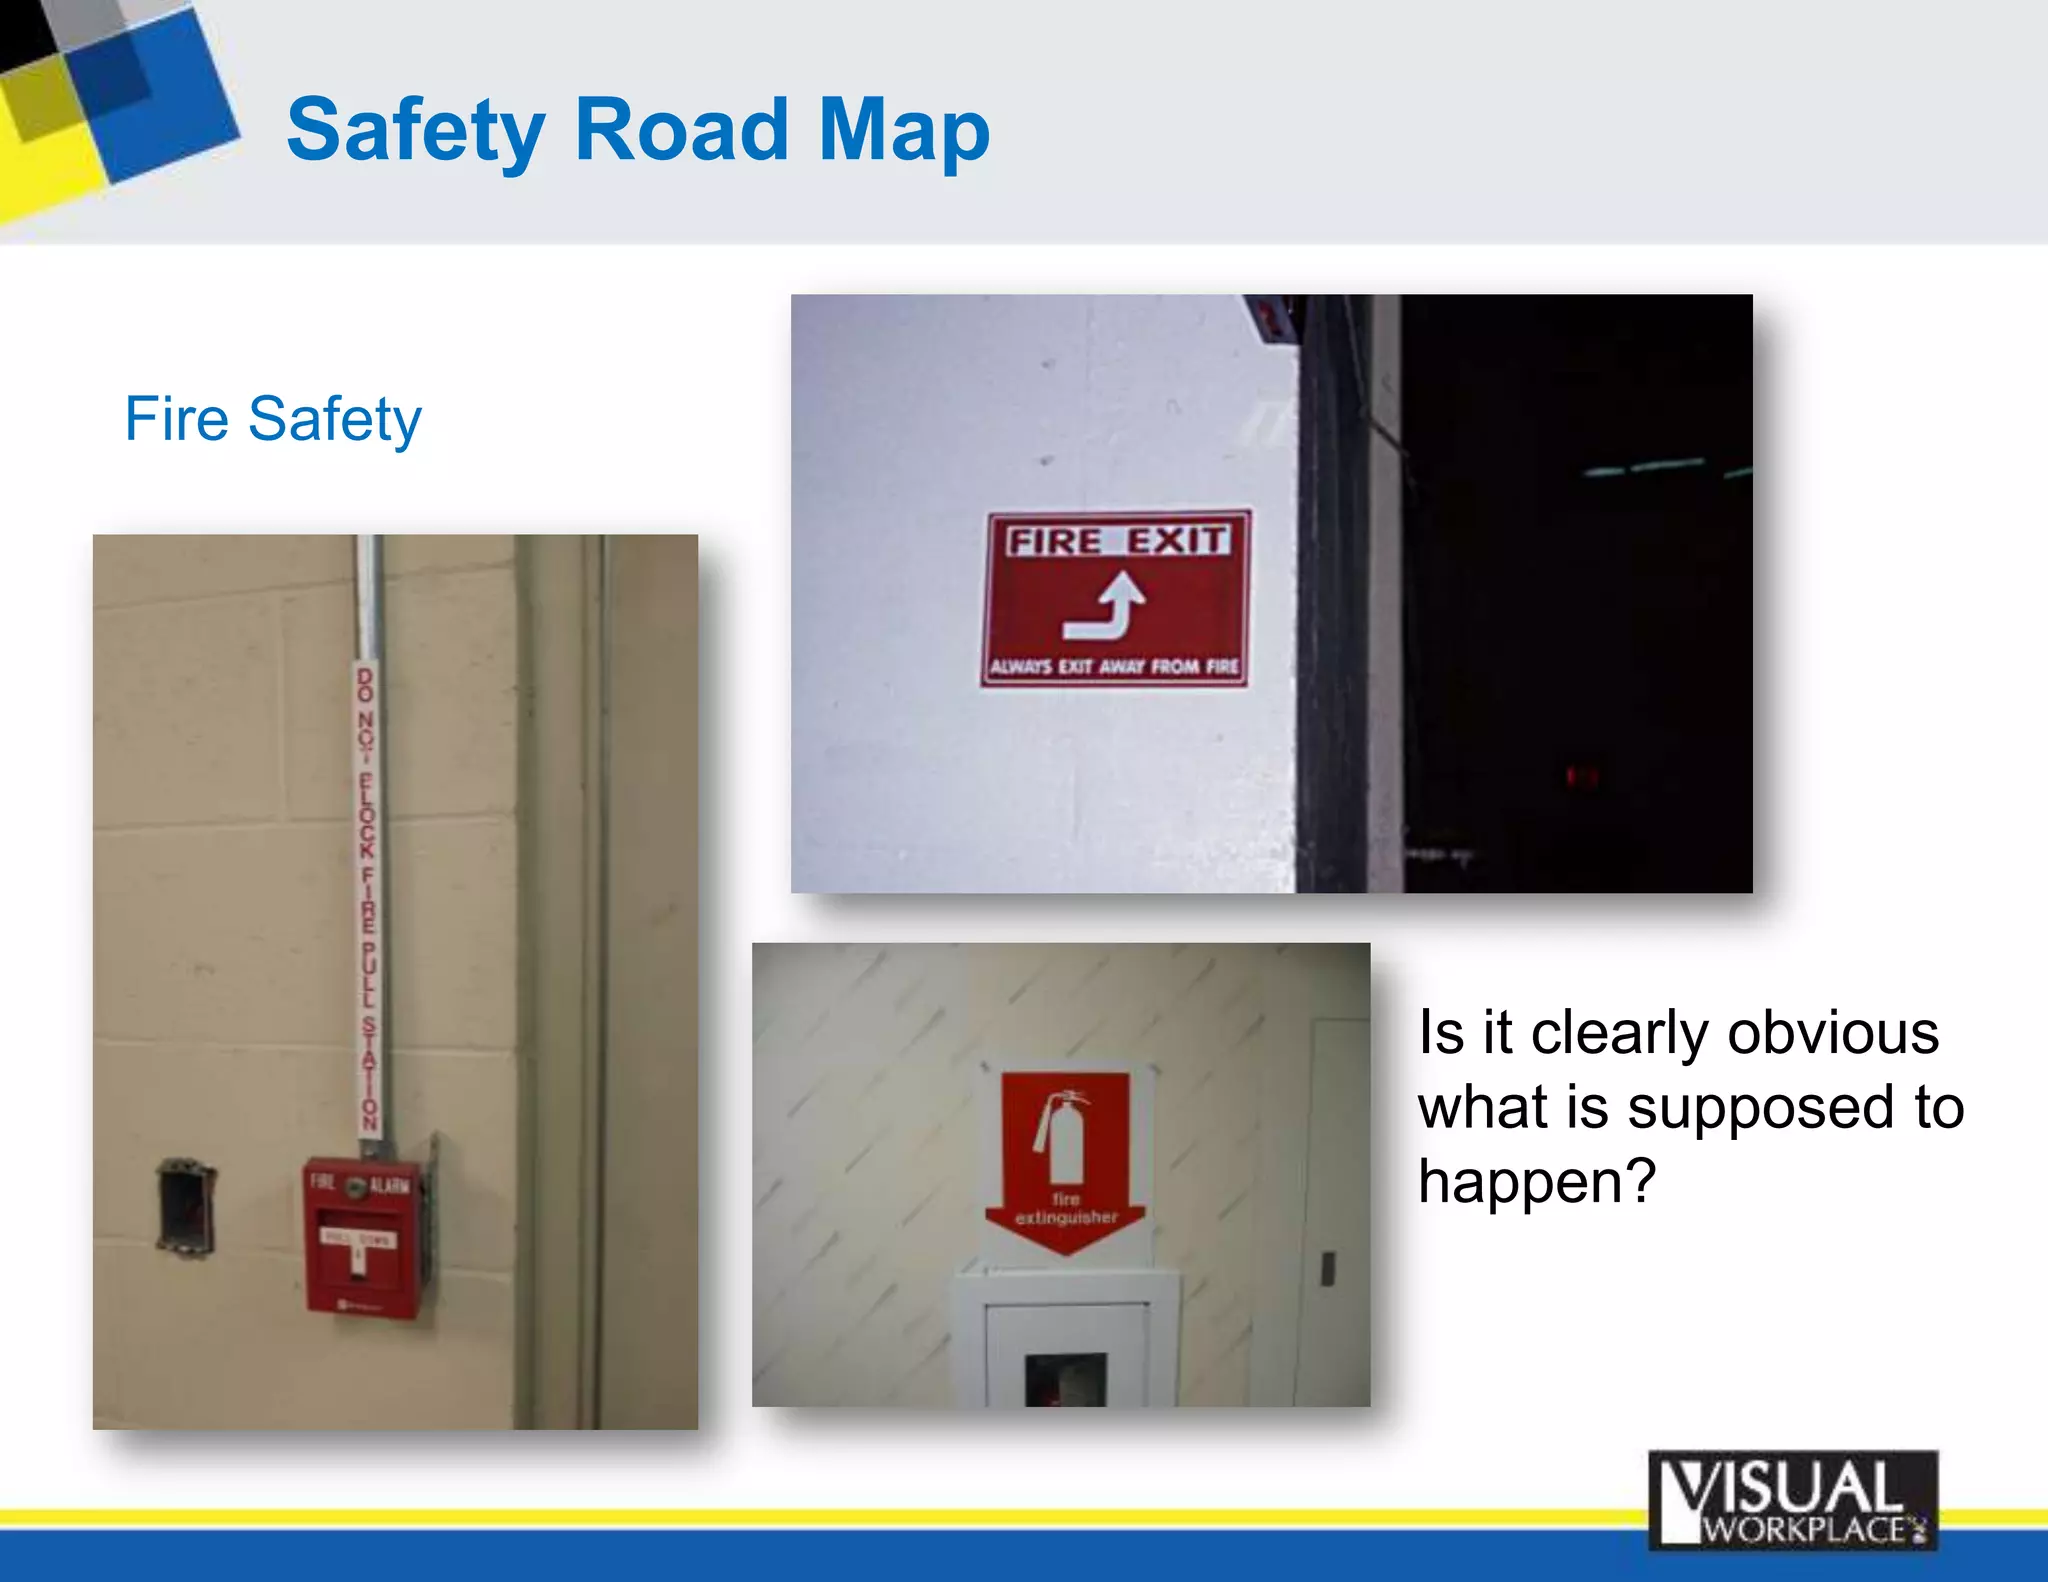
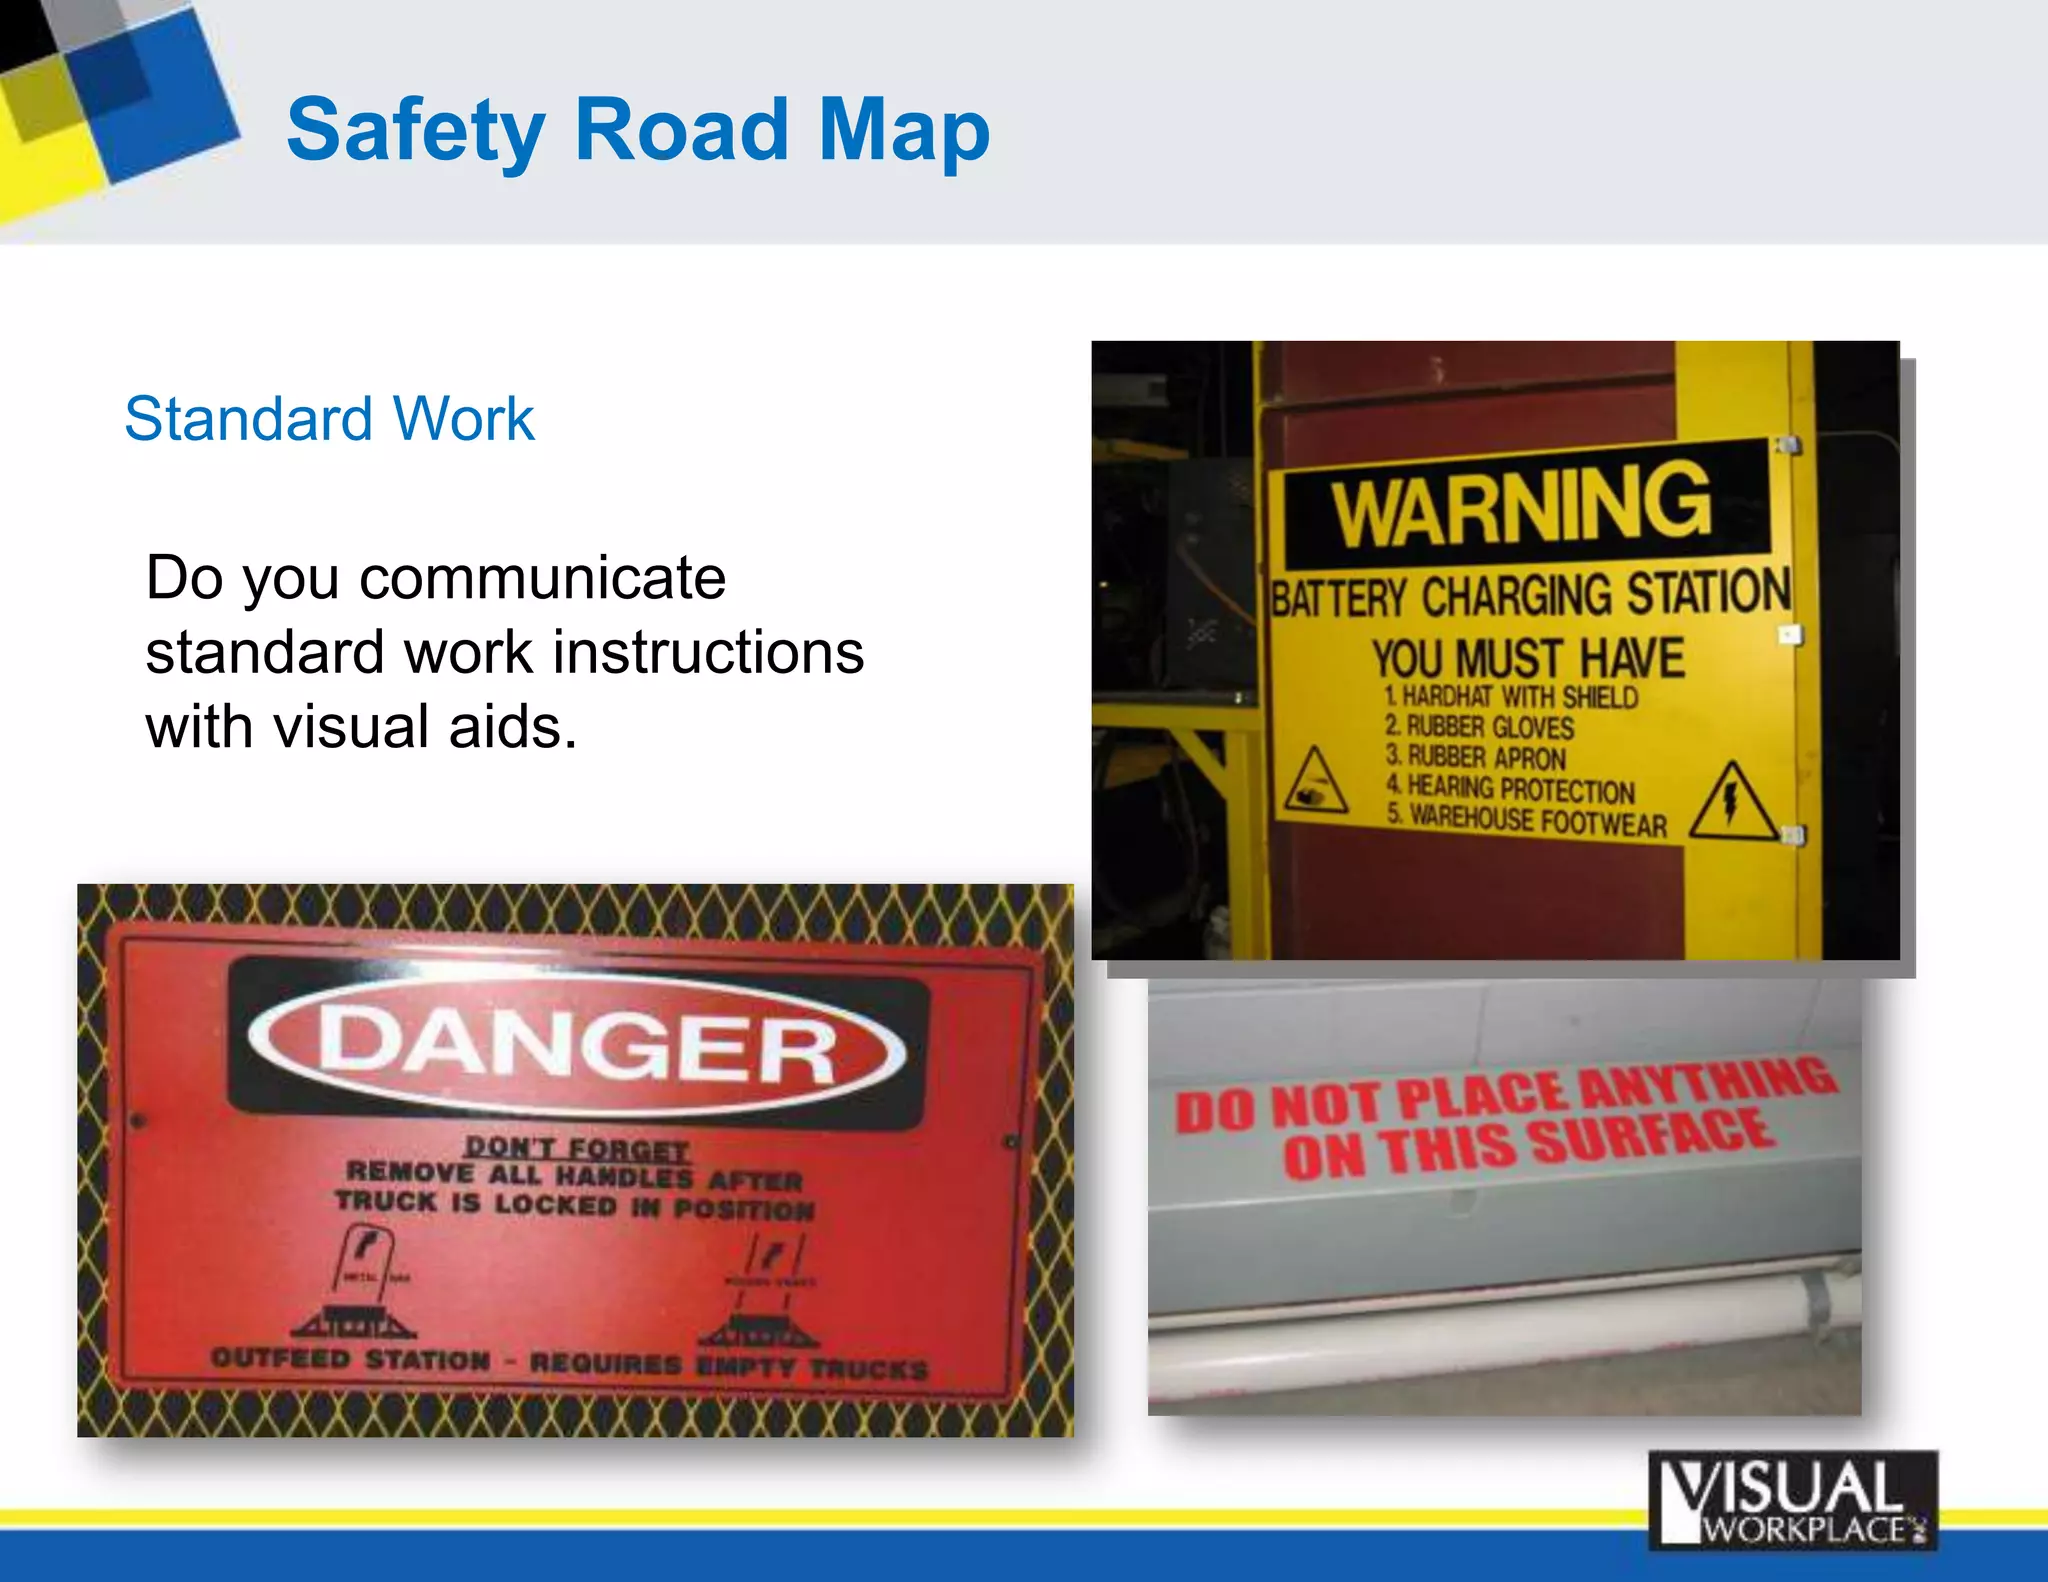

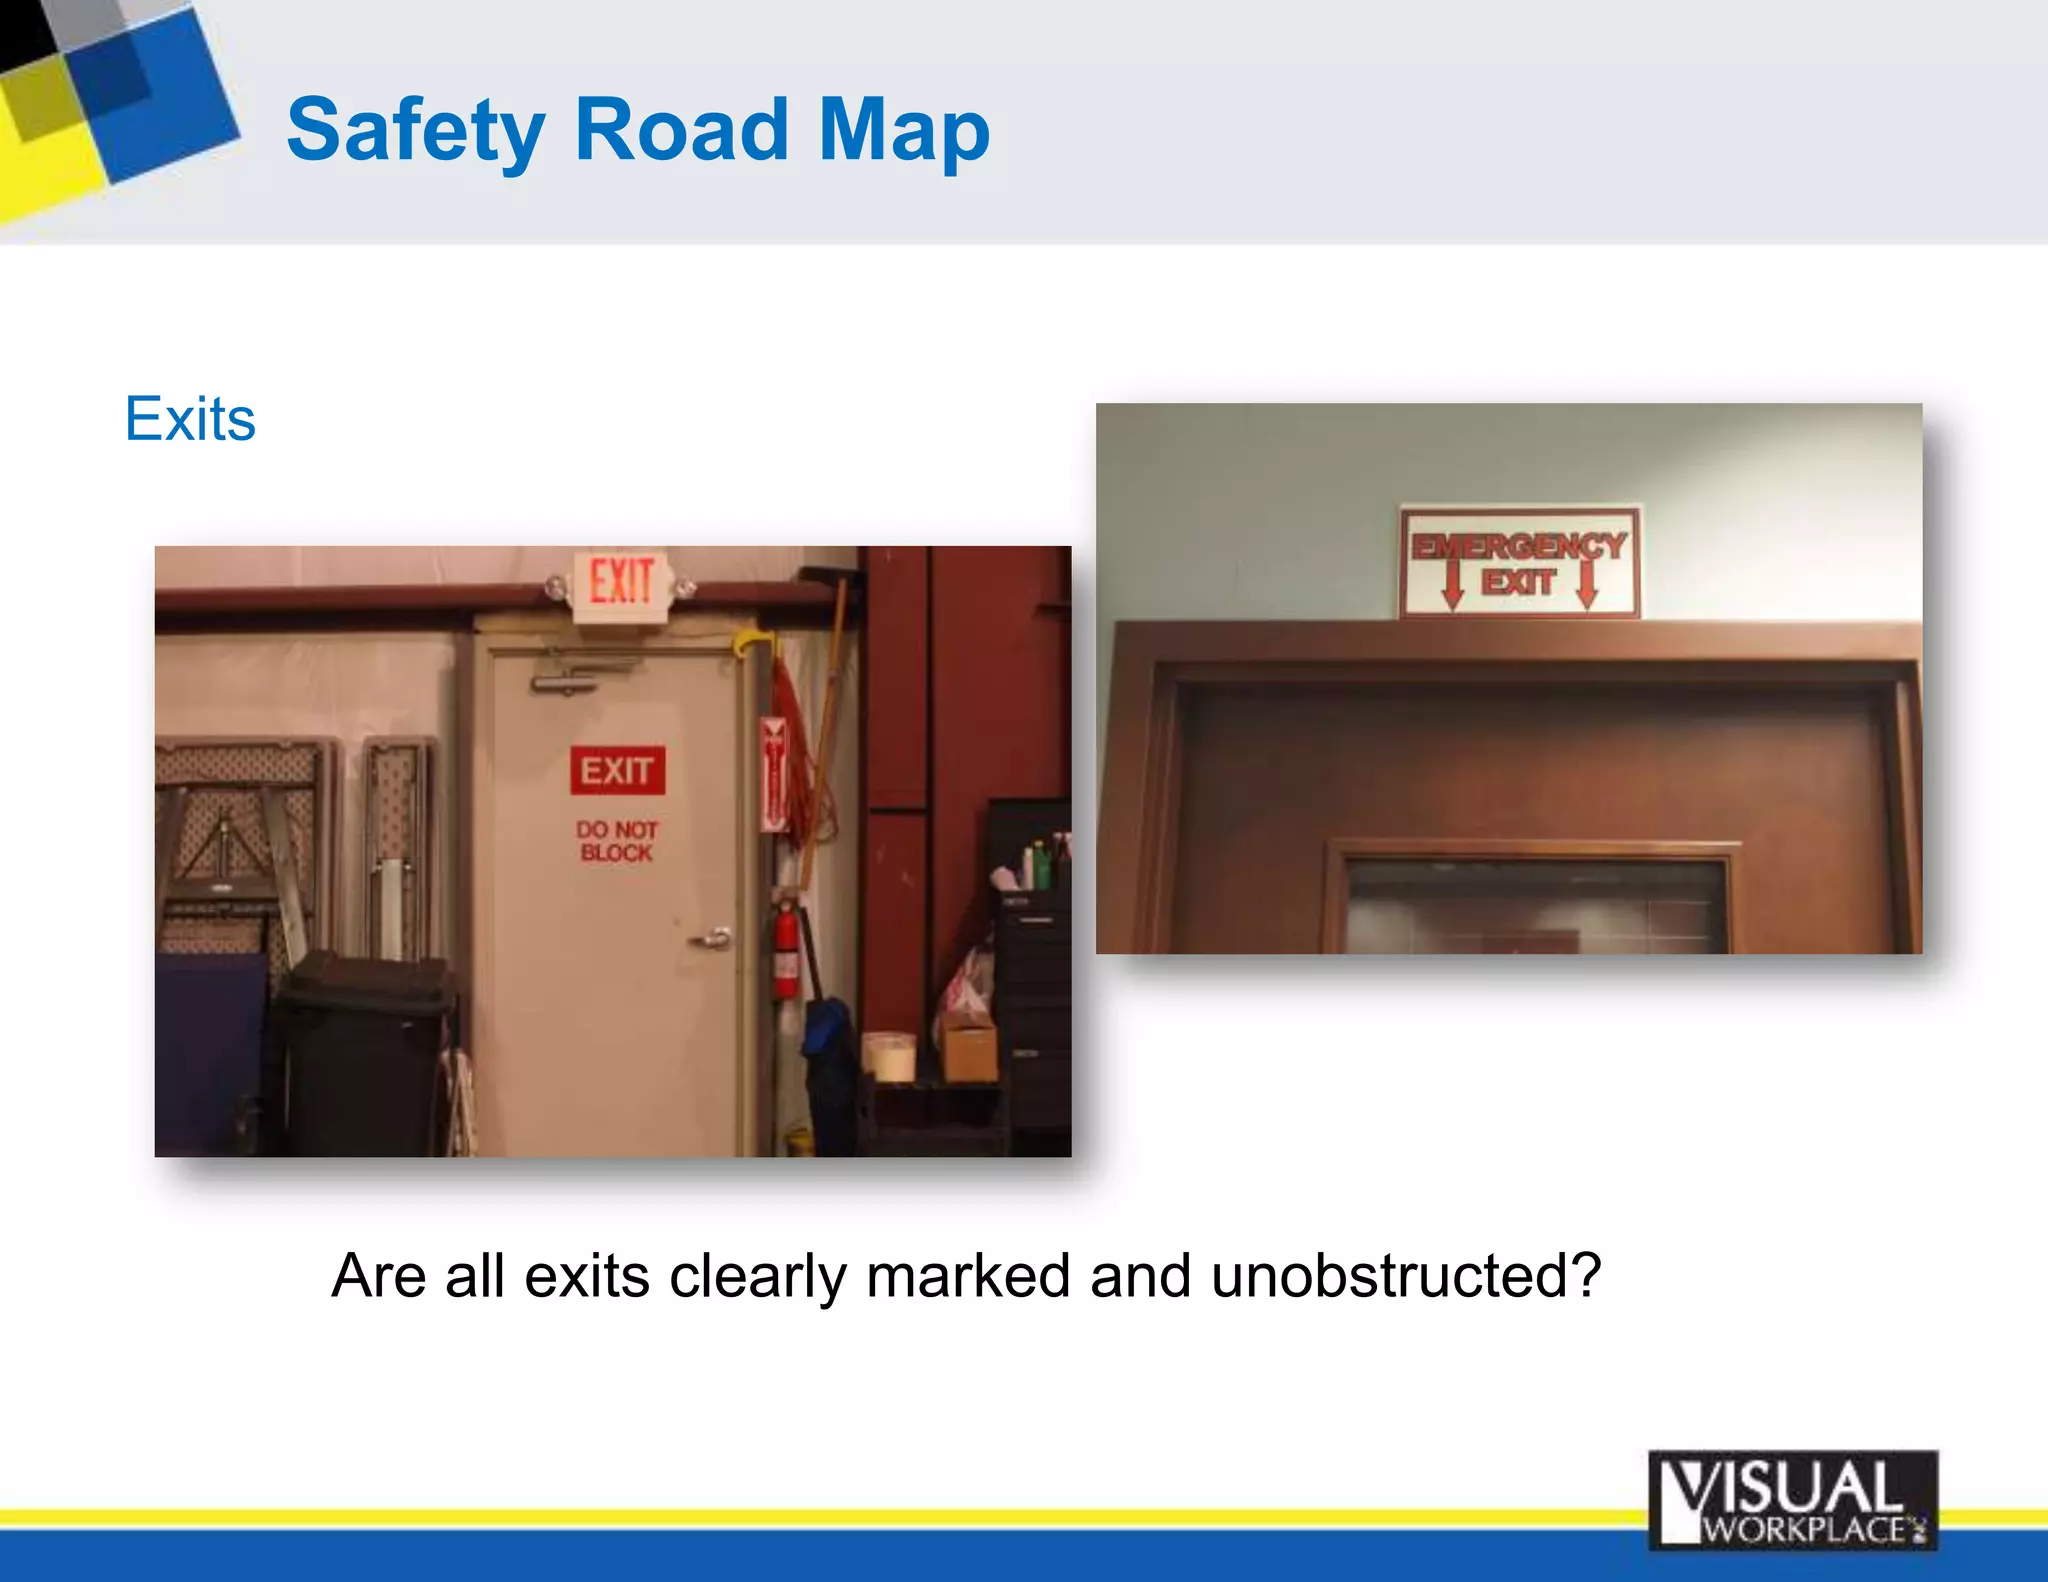


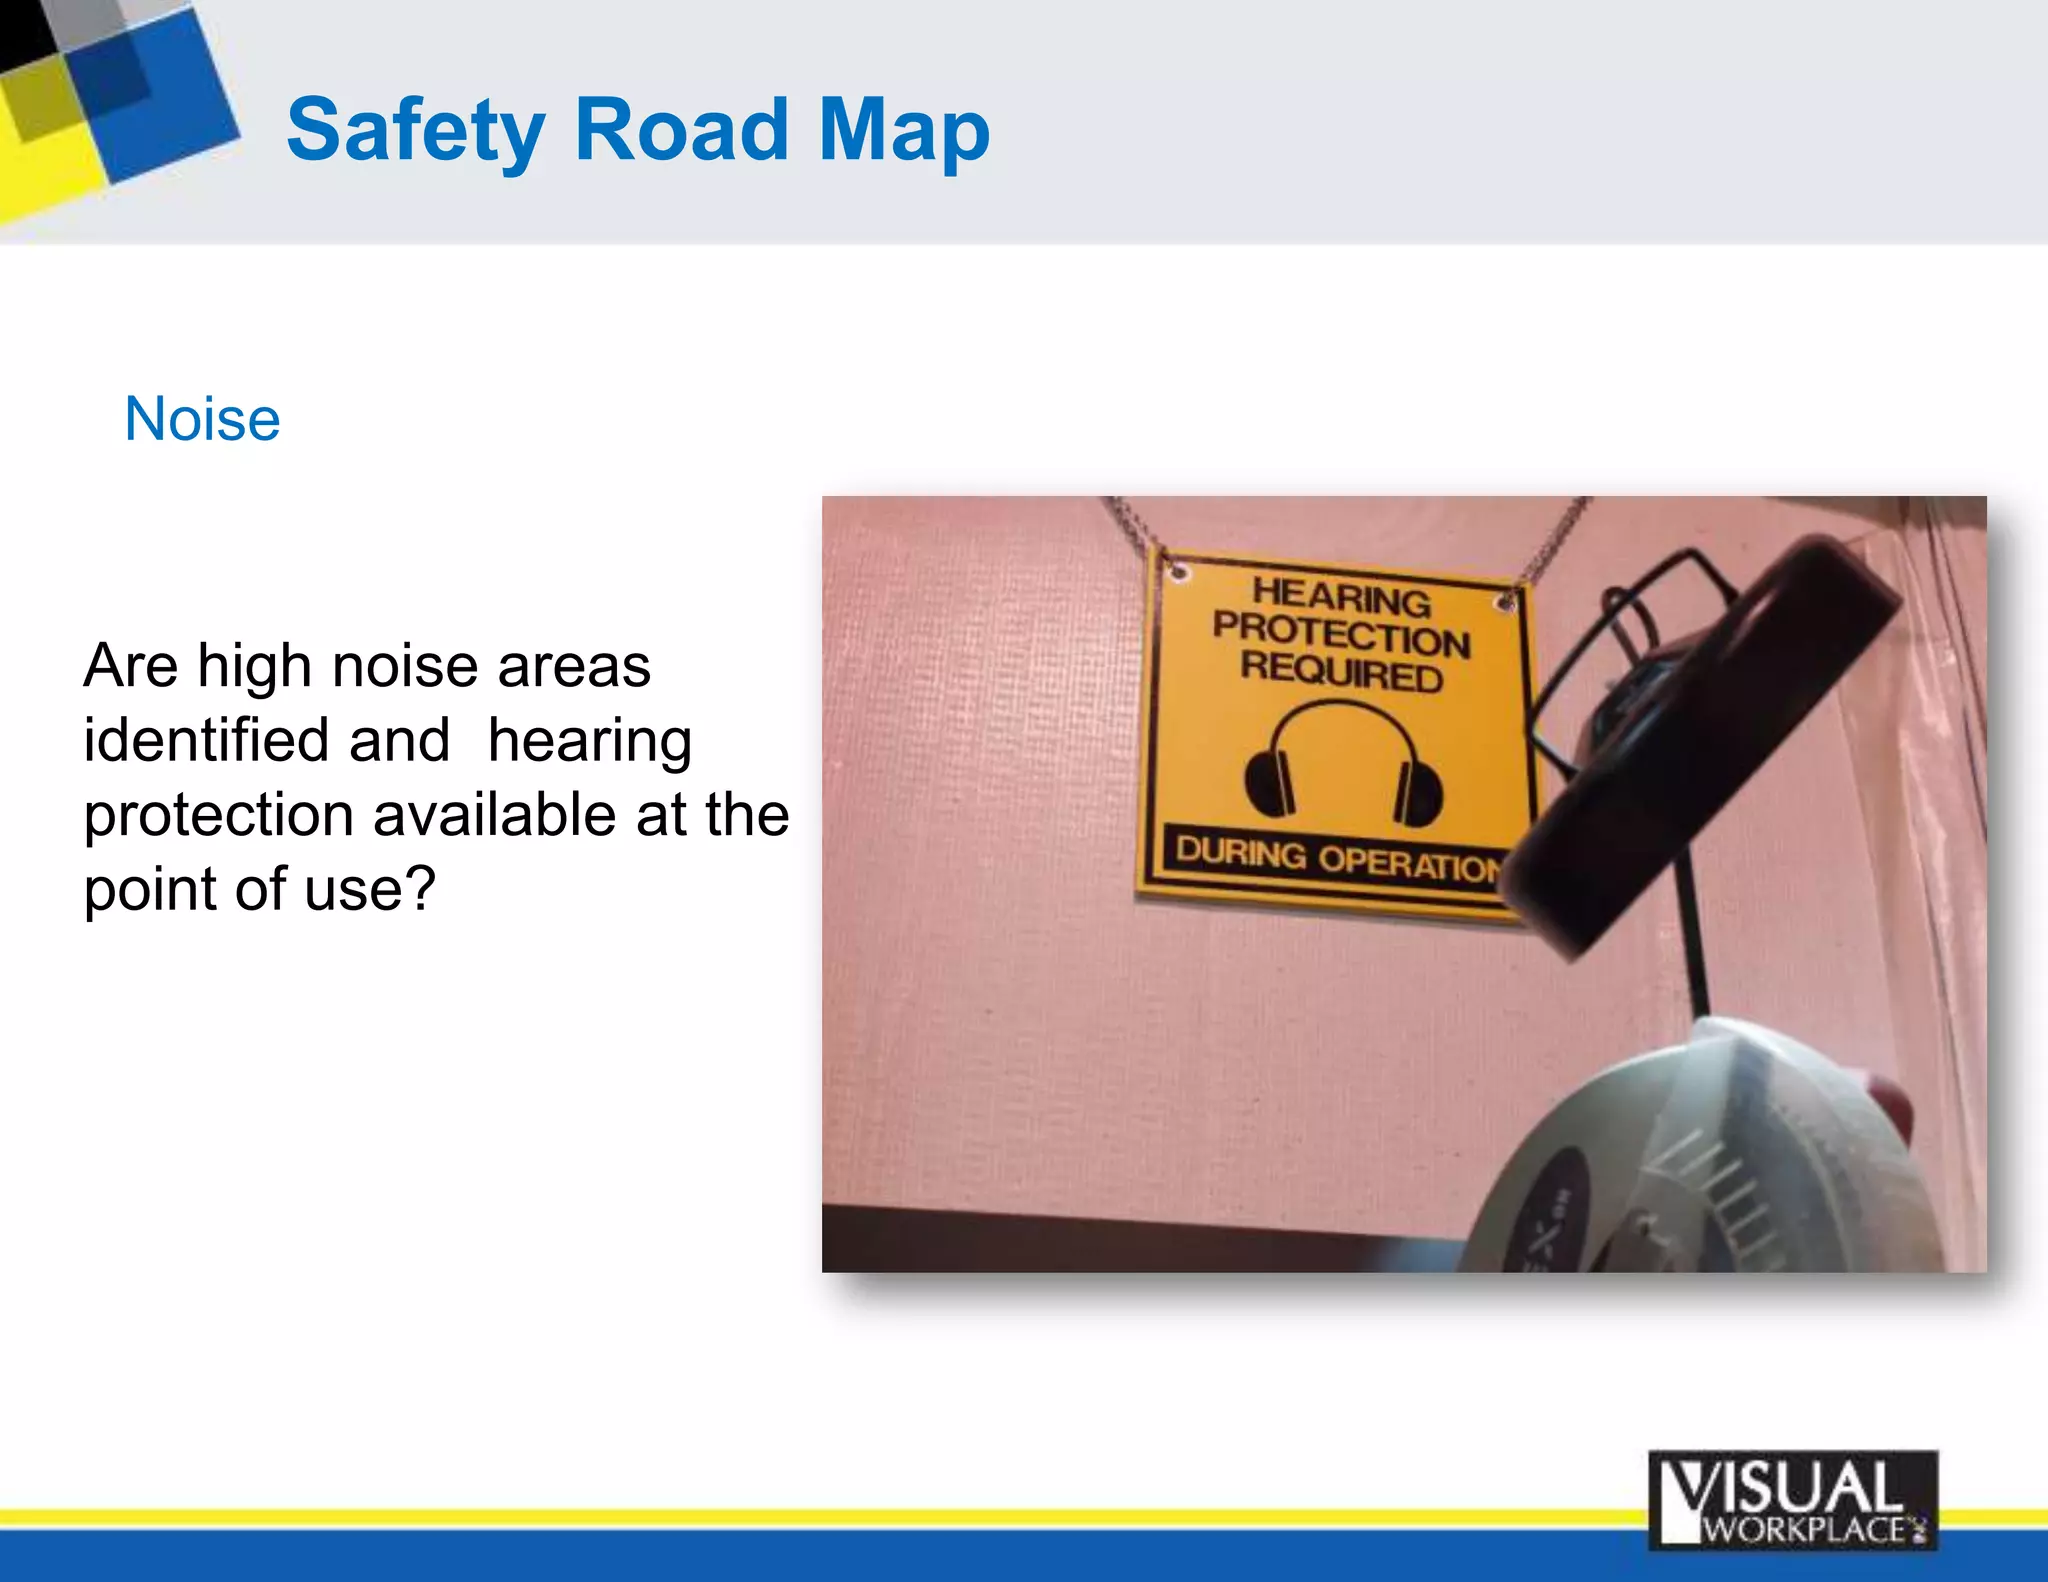
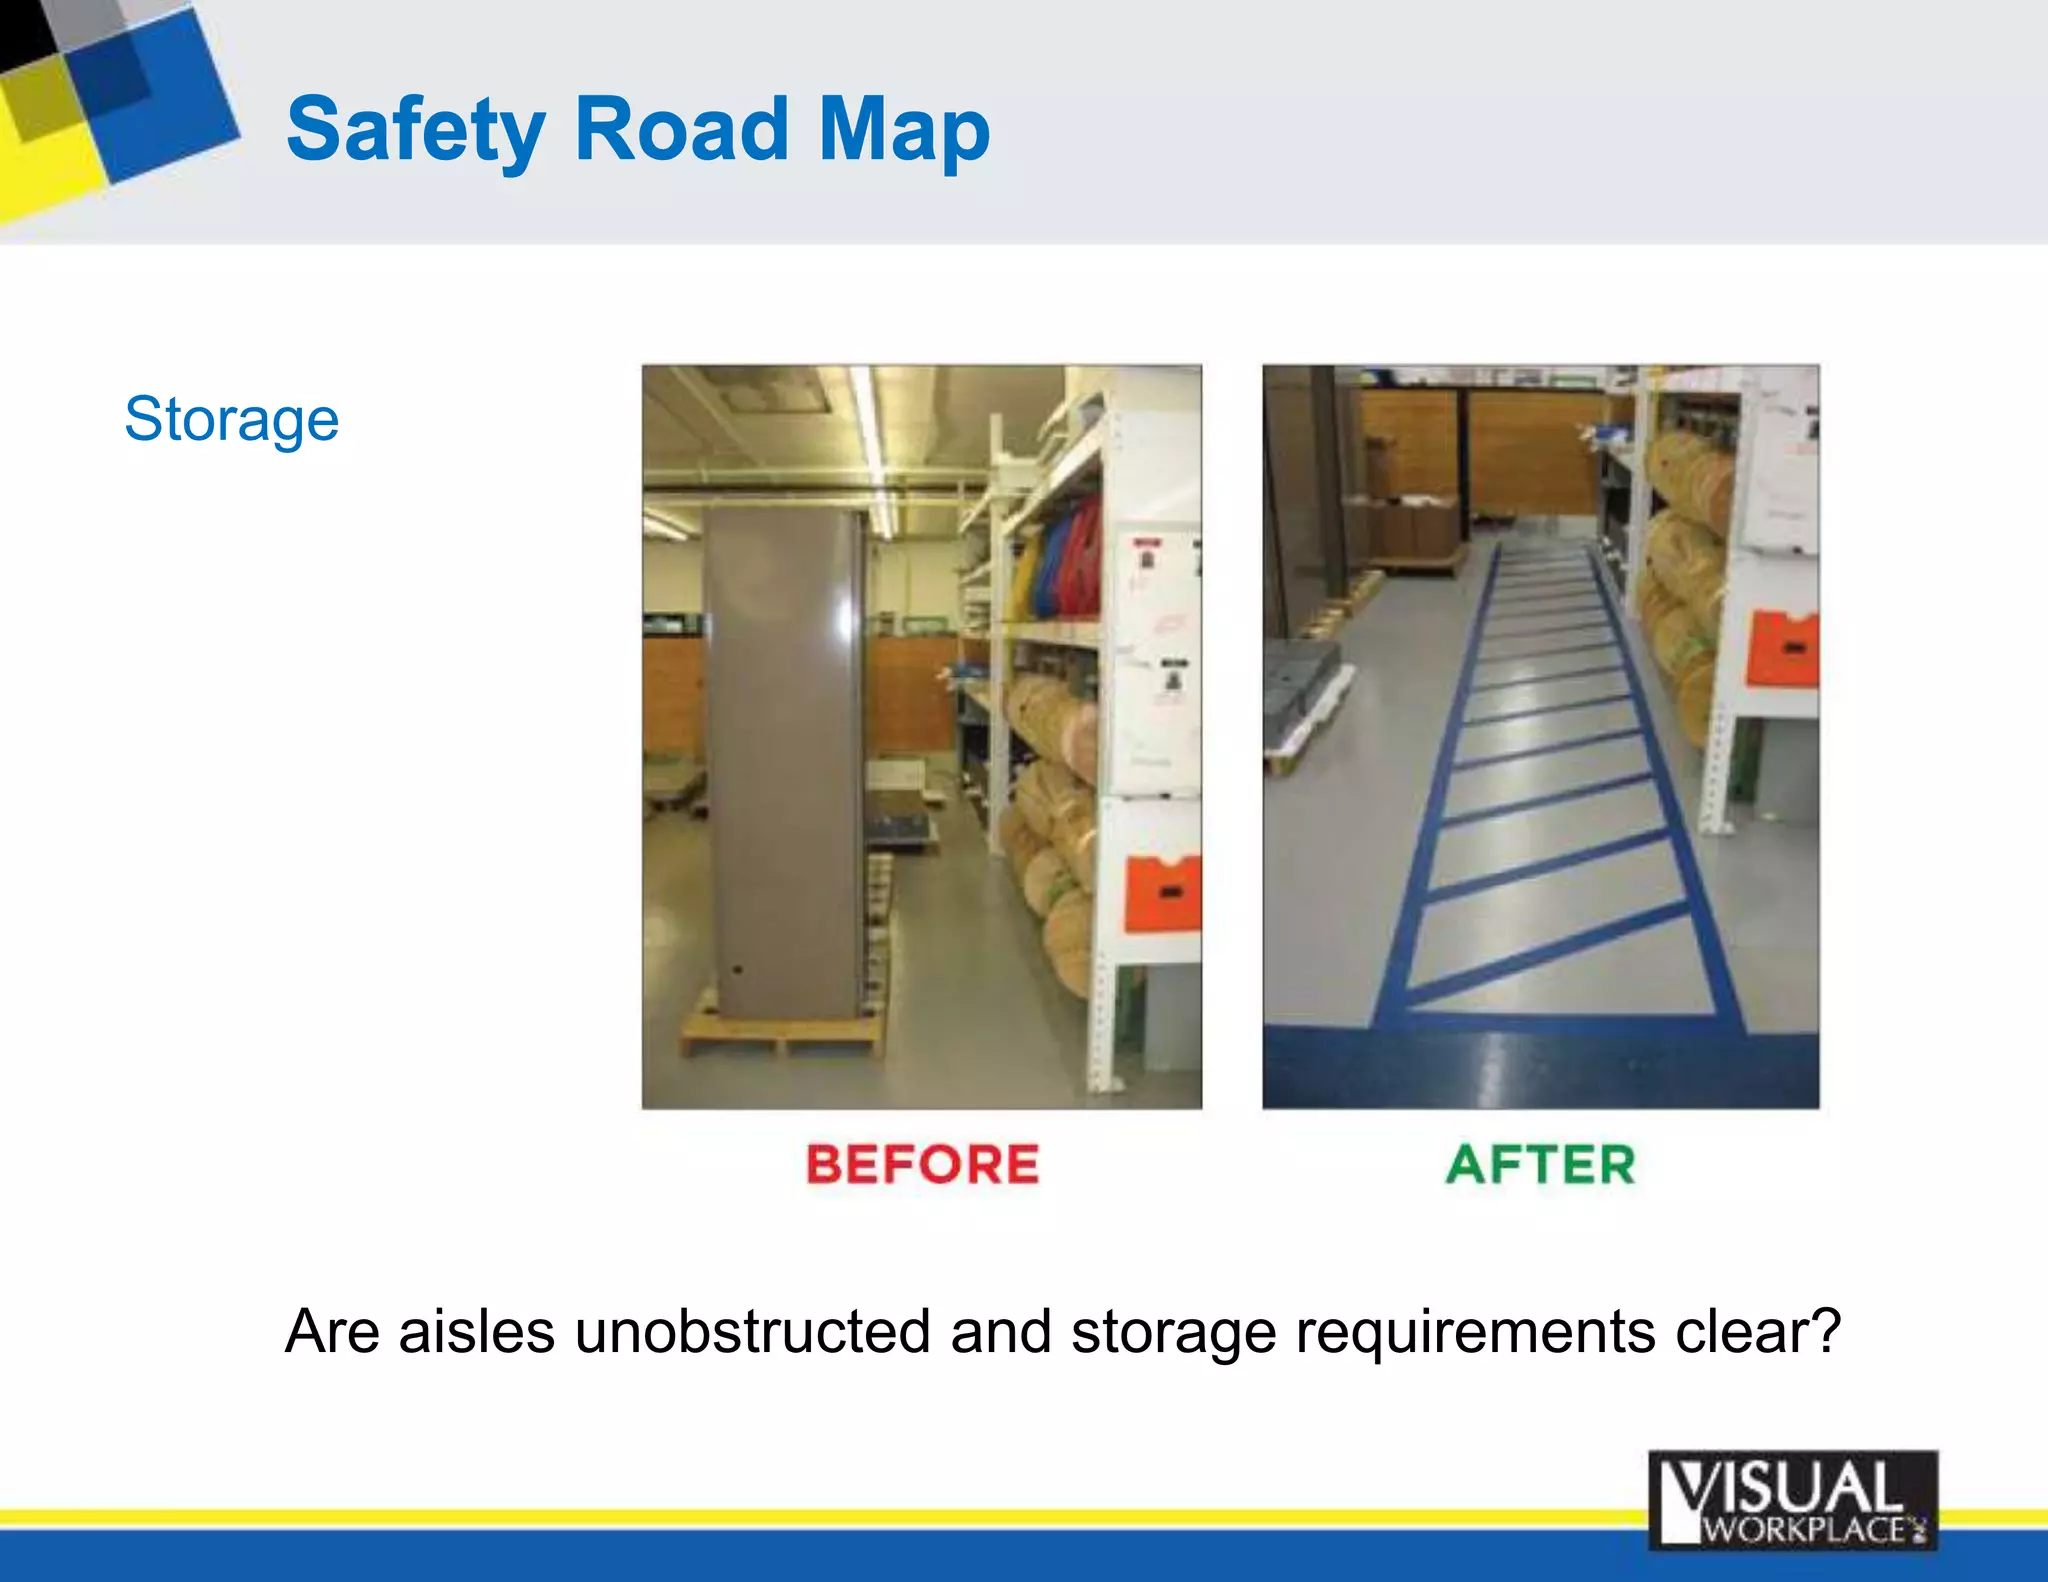
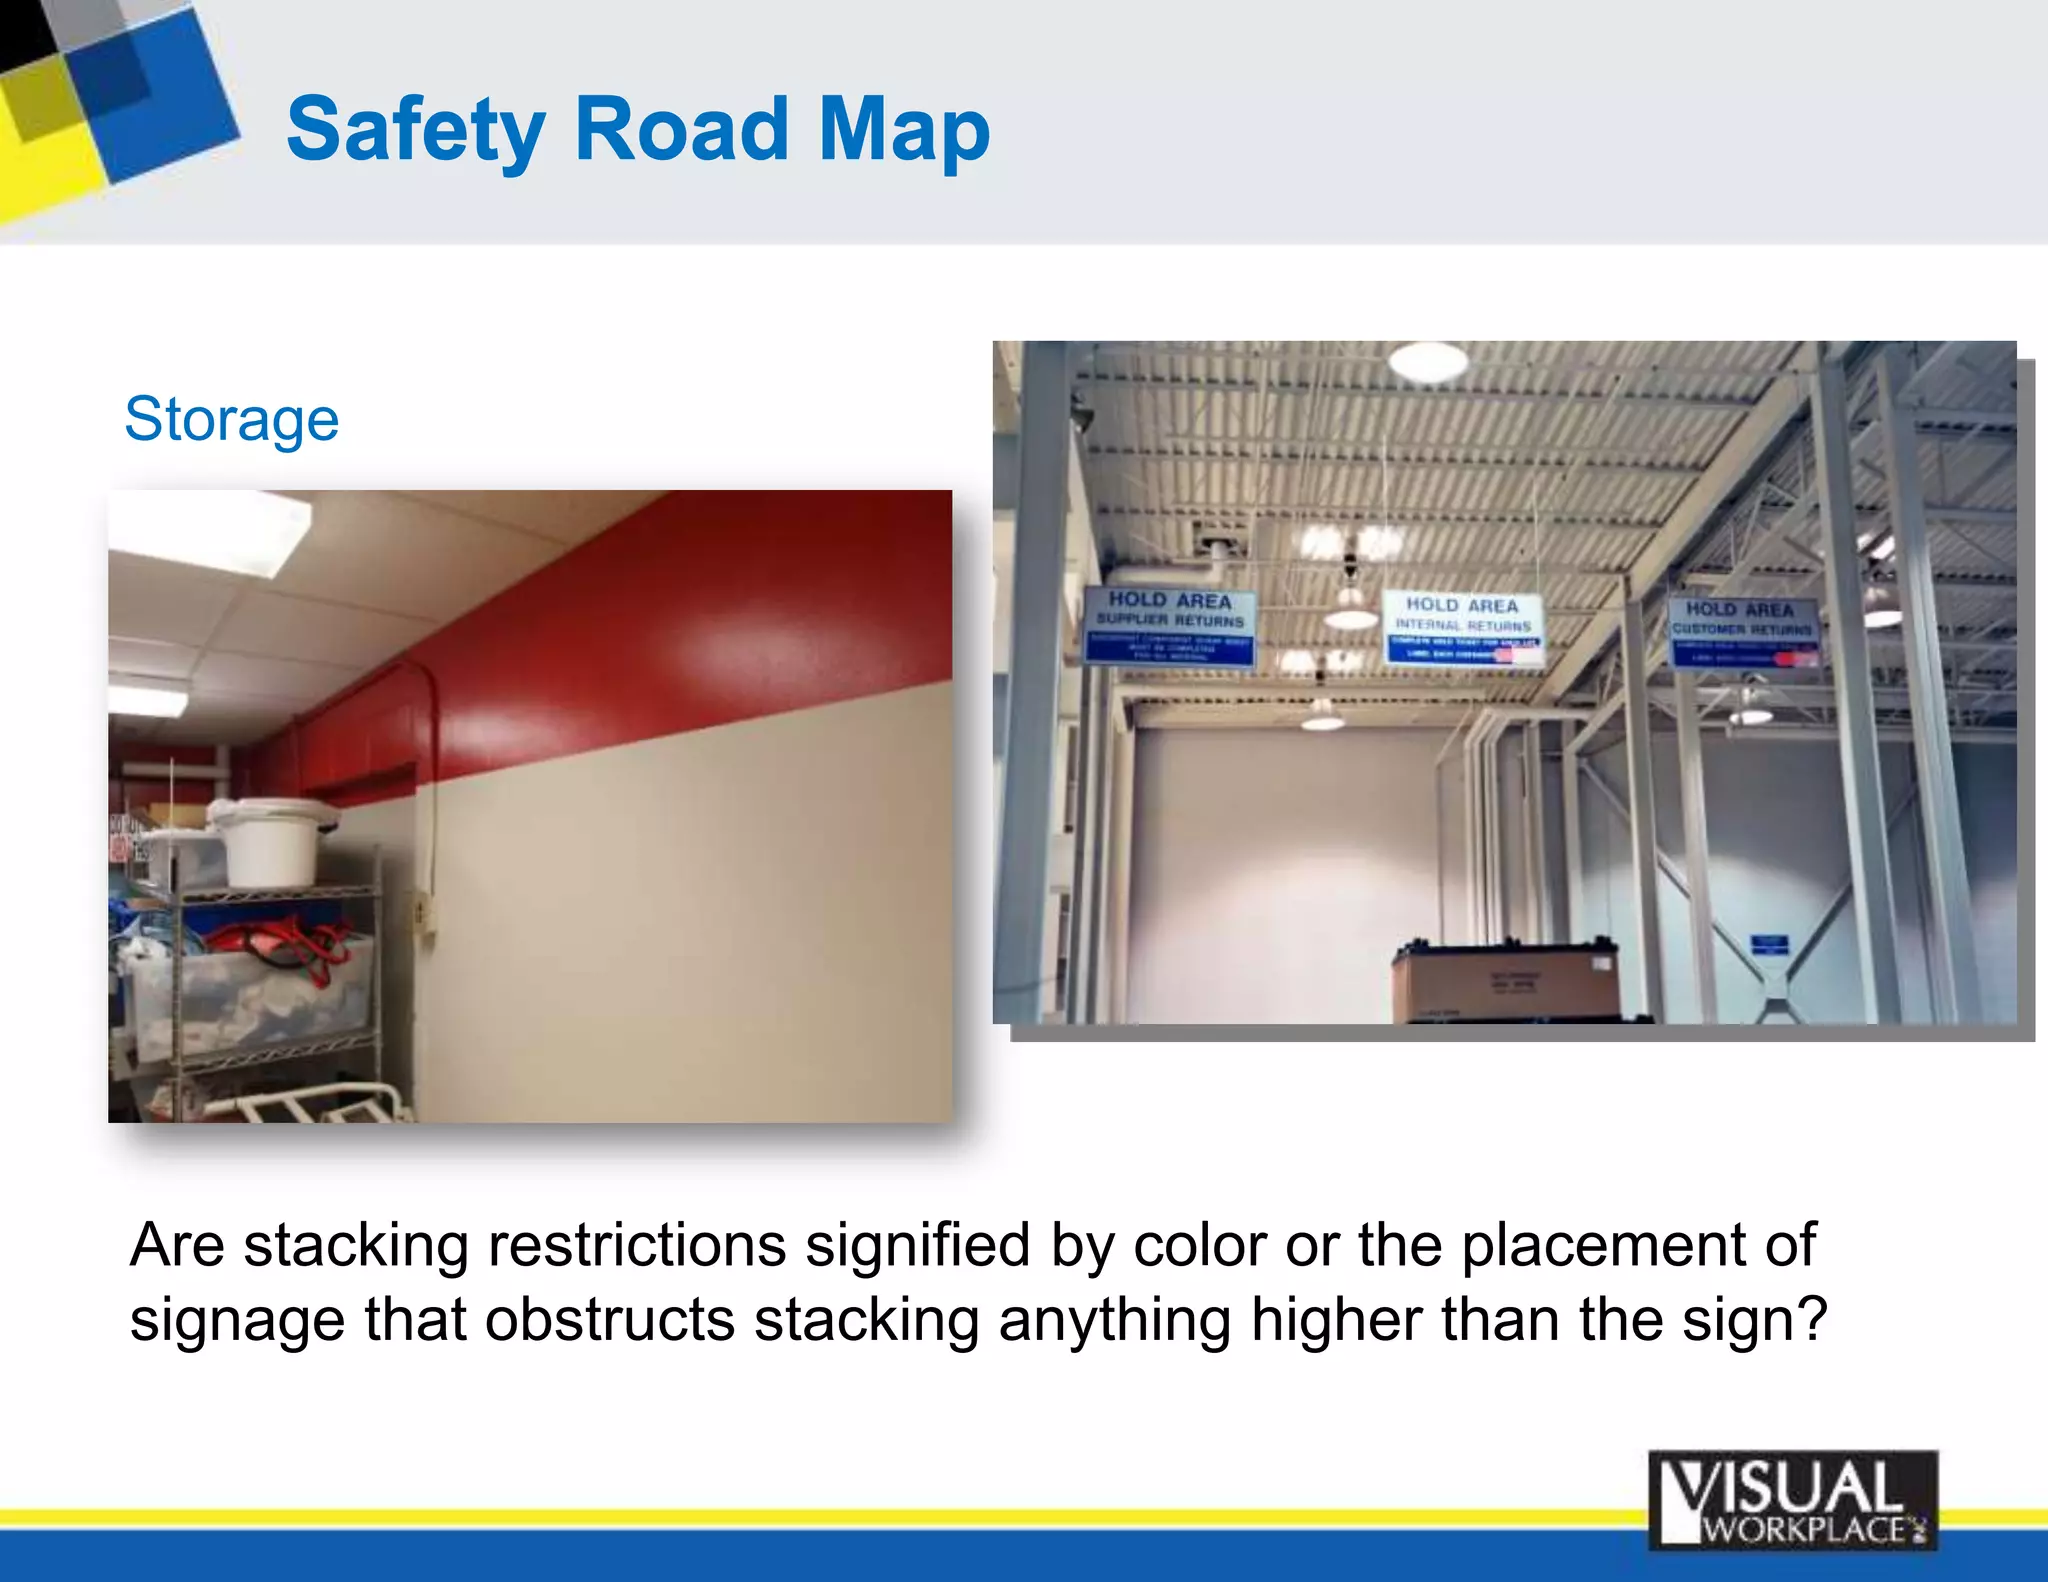


The document discusses the importance of visual management and safety in the workplace. It argues that 83% of what we learn is visual and that a safe workplace is a visual workplace. It then provides a roadmap for creating a visual workplace that includes organizing the workplace, setting standards, measuring performance, and continually improving. A key part of the roadmap is developing a safety roadmap that identifies missing safety information and addresses areas like first aid, emergency response, safety metrics, lock-out/tag-out procedures, personal protective equipment, maintenance, and hazardous materials. The overall goal is to use visual cues to direct behavior, eliminate risks, and reduce workplace injuries.


![Qc Training Slides 20 01 2010 [Compatibility Mode]](https://cdn.slidesharecdn.com/ss_thumbnails/qctrainingslides20012010compatibilitymode-13089271108511-phpapp02-110624095649-phpapp02-thumbnail.jpg?width=640&height=640&fit=bounds)


