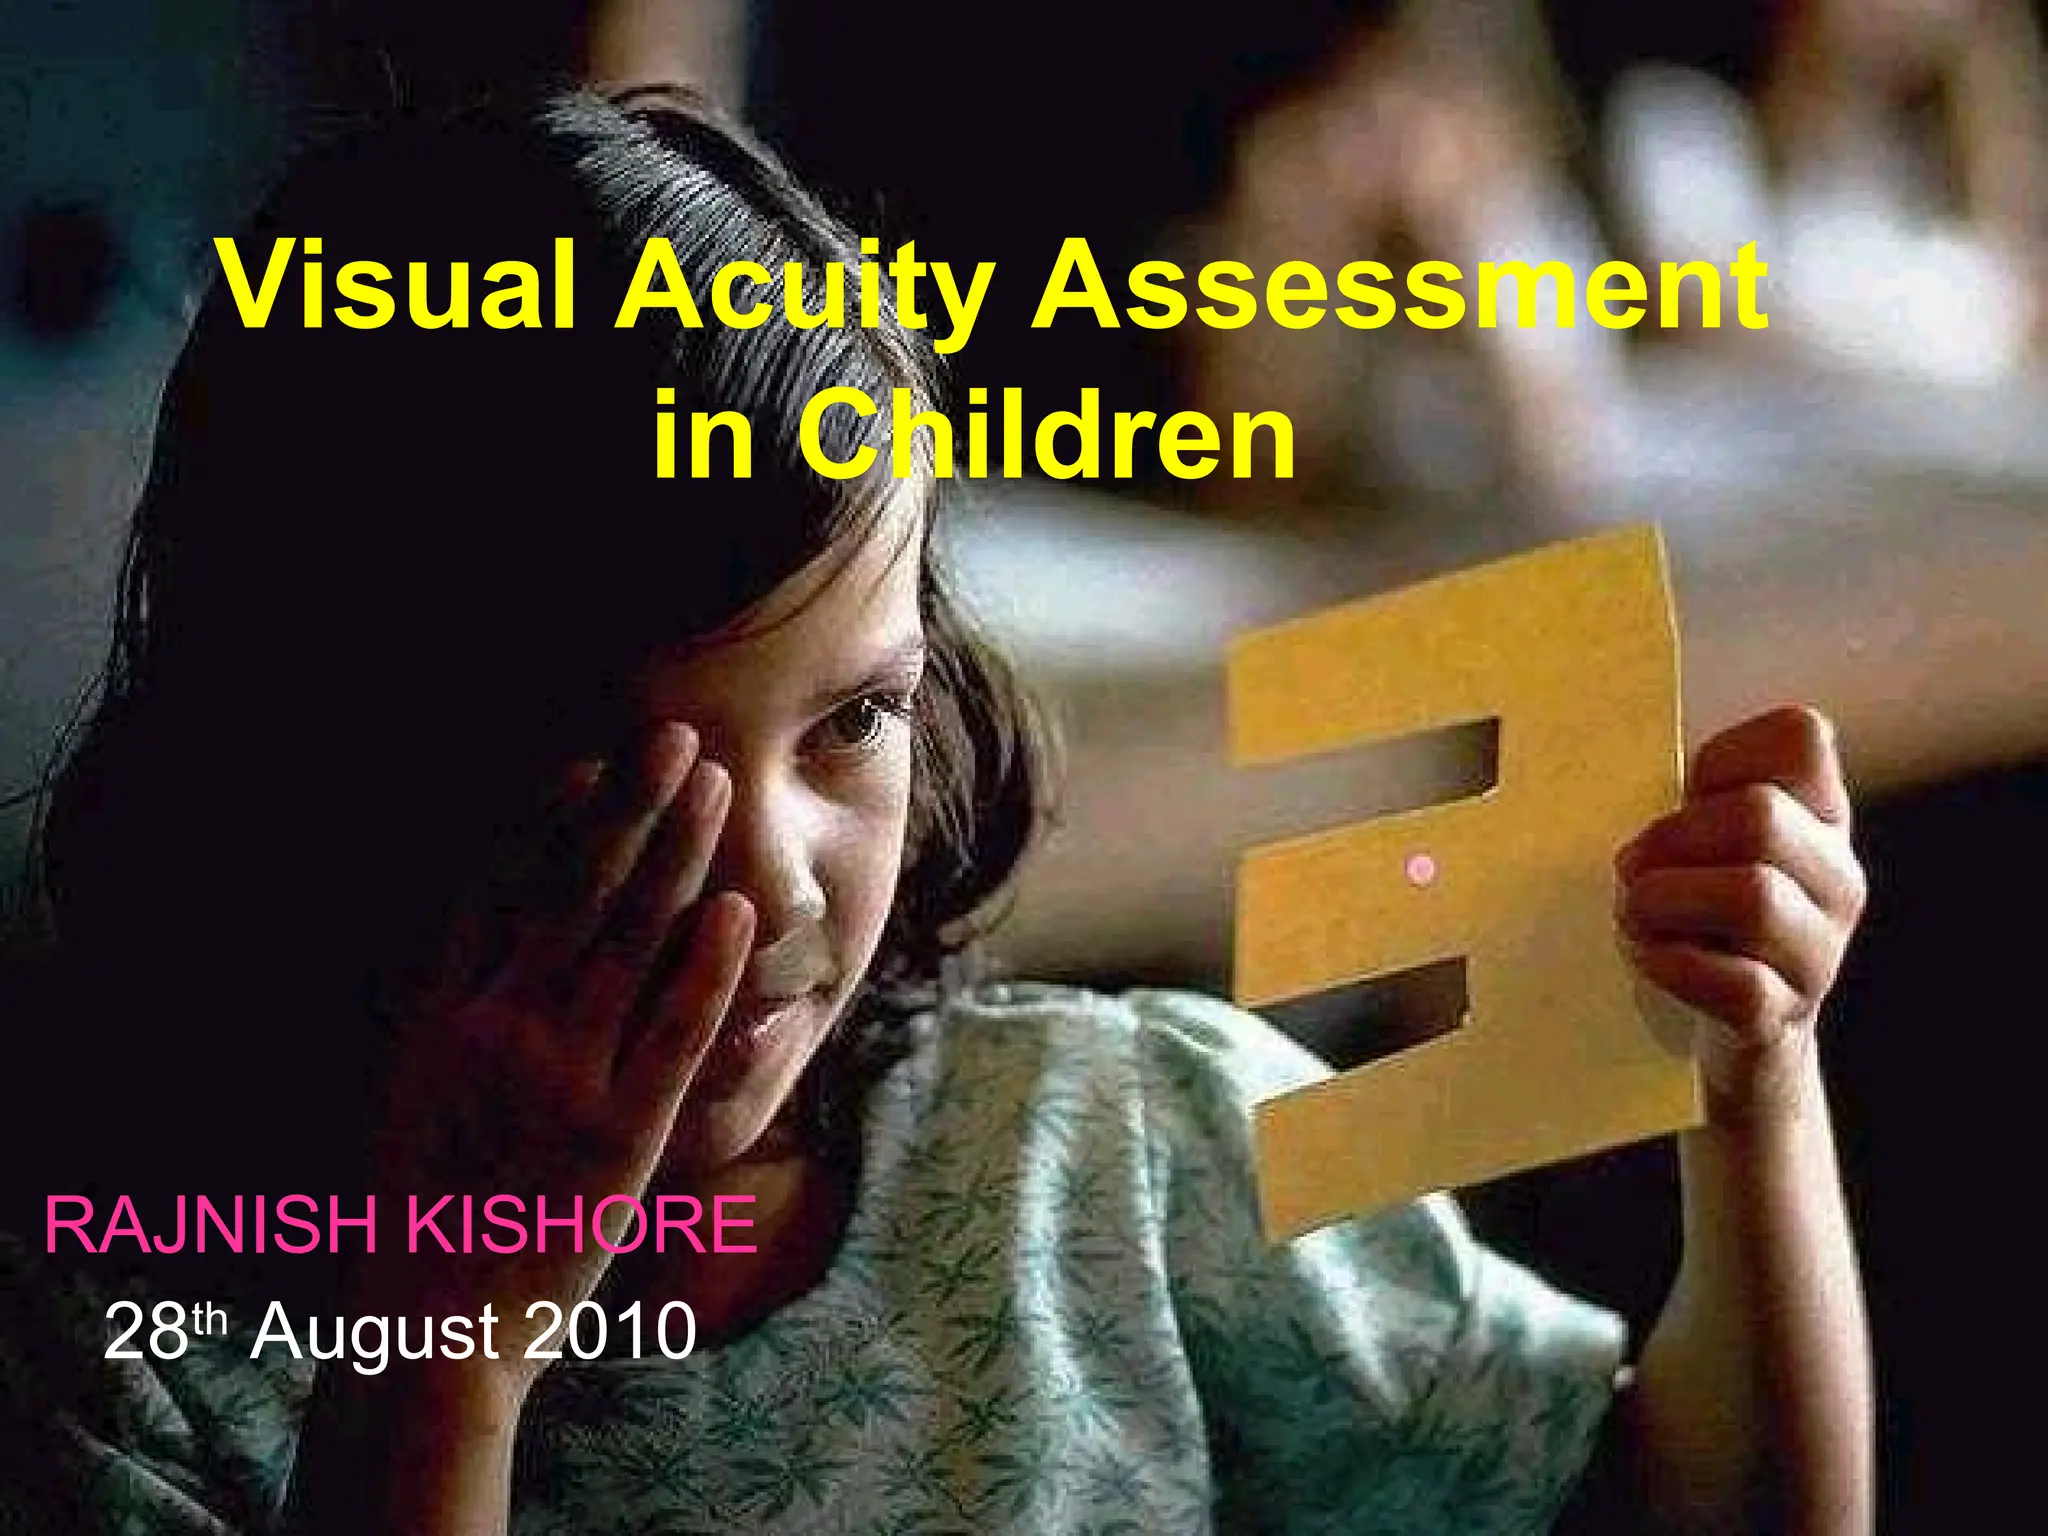
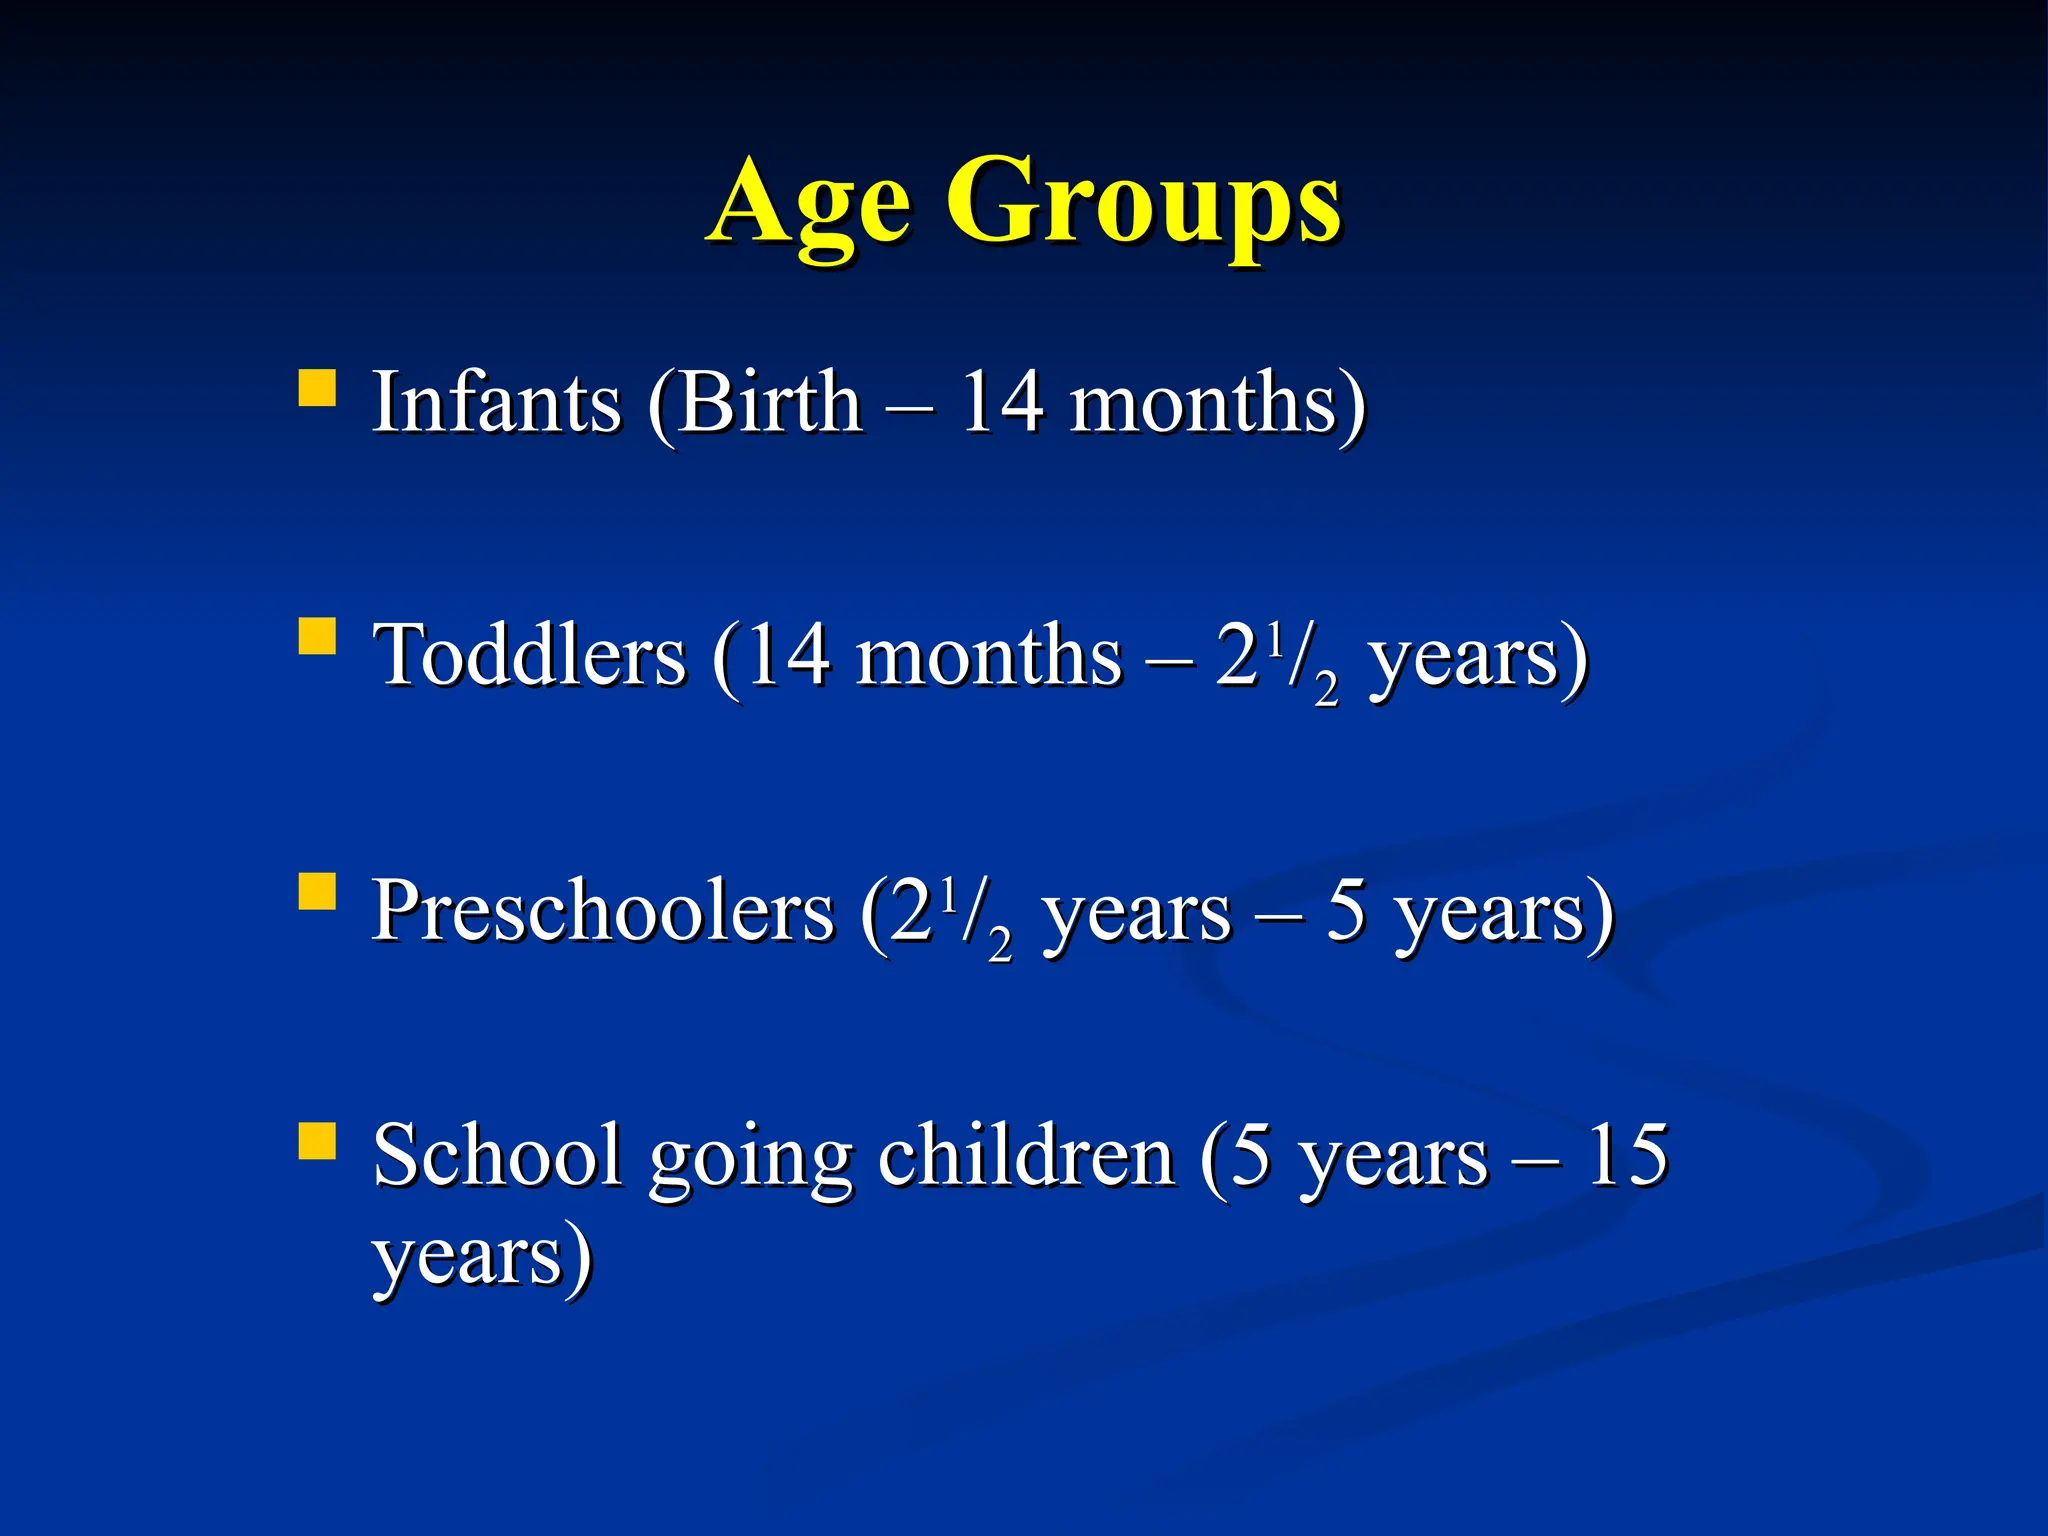
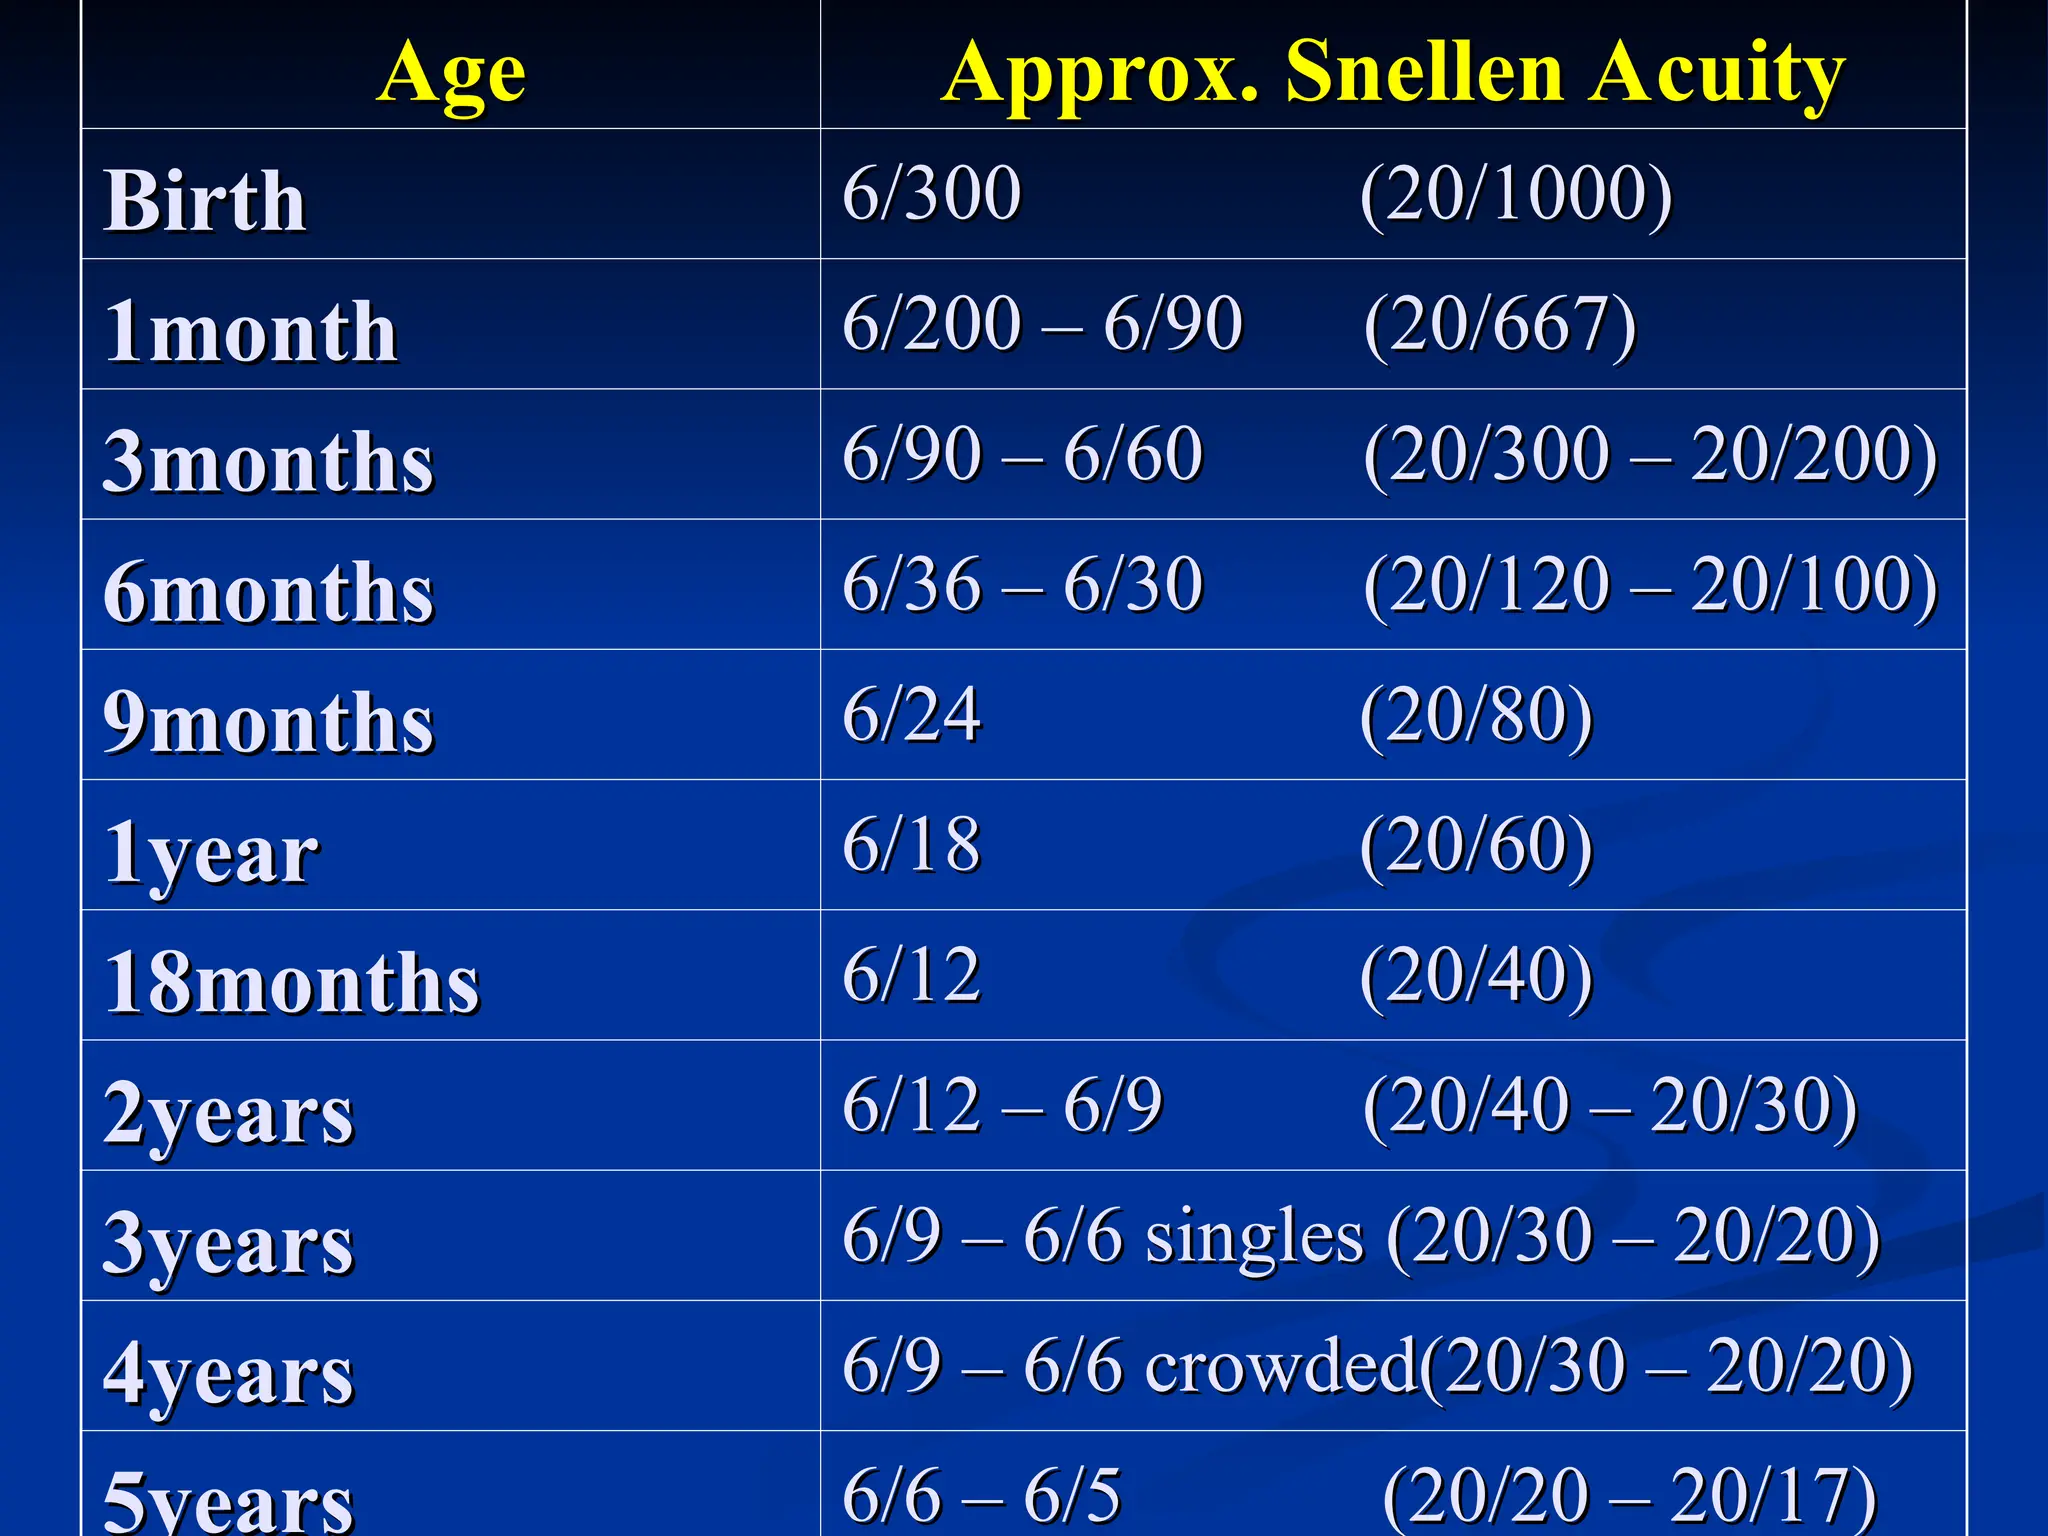
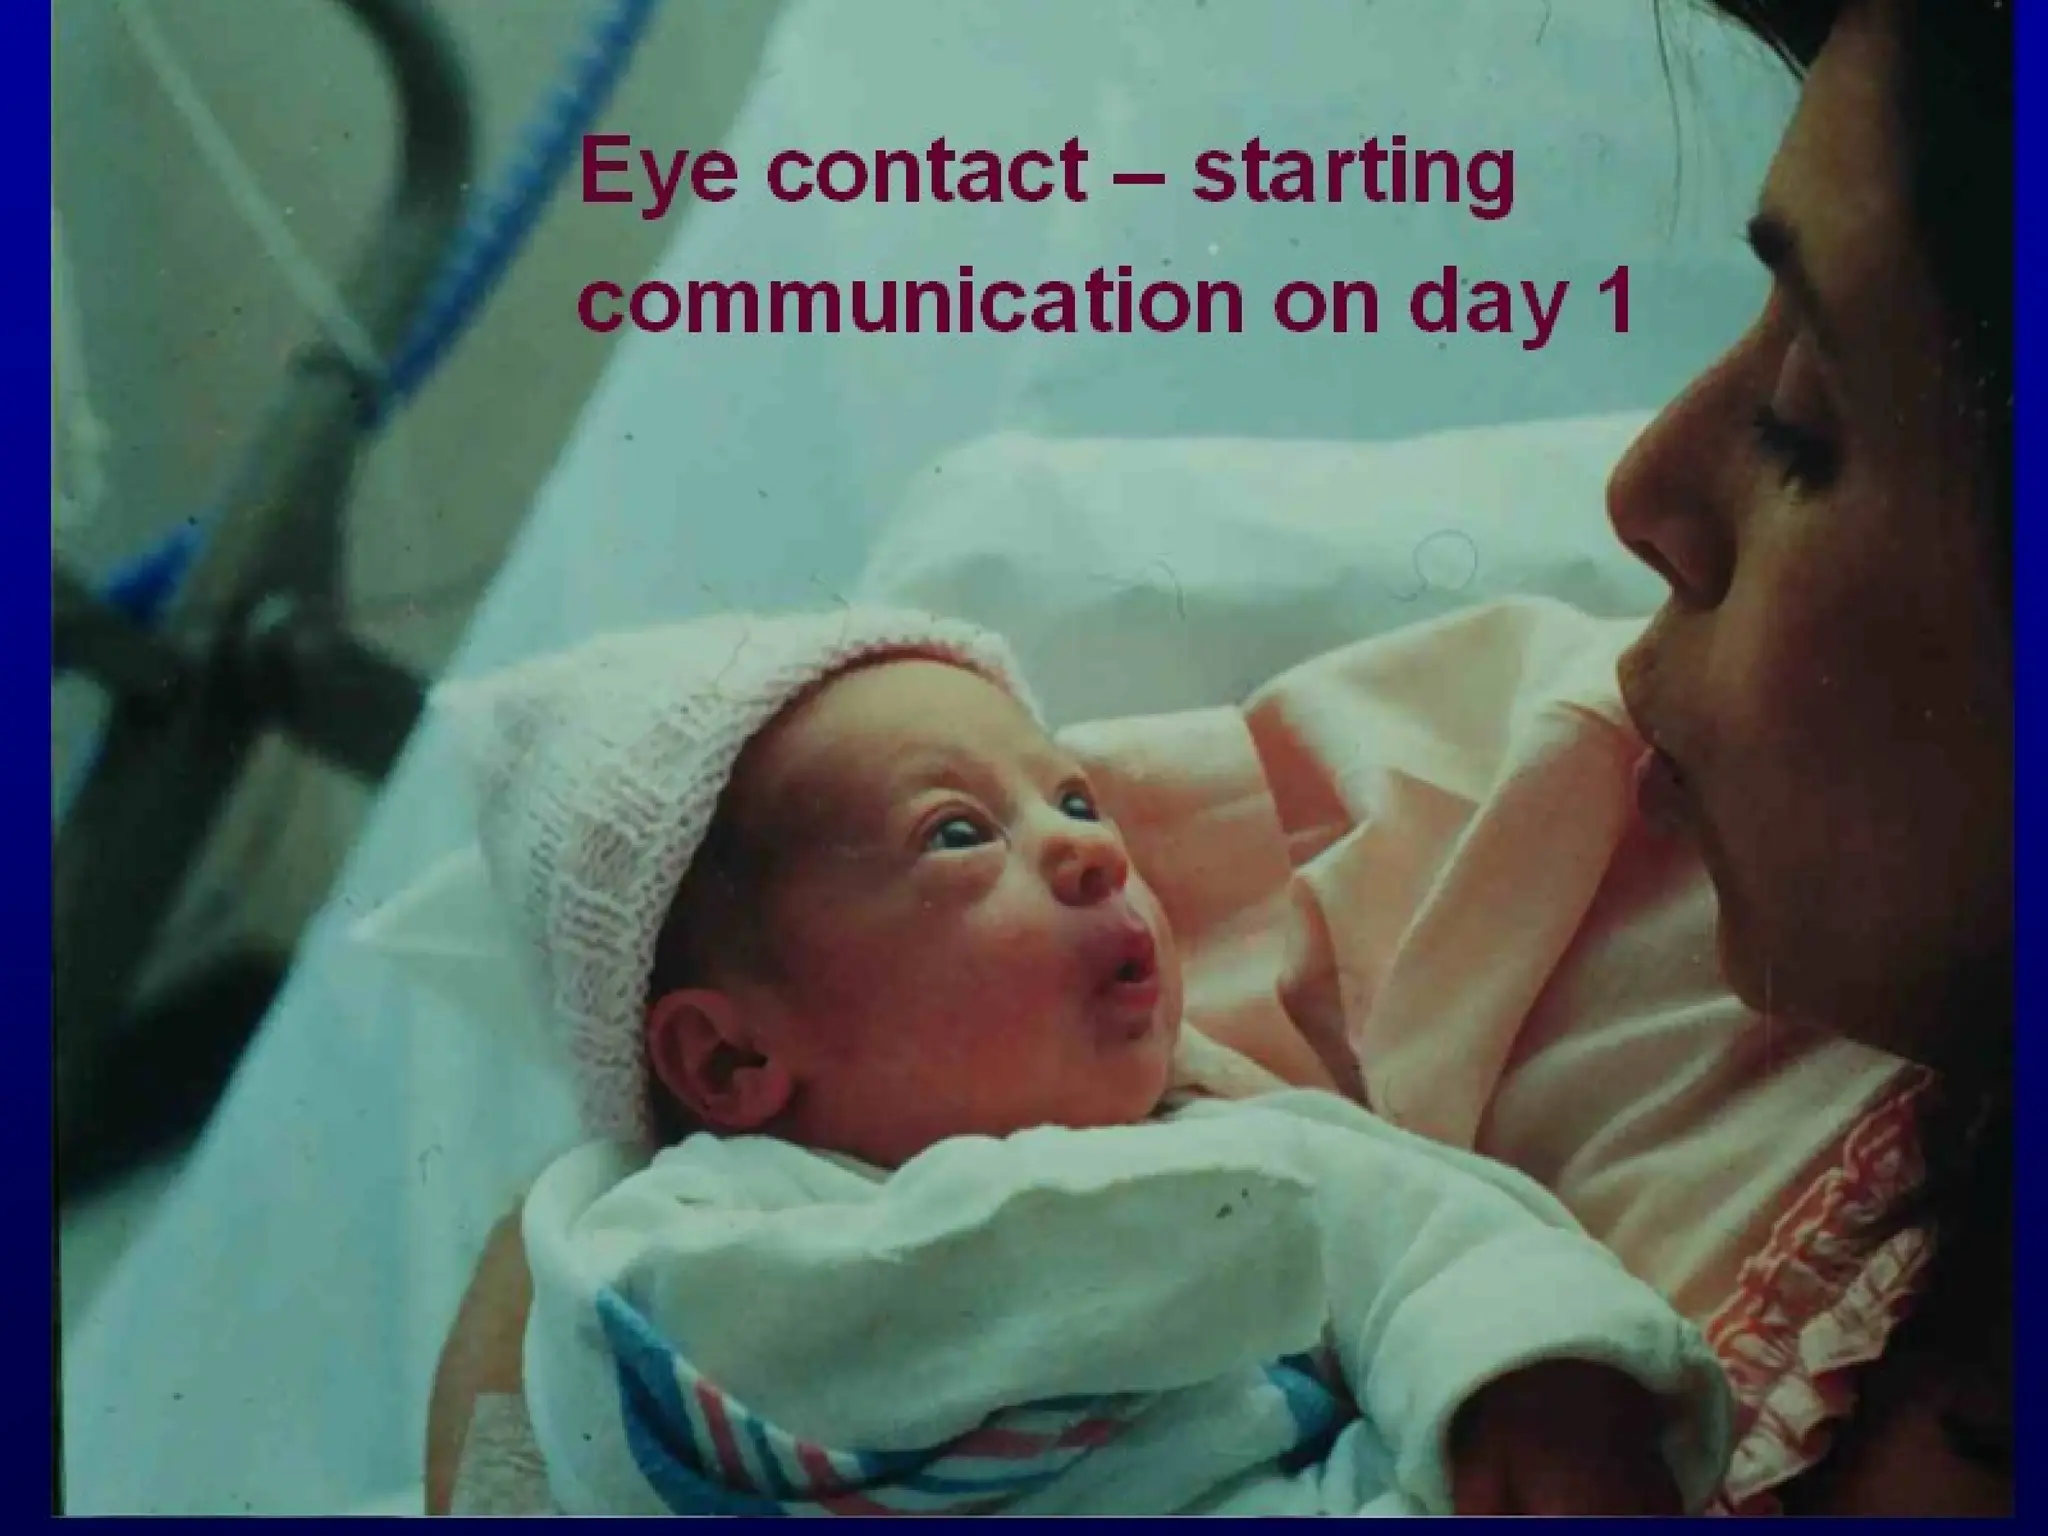
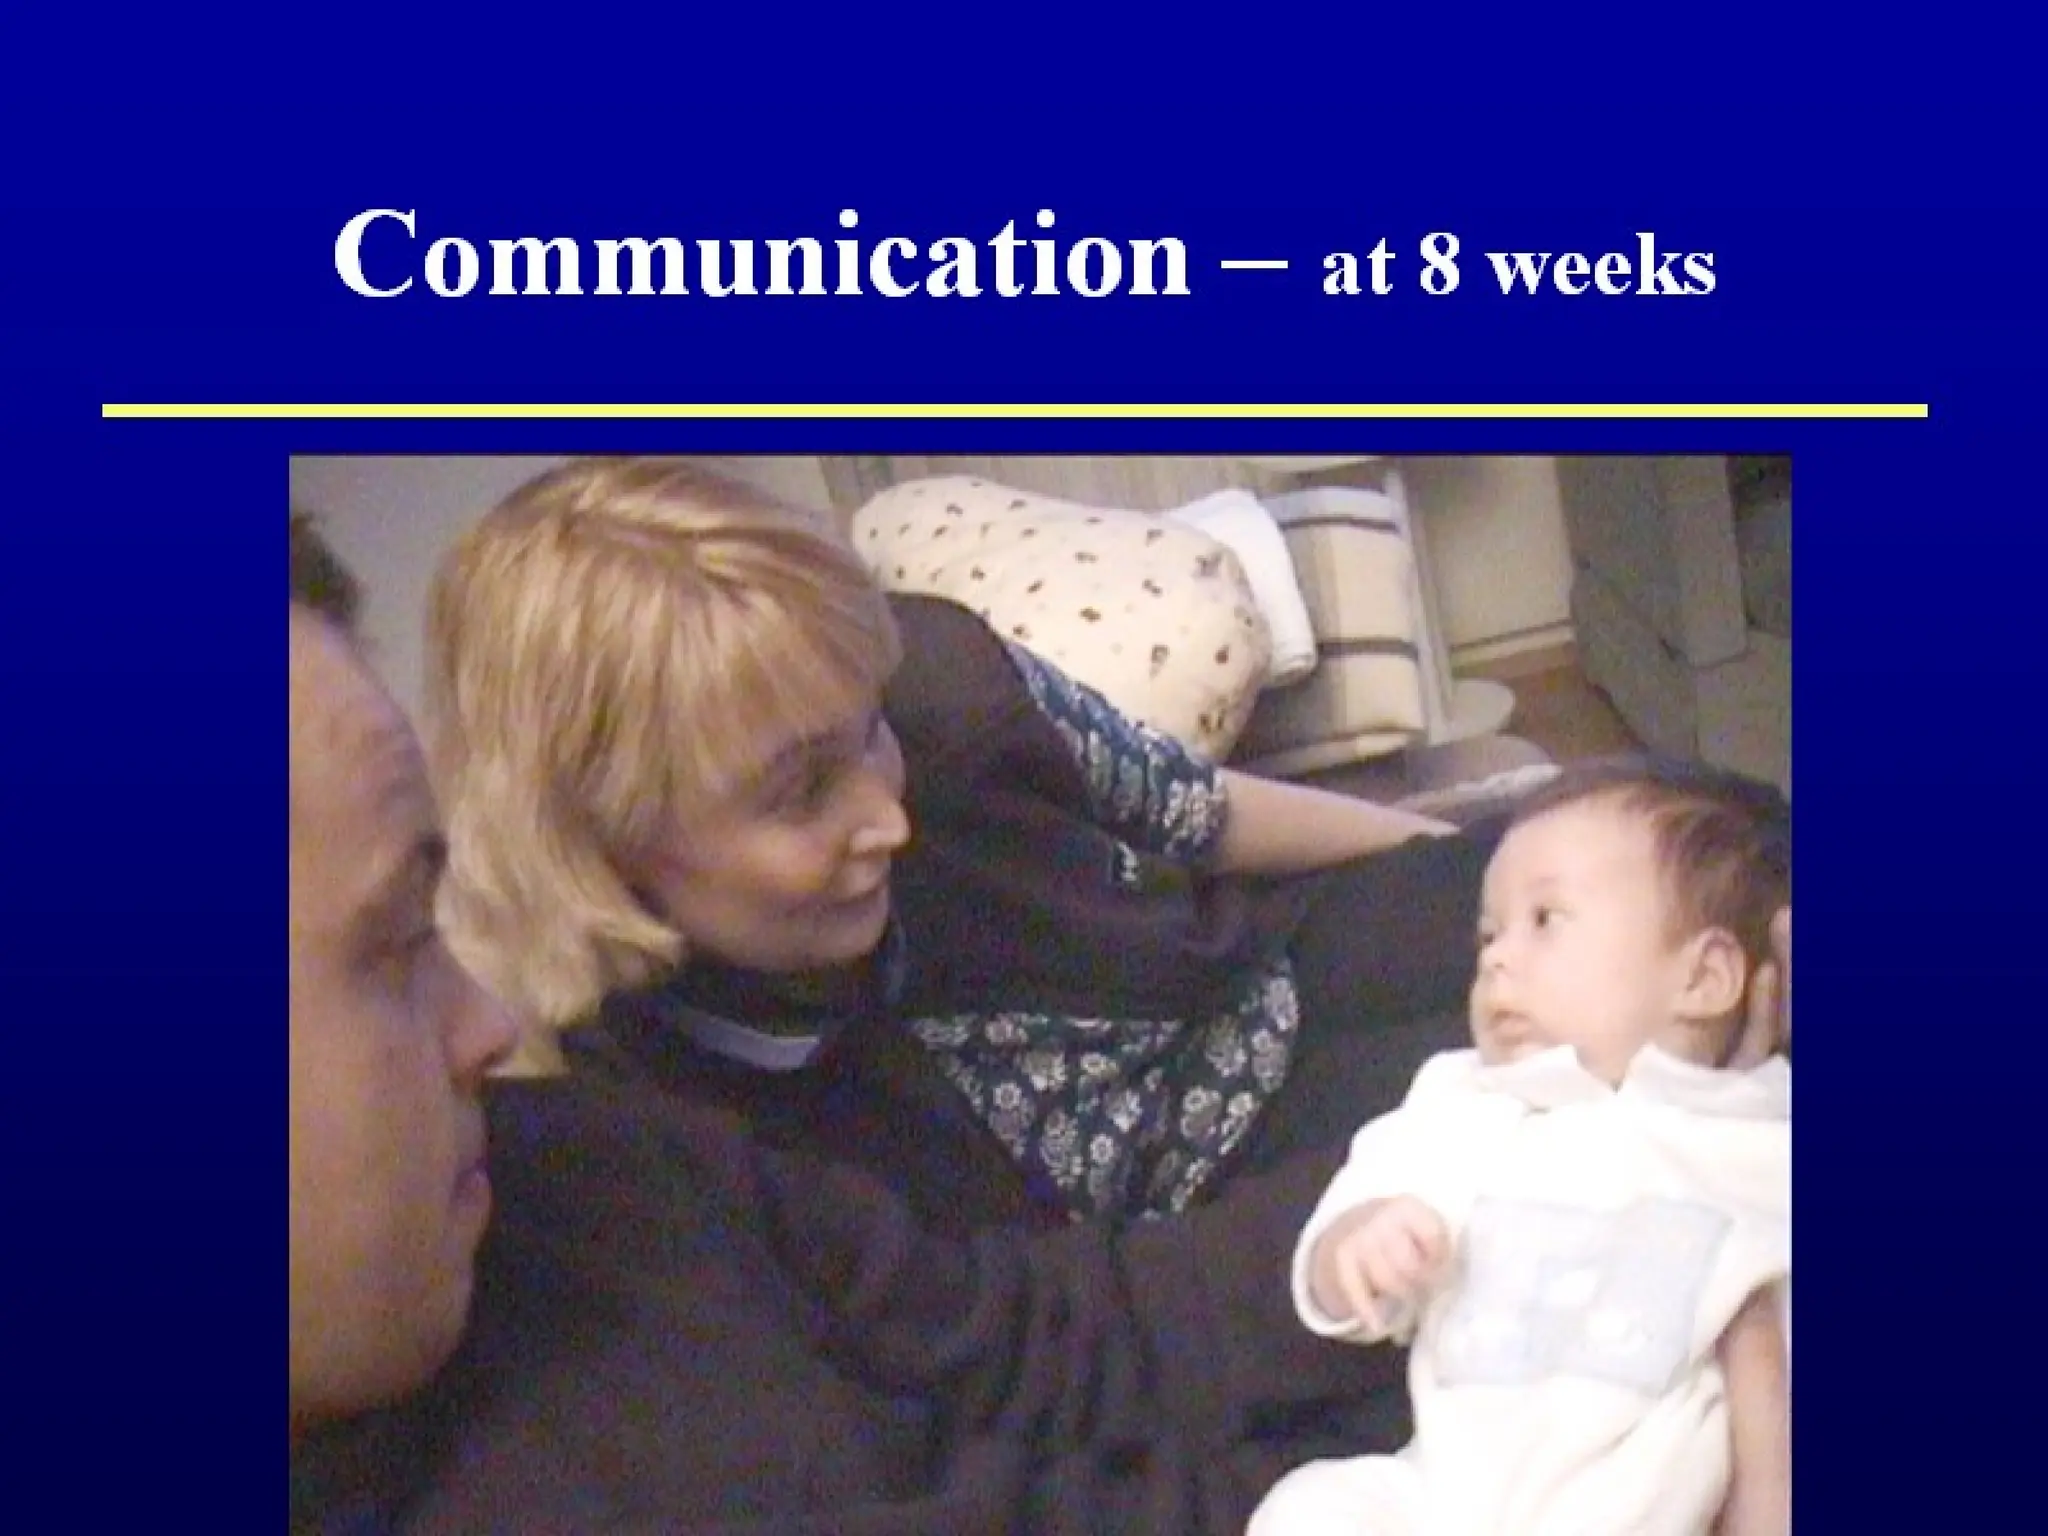
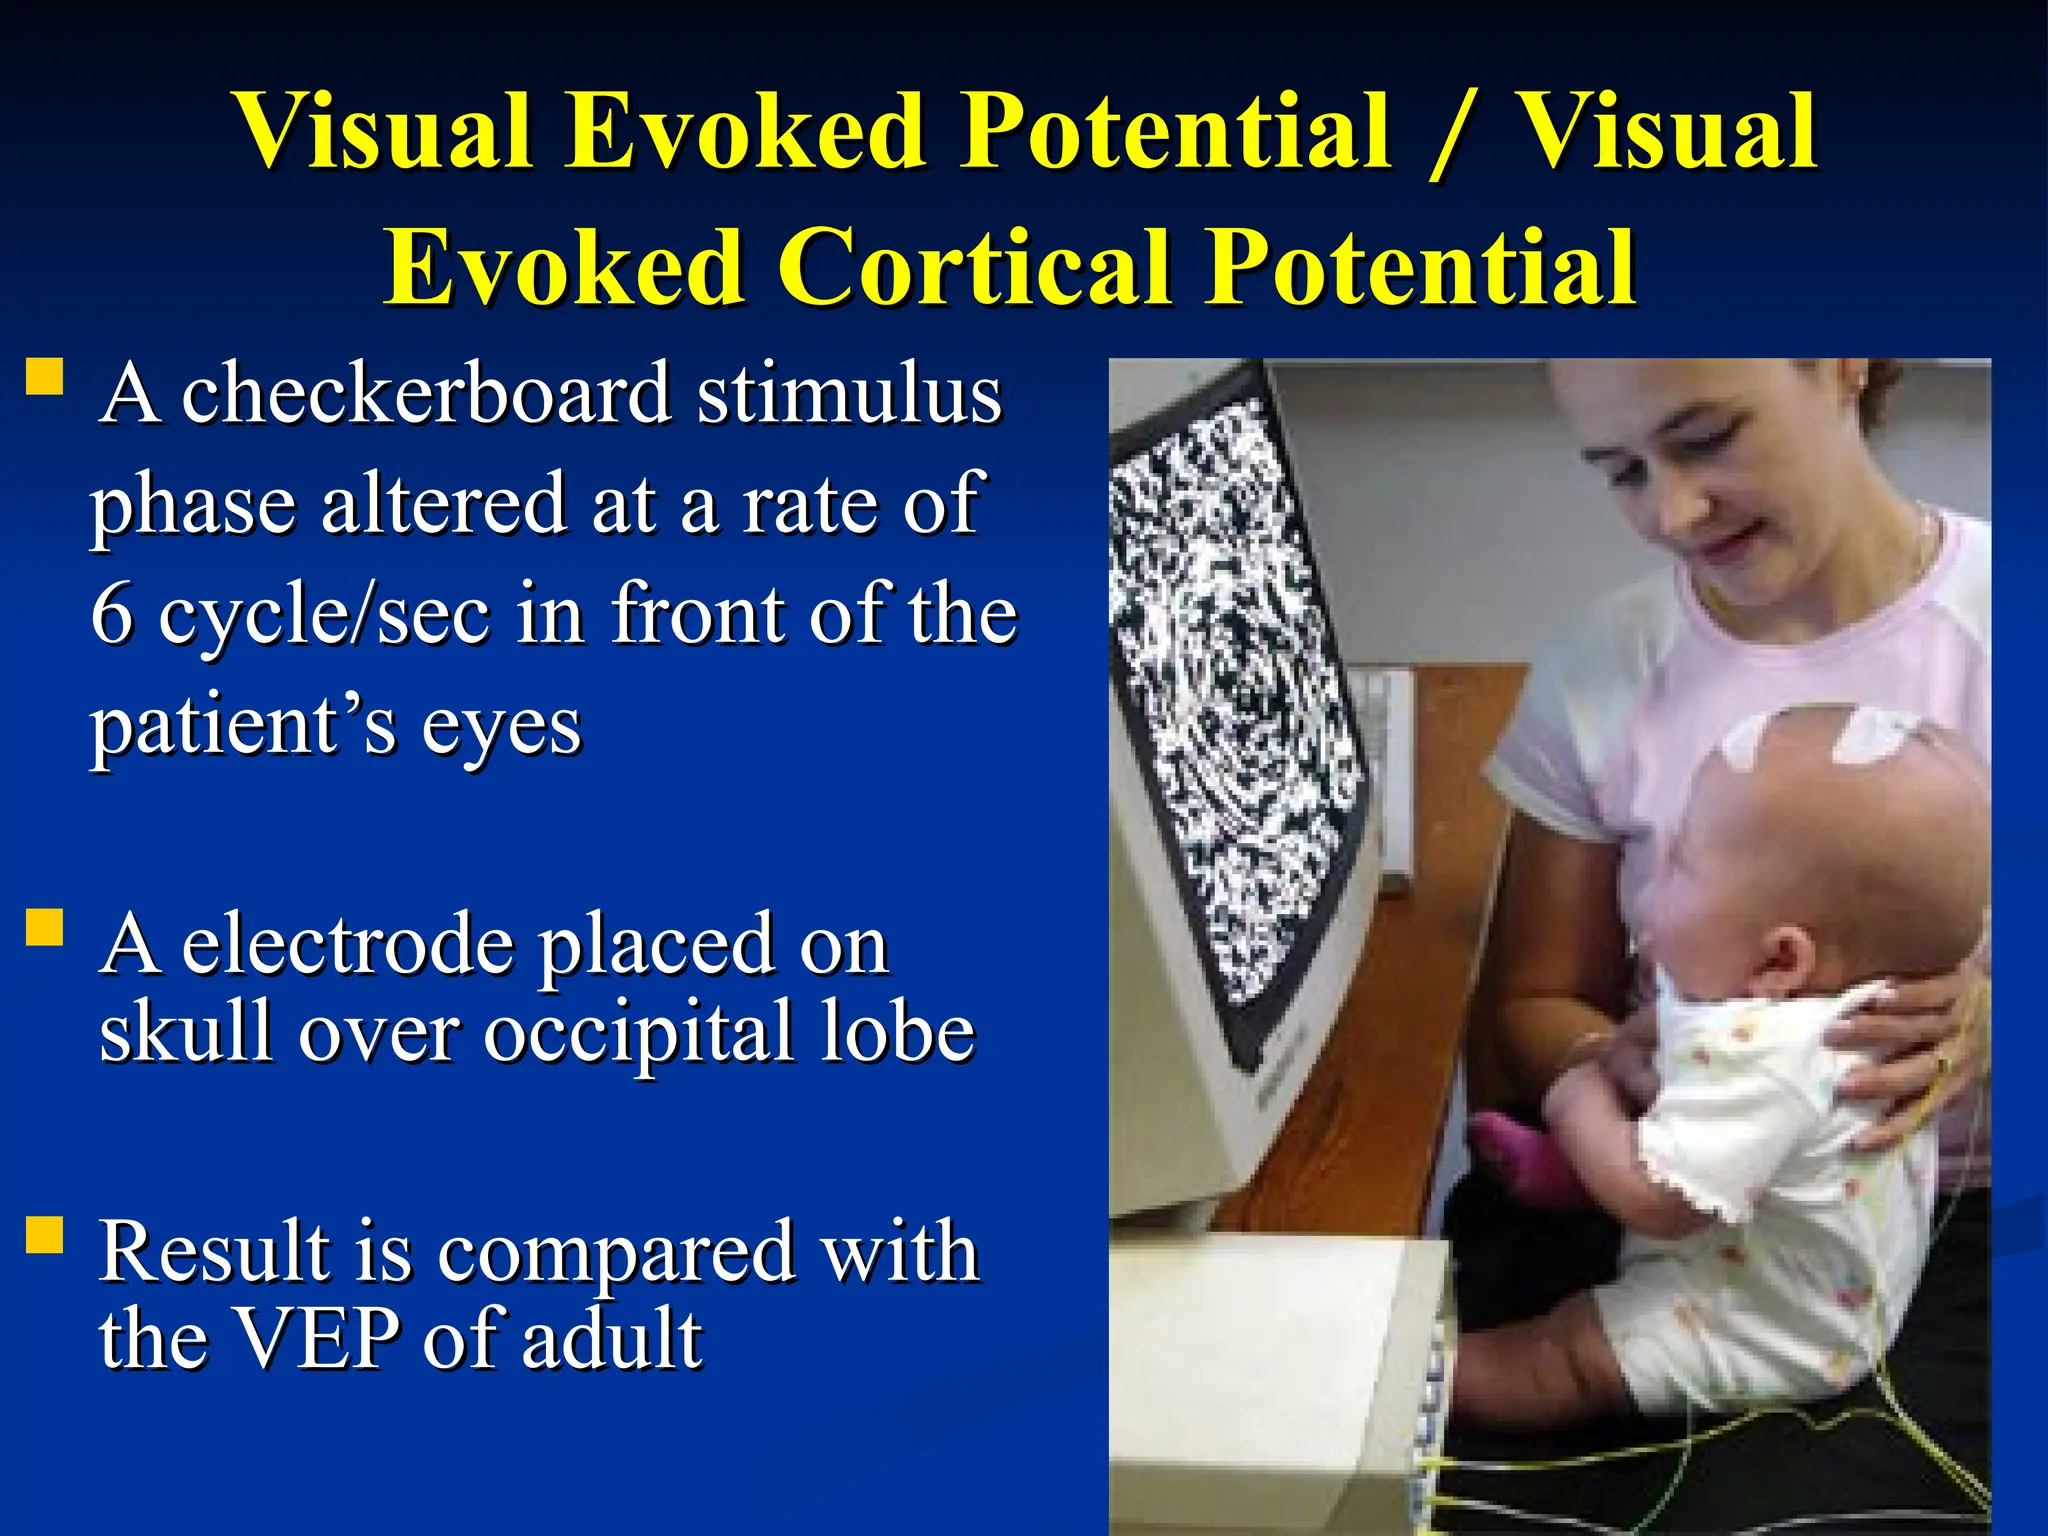
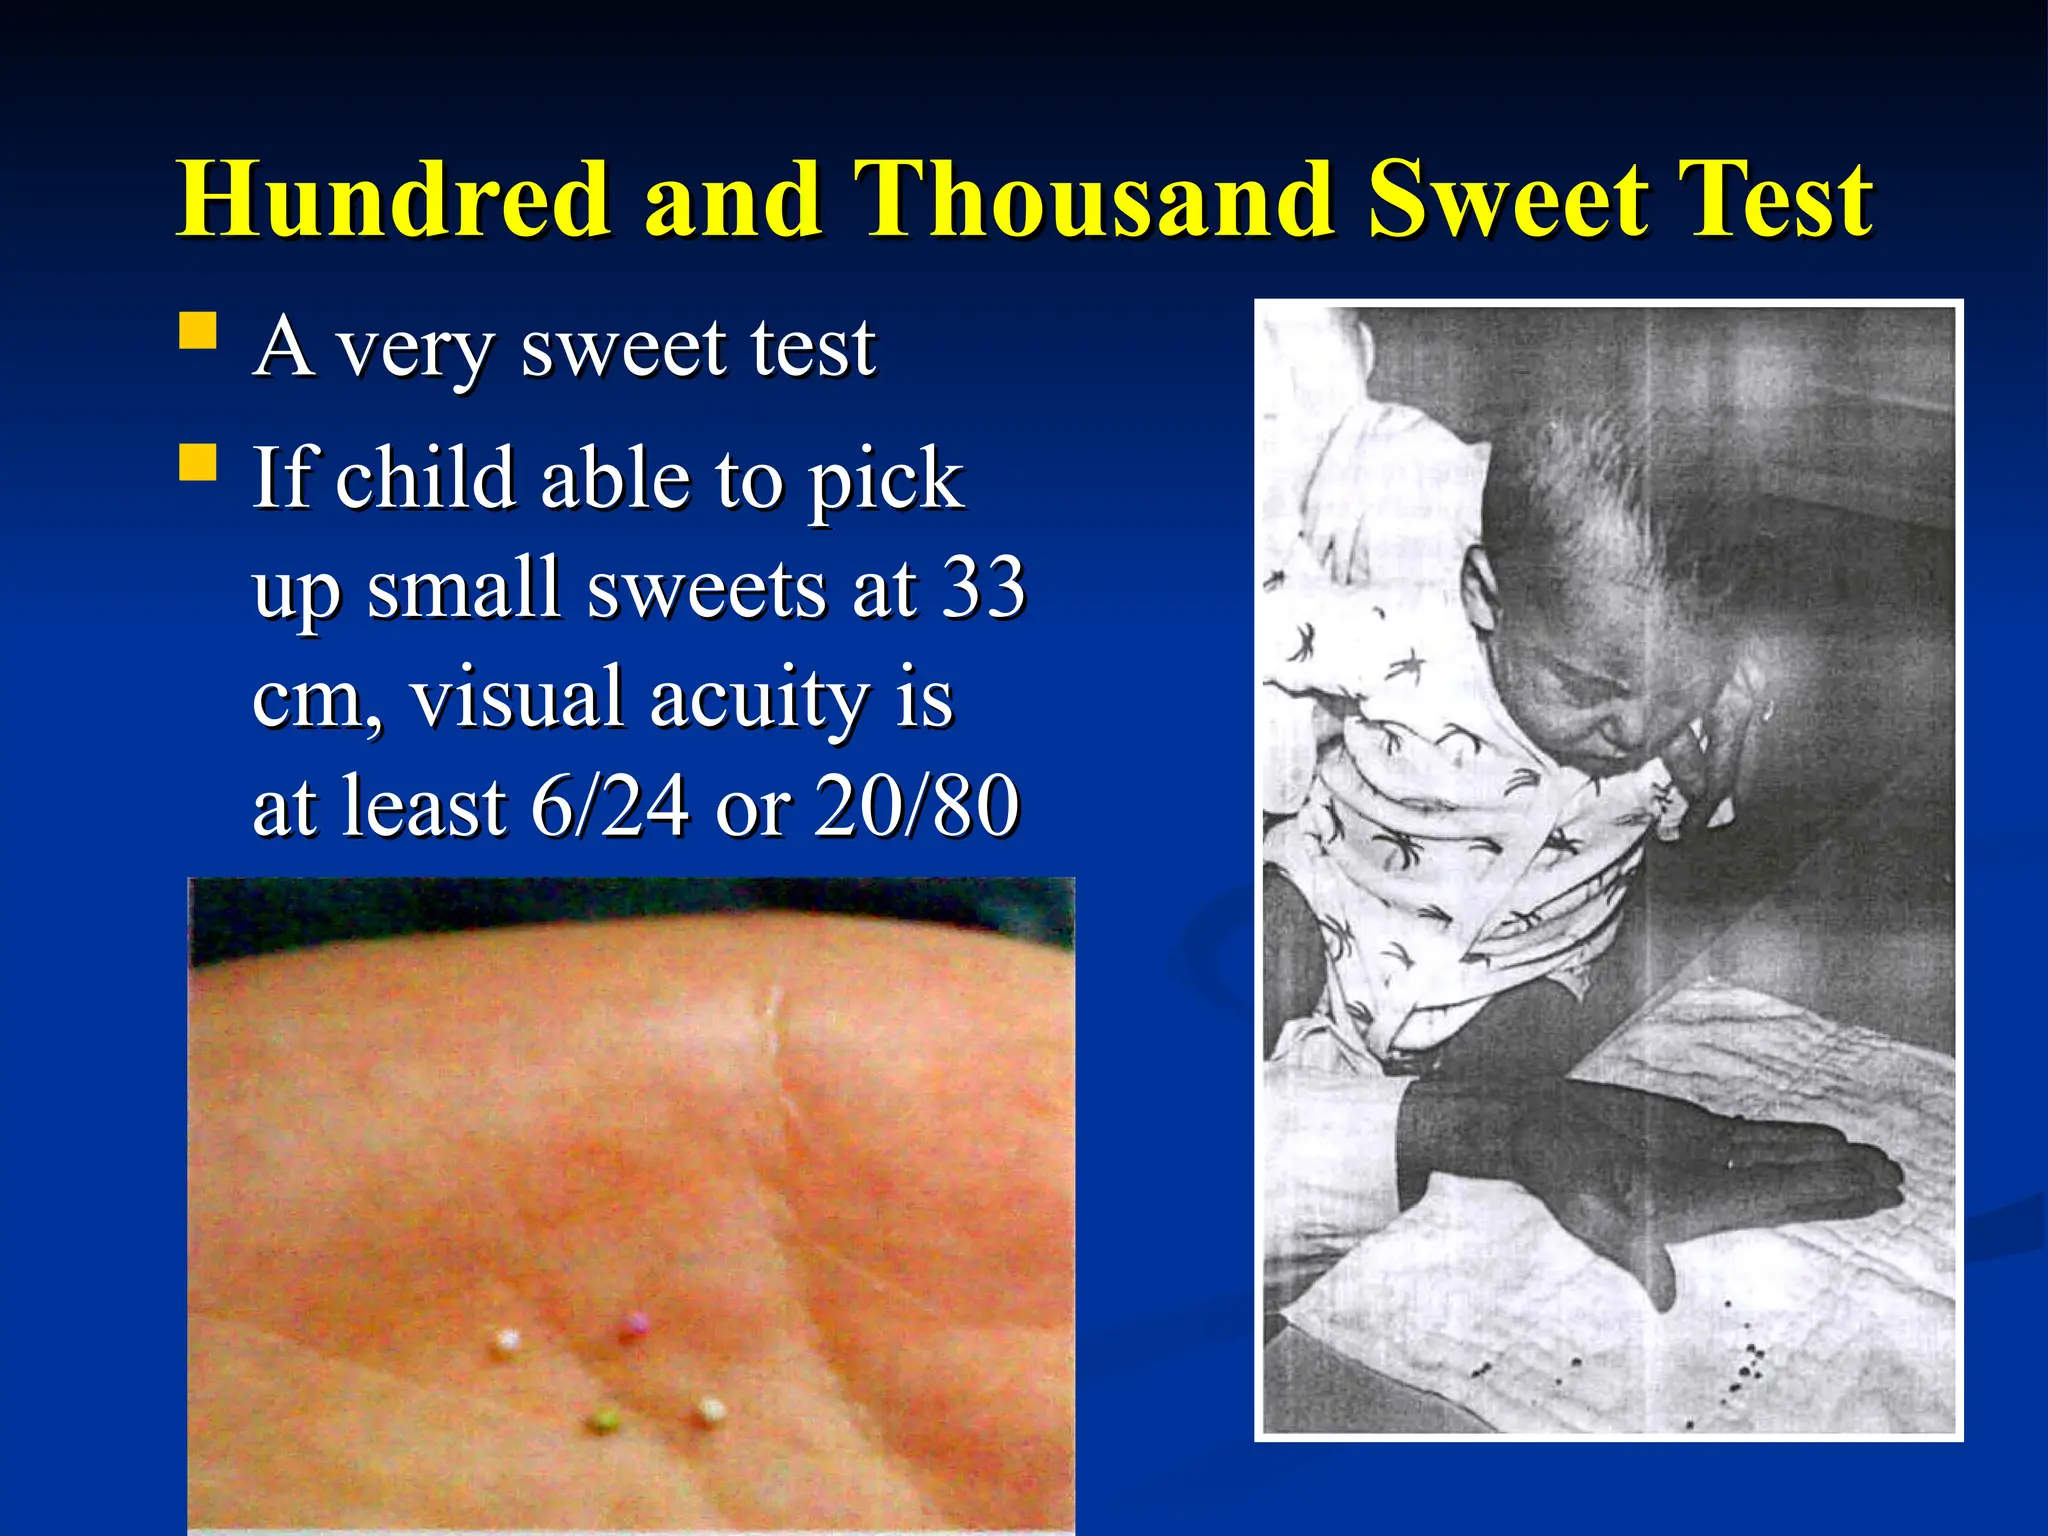
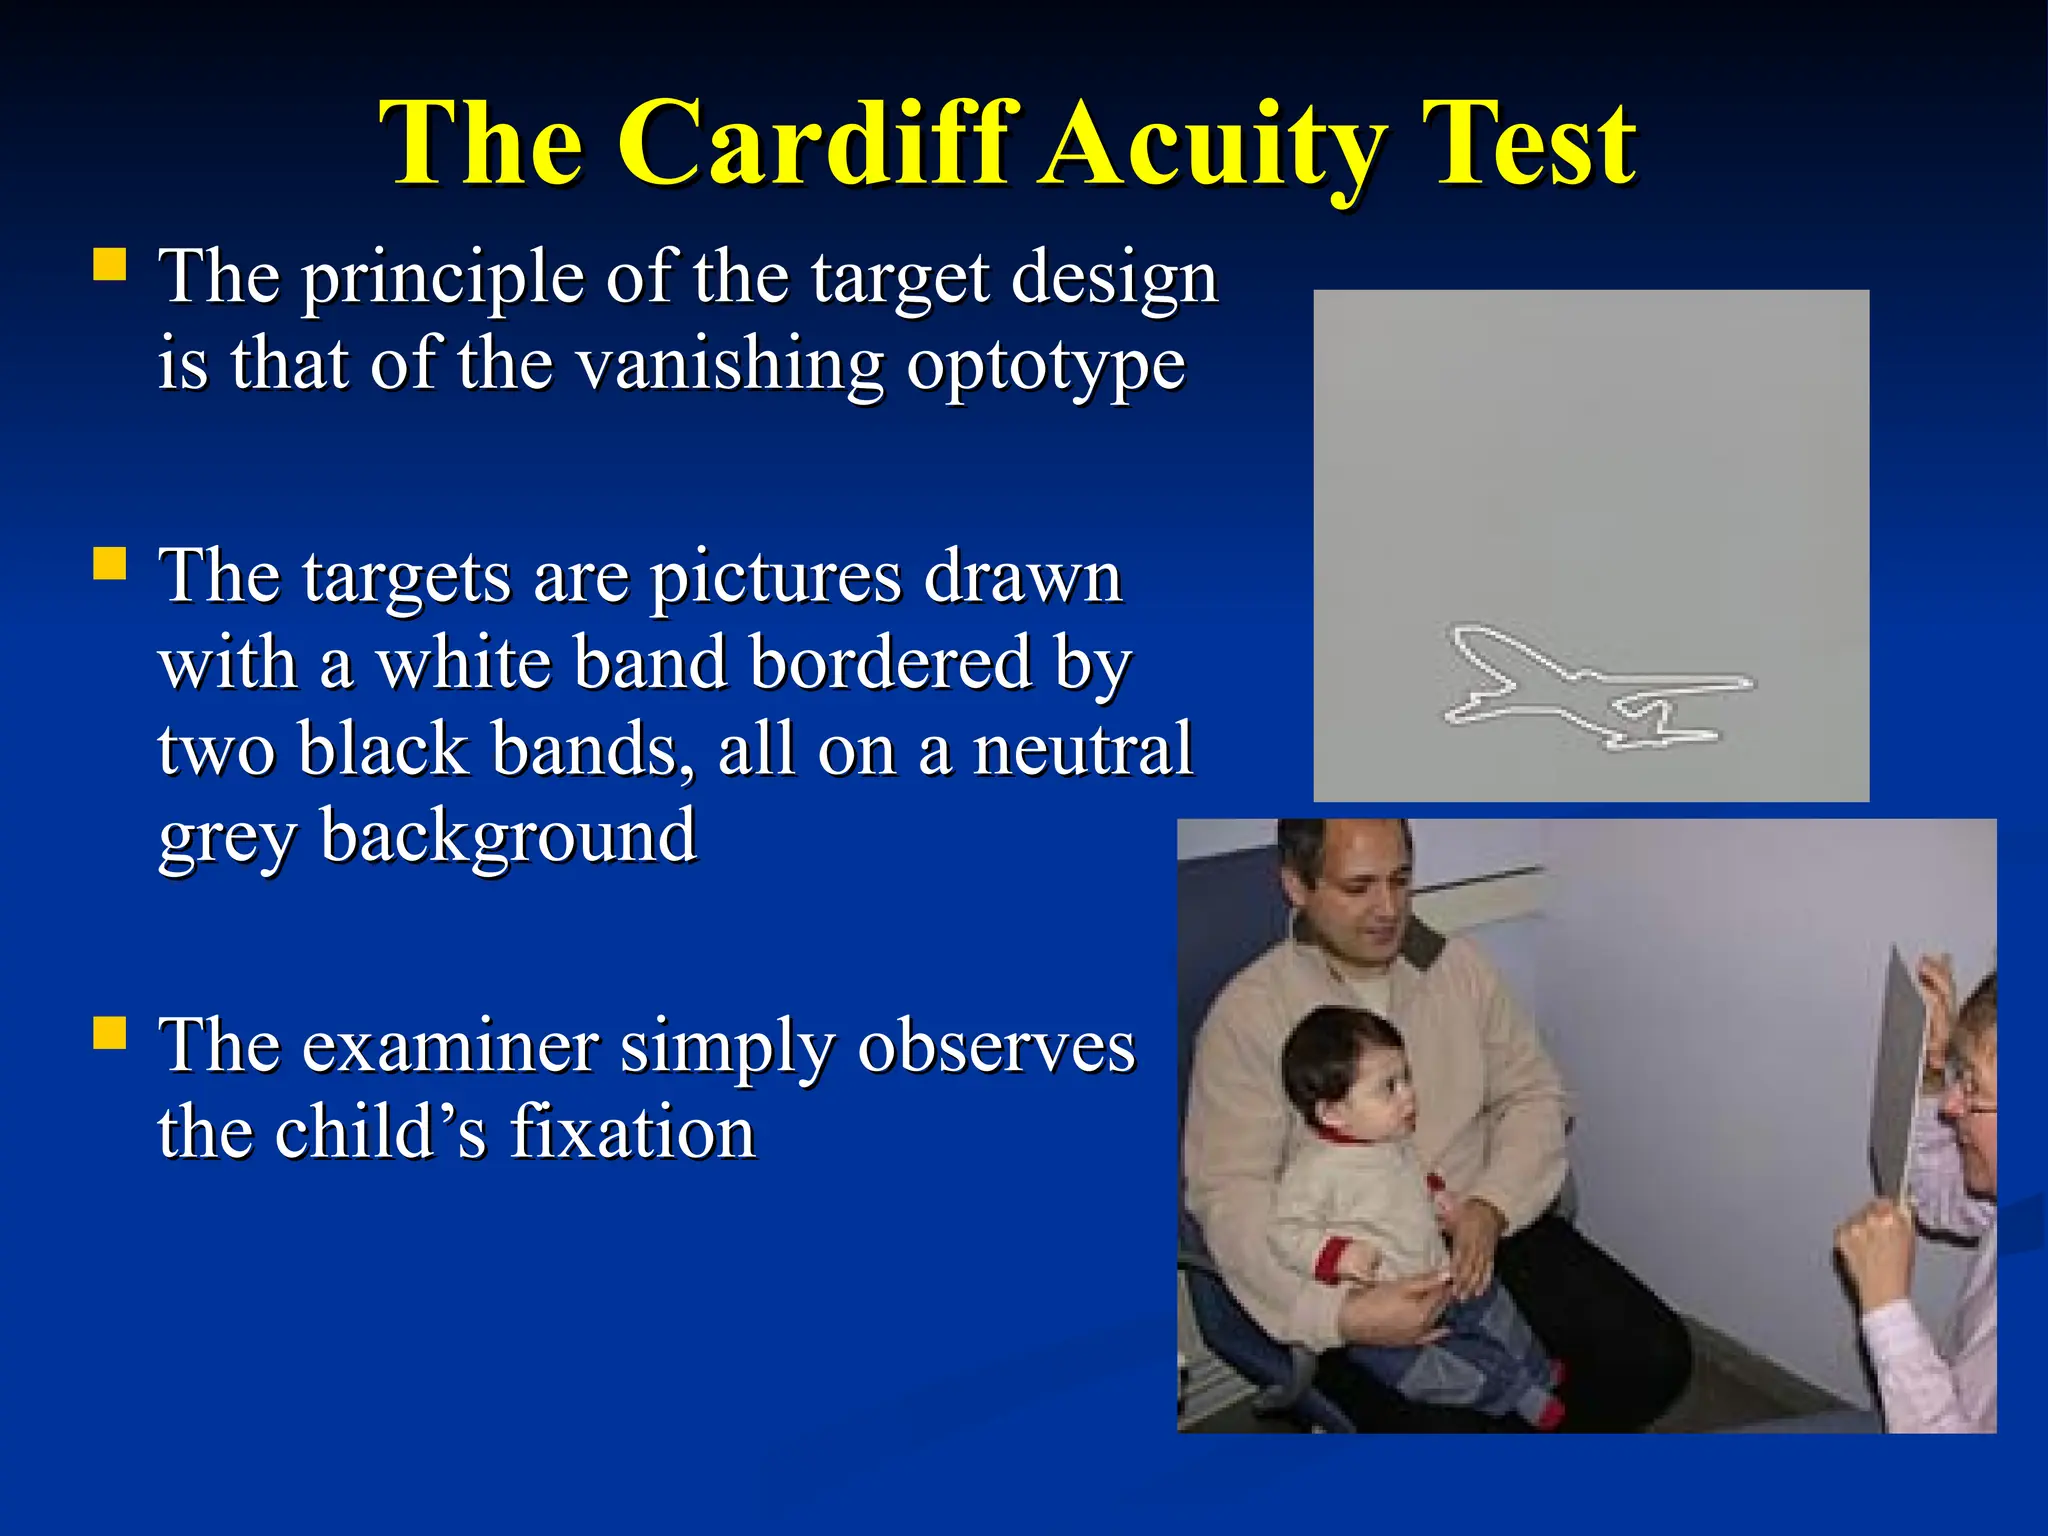
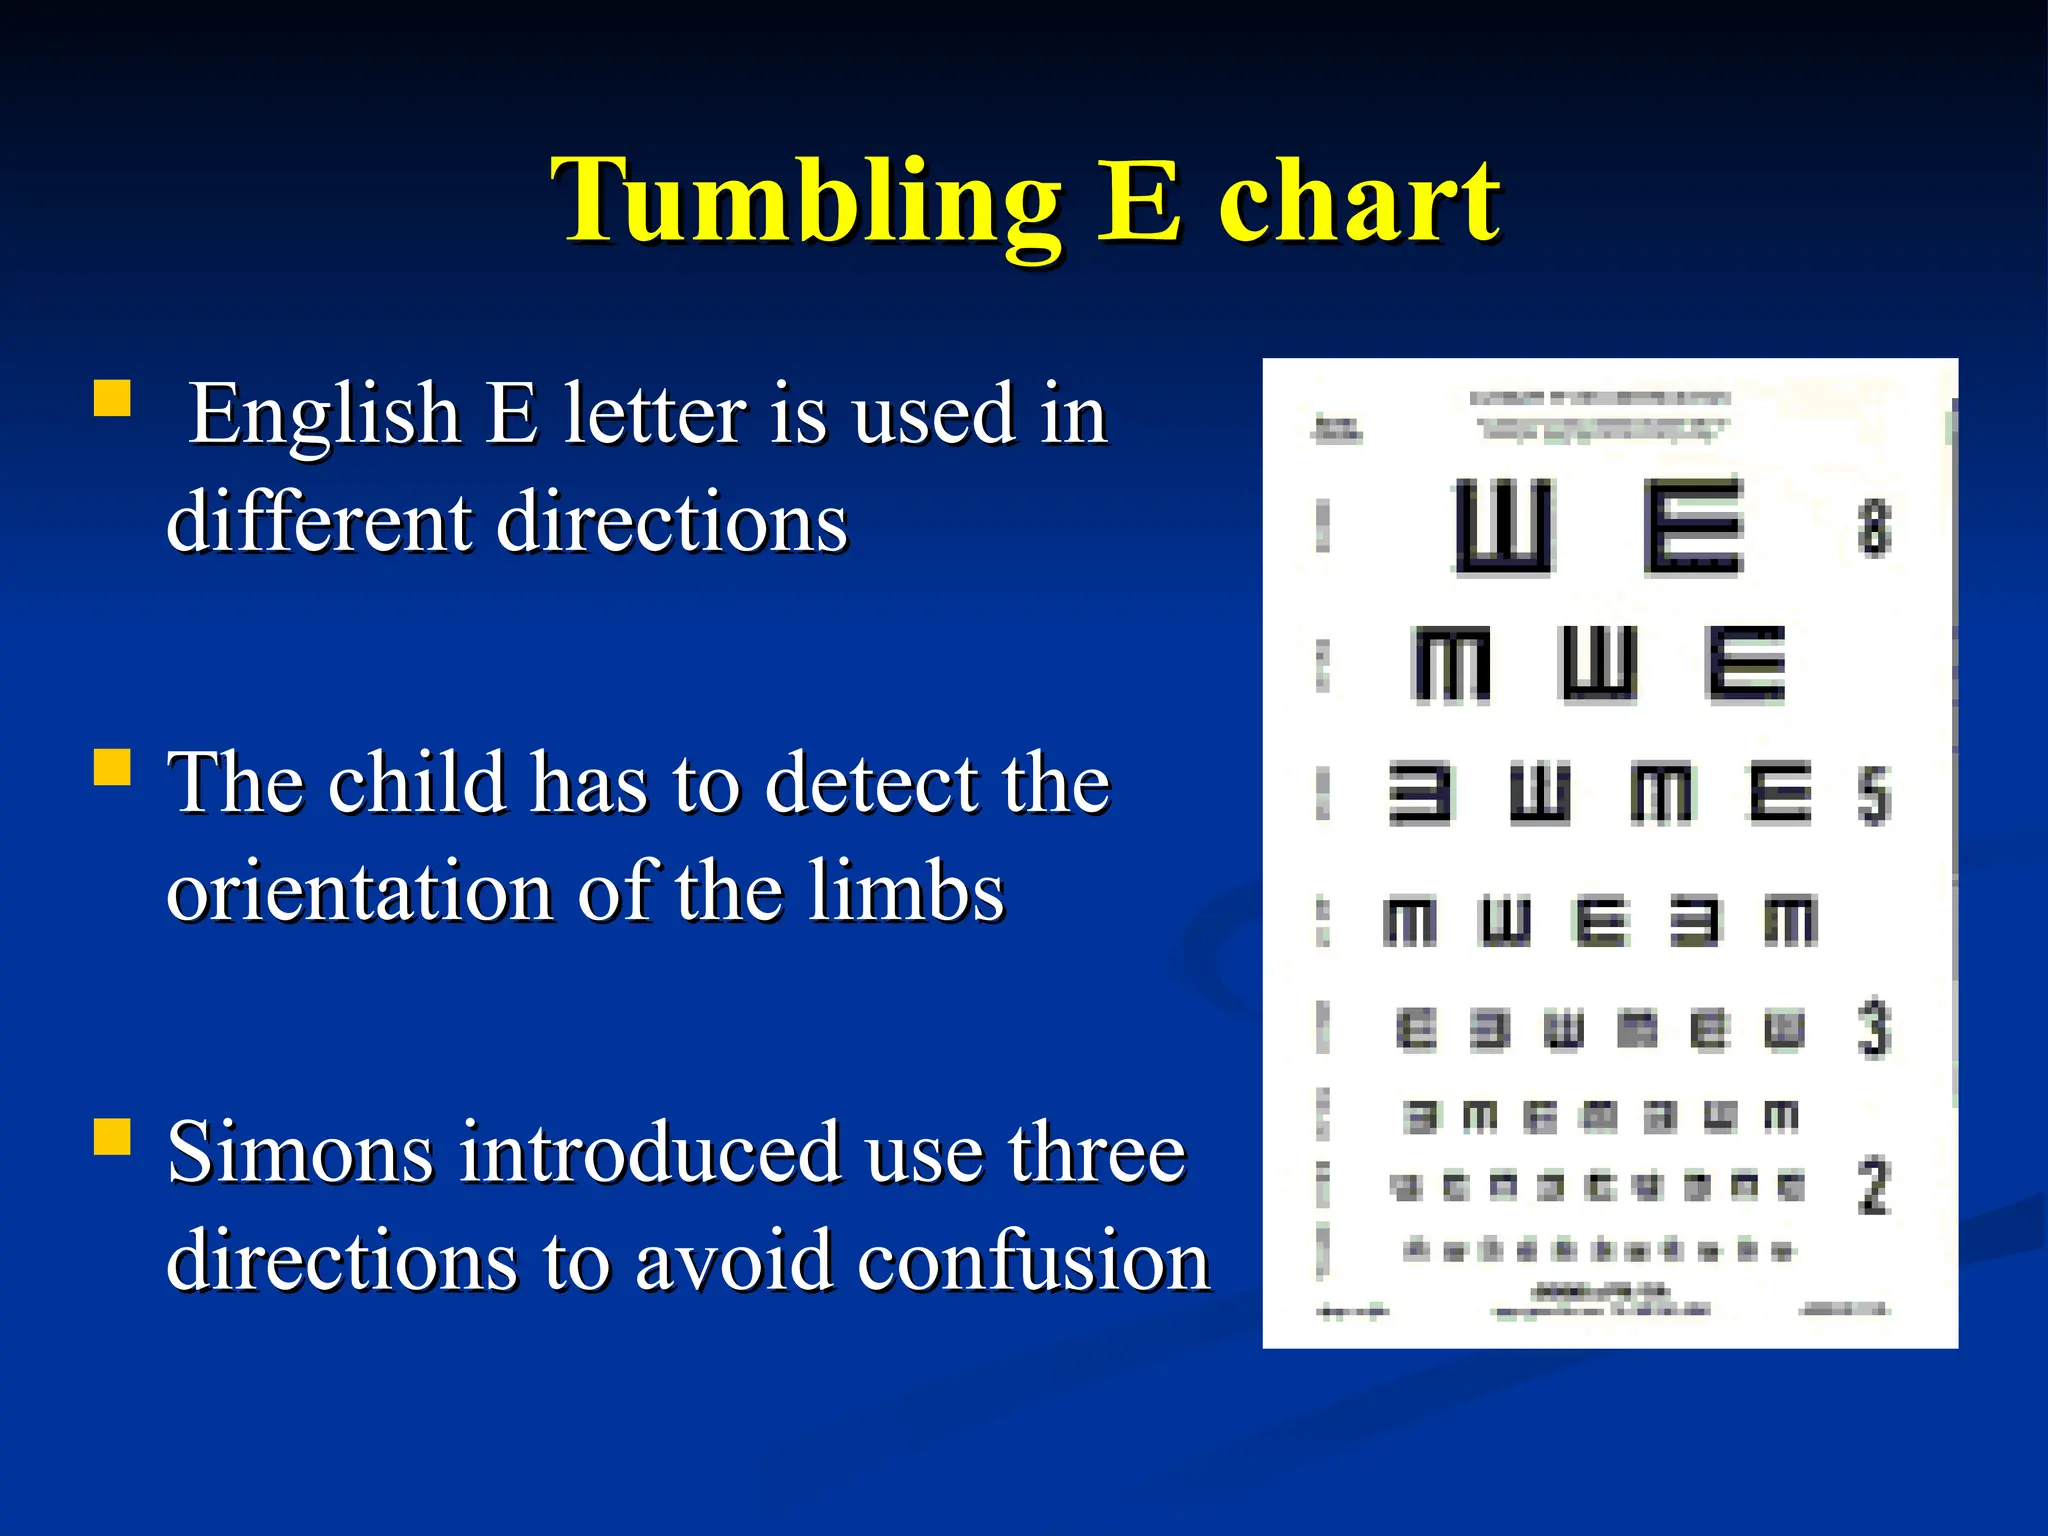
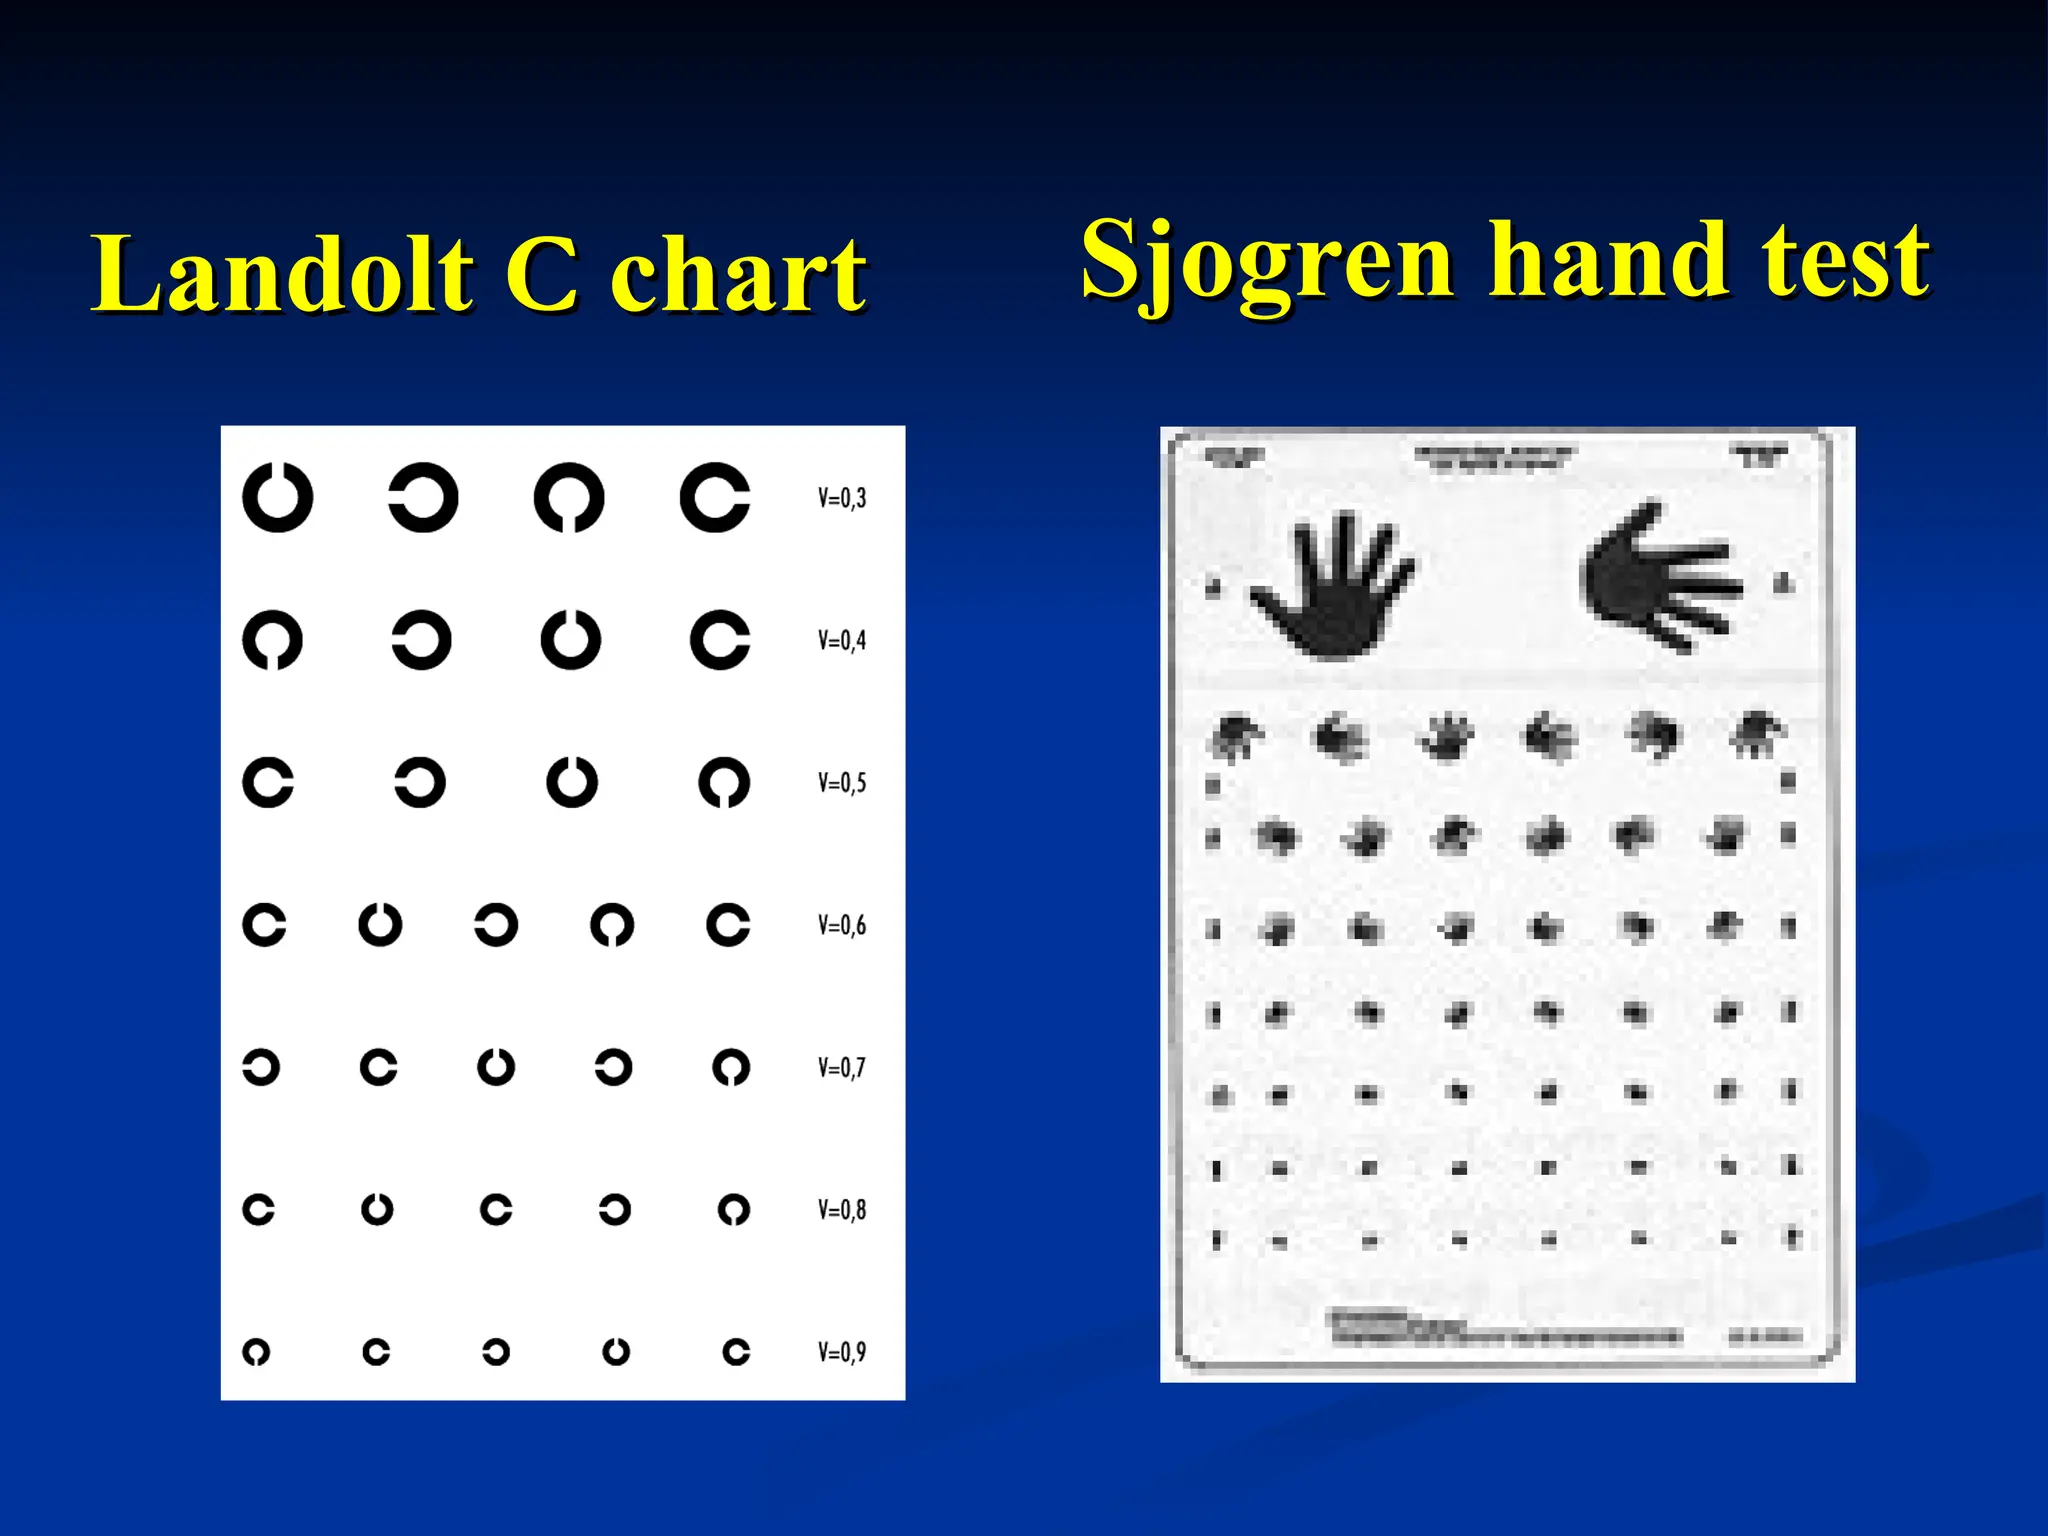
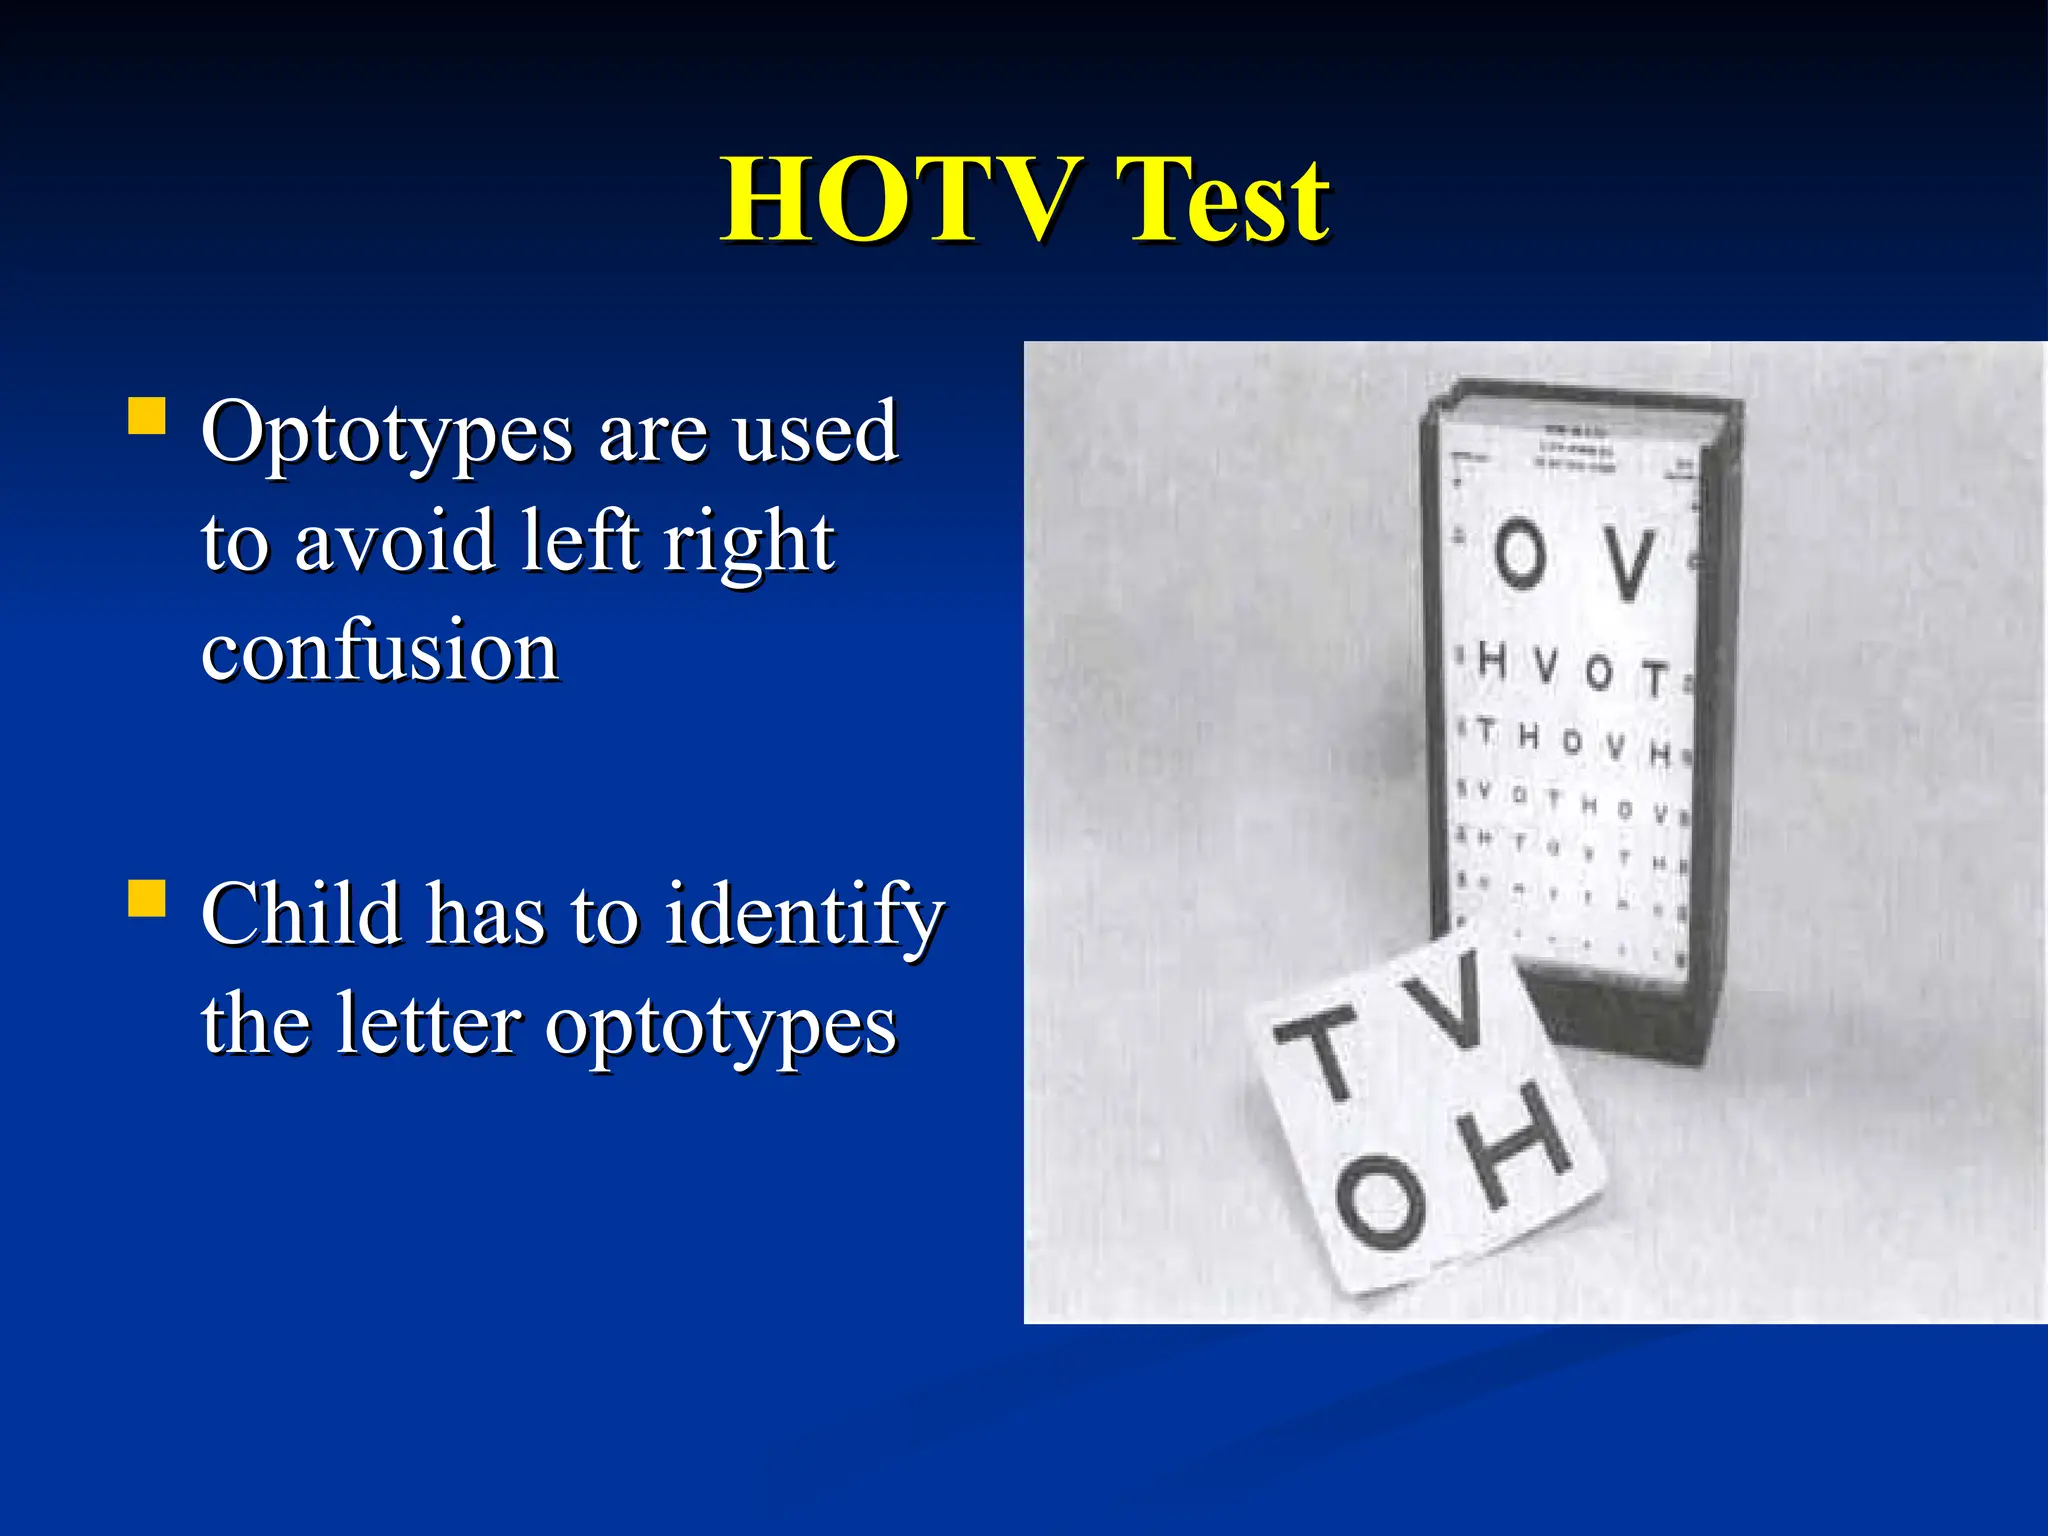
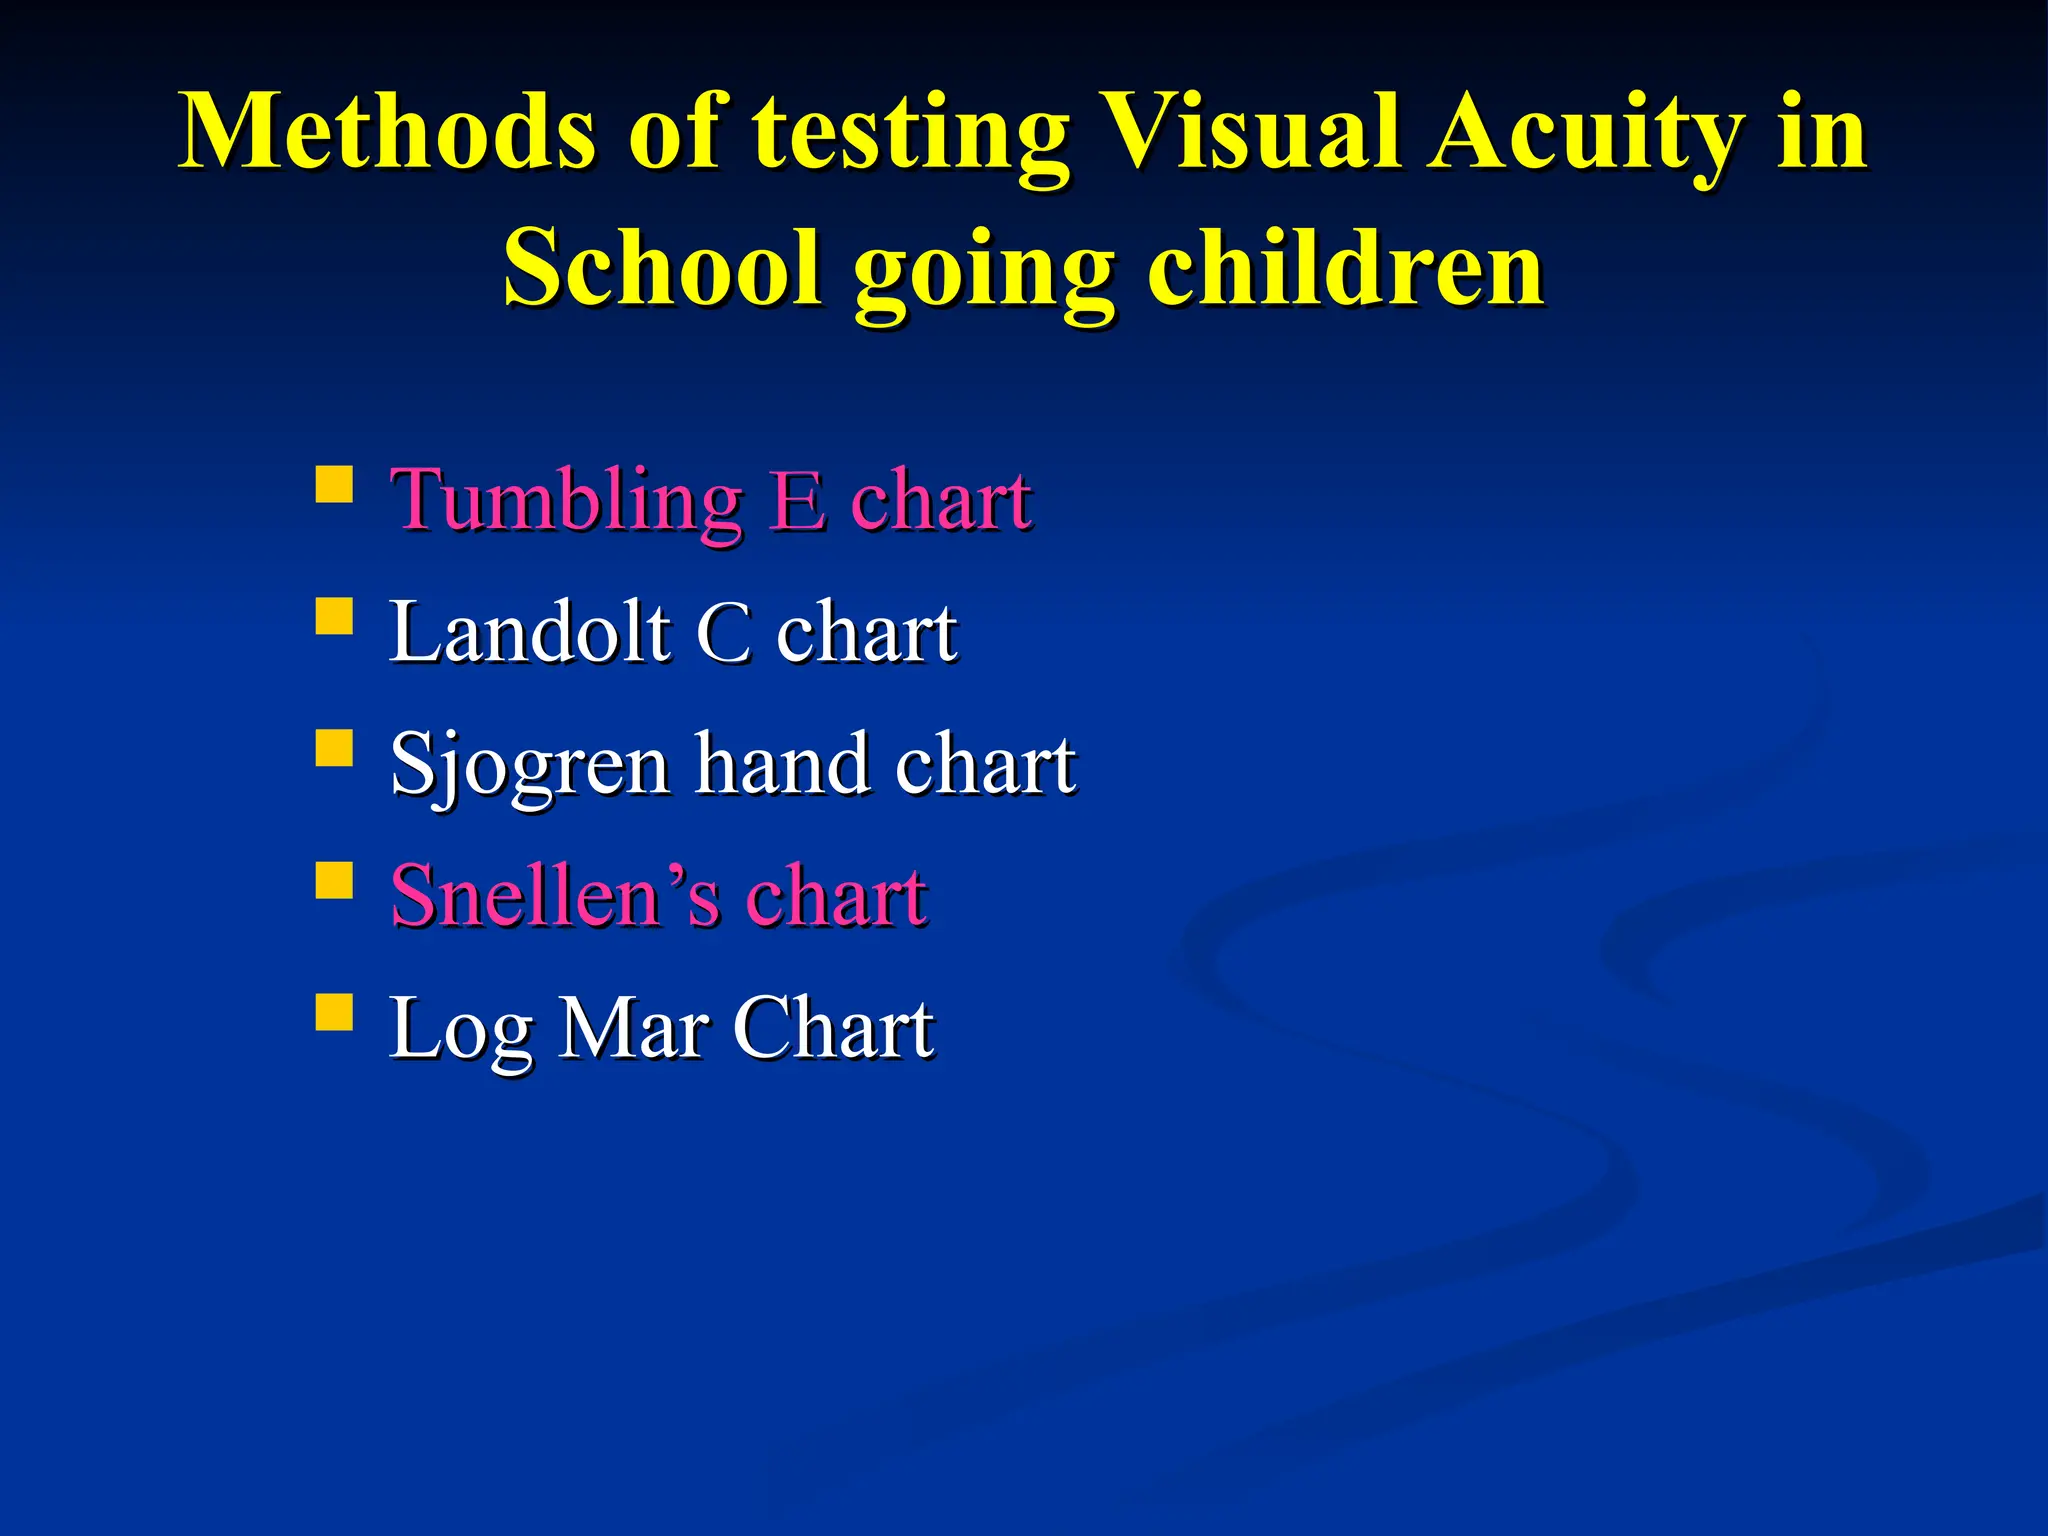
Visual Acuity Assessment
in Children
RAJNISH KISHORE
28th
August 2010
Visual Acuity
Visual Acuity
 Defined as an estimation of spatial resolution
Defined as an estimation of spatial resolution
ability
ability
 Only a part of visual function
Only a part of visual function
1. Minimum distinguishable acuity
2. Minimum separable acuity
3. Minimum recognizable or legible acuity
Why record visual acuity in children ?
 Most eye problems can be treated if detected
Most eye problems can be treated if detected
early
early
 Useful in decision making
Useful in decision making
 To know if visual development is normal
To know if visual development is normal
 Helps decide eligibility for low vision and
Helps decide eligibility for low vision and
rehabilitation services
History
History
 In mid 1950s, with the establishment of the
In mid 1950s, with the establishment of the
Allen cards, development of pediatric acuity
testing techniques were reported
Age Groups
Age Groups
 Infants (Birth – 14 months)
Infants (Birth – 14 months)
 Toddlers (14 months – 2
Toddlers (14 months – 21
1
/
/2
2 years)
years)
 Preschoolers (2
Preschoolers (21
1
/
/2
2 years – 5 years)
years – 5 years)
 School going children (5 years – 15
School going children (5 years – 15
years)
years)
Age
Age Approx. Snellen Acuity
Approx. Snellen Acuity
Birth
Birth 6/300 (20/1000)
6/300 (20/1000)
1month
1month 6/200 – 6/90 (20/667)
6/200 – 6/90 (20/667)
3months
3months 6/90 – 6/60 (20/300 – 20/200)
6/90 – 6/60 (20/300 – 20/200)
6months
6months 6/36 – 6/30 (20/120 – 20/100)
6/36 – 6/30 (20/120 – 20/100)
9months
9months 6/24 (20/80)
6/24 (20/80)
1year
1year 6/18 (20/60)
6/18 (20/60)
18months
18months 6/12 (20/40)
6/12 (20/40)
2years
2years 6/12 – 6/9 (20/40 – 20/30)
6/12 – 6/9 (20/40 – 20/30)
3years
3years 6/9 – 6/6 singles (20/30 – 20/20)
6/9 – 6/6 singles (20/30 – 20/20)
4years
4years 6/9 – 6/6 crowded(20/30 – 20/20)
6/9 – 6/6 crowded(20/30 – 20/20)
5years
5years 6/6 – 6/5 (20/20 – 20/17)
6/6 – 6/5 (20/20 – 20/17)
Ability to fixate and Follow
Methods of testing Visual Acuity
in Infants
in Infants
 Fixation Maintain
Fixation Maintain
 Fixation Preference
Fixation Preference
 Optokinetic Nystagmus (OKN)
Optokinetic Nystagmus (OKN)
 Force Choice Preferential looking test (FCPL)
Force Choice Preferential looking test (FCPL)
 Visual Evoked Potential (VEP)
Visual Evoked Potential (VEP)
Fixation Maintain
Fixation Maintain
 There are two types fixations are present
There are two types fixations are present
1.Centric
1.Centric
2. Eccentric
2. Eccentric
 Component
Component of Fixation
of Fixation
C =
C = Central
Central
S =
S = Steady
Steady
M
M = Maintained
= Maintained
Fixation Preference
Fixation Preference
 Place a 10D base down prism in front of one eye
Place a 10D base down prism in front of one eye
 Alternate fixation indicate equal visual acuity in both
Alternate fixation indicate equal visual acuity in both
eyes
eyes
 If fixation does not maintain then preferred eye
If fixation does not maintain then preferred eye
occluded
occluded
 If fixation is maintained through a blink, then also
If fixation is maintained through a blink, then also
visual acuity is good
Optokinetic Nystagmus
 OKN drum consist of
OKN drum consist of
white and black strips
rotates in front of
rotates in front of
infant’s eye
infant’s eye
 Examiner has to follow
Examiner has to follow
the fixation movement
of patient’s eye
of patient’s eye
Force Choice Preferential Looking Test
 Infants prefer to fixate high
Infants prefer to fixate high
contrast bold strips rather than
homogenous field of light
 Two target and a central fixation
Two target and a central fixation
light at infant’s eye level
 Examiner has to become familiar
Examiner has to become familiar
with the child’s looking style
First fixation
First fixation
Duration of fixation
Facial expression of patient
Visual Evoked Potential
Visual Evoked Potential /
/ Visual
Visual
Evoked Cortical Potential
 A checkerboard stimulus
A checkerboard stimulus
phase altered at a rate of
6 cycle/sec in front of the
patient’s eyes
patient’s eyes
 A electrode placed on
A electrode placed on
skull over occipital lobe
 Result is compared with
Result is compared with
the VEP of adult
the VEP of adult
Methods of testing Visual Acuity in
Toddlers
Toddlers
 Hundred and Thousand Sweet Test
Hundred and Thousand Sweet Test
 The Cardiff Acuity Test
The Cardiff Acuity Test
 Dott Visual Acuity Testing
Dott Visual Acuity Testing
Hundred and Thousand Sweet Test
 A very sweet test
A very sweet test
 If child able to pick
If child able to pick
up small sweets at 33
cm, visual acuity is
at least 6/24 or 20/80
The Cardiff Acuity Test
 The principle of the target design
The principle of the target design
is that of the vanishing optotype
 The targets are pictures drawn
The targets are pictures drawn
with a white band bordered by
two black bands, all on a neutral
grey background
grey background
 The examiner simply observes
The examiner simply observes
the child’s fixation
Card Picture LogMAR Snellen Snellen
(1M) Acuity Ft Meters
B plane 0.9 20/160 6/96
C teacup 0.8 20/127 6/76
D hanger 0.7 20/100 6/60
E clock 0.6 20/80 6/48
F phone 0.5 20/63 6/38
G scissors 0.4 20/50 6/30
H glass 0.3 20/40 6/24
I ball 0.2 20/32 6/19
J plane 0.1 20/25 6/15
K hanger 0 20/20 6/12
L scissors -0.1 20/16 6/9.5
Dott Visual Acuity Testing
 Black dots on white background
Black dots on white background
 Touch a black dot
Touch a black dot
 Test dist--25 cm
Test dist--25 cm
 VA--20/800 to 20/20
VA--20/800 to 20/20
Administration of Tests in Preschoolers
 Step 1
Step 1
A pretest to teach and check the child's
reliability in responding to the test
 Step 2
Step 2
A test to assure that the child’s responses are
reliable at 10ft (3m)
 Step 3
Step 3
Actual measurement of acuity level at 10ft
(3mt)
(3mt)
Methods of testing Visual Acuity in
Preschoolers
Preschoolers
 LEA Symbols
LEA Symbols
 Light House Flash and Card Testing
Light House Flash and Card Testing
 Allen Picture Card
Allen Picture Card
 Broken Wheel Test
Broken Wheel Test
 Tumbling
Tumbling E
E chart
chart
 Landolt
Landolt C
C chart
chart
 Sjogren hand test
Sjogren hand test
 HOTV test
HOTV test
LEA Symbols test
LEA Symbols test
 Task is to match and point
Task is to match and point
out the distance target
 10 feet distance
10 feet distance
 pictures--circle
pictures--circle
square
square
house
house
apple
apple
Light House Flash Card Testing
 12 cards are available, size
12 cards are available, size
of each card is
of each card is
4
4×5 inch
×5 inch
 These cards have three
These cards have three
types of picture target
 Target size available from
Target size available from
20
20
/
/200
200 –
– 20
20
/
/10
10
 In
In 20
20
/
/200
200 card we have
card we have 20
20
/
/100
100
target size on the reverse
side
side
Allen Picture Card
Allen Picture Card
 Here 6 pictures have been
Here 6 pictures have been
used
used
--Horse, Bird, Cake, Hand
Car and Telephone
Car and Telephone
 Card size : 4
Card size : 4 ×
× 4 inch with white
4 inch with white
background
background
Broken Wheel Test
Broken Wheel Test
 Here cards are presented with
Here cards are presented with
picture of a car, very familiar
to the child
to the child
 Two cards are held before the
Two cards are held before the
child, he simply has to
recognize
recognize
which one is broken
which one is broken
 It consist of 8 pairs of test
It consist of 8 pairs of test
cards and a sample pair of card
(equivalent to
(equivalent to 20
20
/120
/120 test size)
test size)
Tumbling
Tumbling E
E chart
chart
 English E letter is used in
English E letter is used in
different directions
 The child has to detect the
The child has to detect the
orientation of the limbs
 Simons introduced use three
Simons introduced use three
directions to avoid confusion
Landolt
Landolt C
C chart
chart Sjogren hand test
Sjogren hand test
HOTV Test
HOTV Test
 Optotypes are used
Optotypes are used
to avoid left right
to avoid left right
confusion
confusion
 Child has to identify
Child has to identify
the letter optotypes
Methods of testing Visual Acuity in
School going children
 Tumbling
Tumbling E
E chart
chart
 Landolt
Landolt C
C chart
chart
 Sjogren hand chart
Sjogren hand chart
 Snellen’s chart
Snellen’s chart
 Log Mar Chart
Log Mar Chart
Snellen’s chart
Snellen’s chart
 7 diff size levels
7 diff size levels
 1 letter at largest size
1 letter at largest size
level & no. at each
level & no. at each
size level increases
 No log progression
No log progression
Log Mar Chart
Log Mar Chart
 A logarithmic size
A logarithmic size
progression
progression
 Same no. of letters at
Same no. of letters at
each level
each level
 Between letter &
Between letter &
between row spaces
between row spaces
proportional to letter
size
size
 Good legibility for
Good legibility for
optotype at each level
Evaluation of Binocular Vision
Binocular vision of children is been greatly
affected in presence of strabismus
 Direction
Direction
 Frequency
Frequency
 Magnitude
Magnitude
 Laterality
Laterality
 AC/A ratio
AC/A ratio
 Cosmesis
Cosmesis
Sequence of Testing for Binocular
Alignment
Alignment
1.
1. Observation
Observation
2.
2. Hirschberg Test
Hirschberg Test
3.
3. Krimsky Test  Prism Bar Reflex Test
Krimsky Test  Prism Bar Reflex Test
4.
4. Bruckner Test
Bruckner Test
5.
5. Cover Test
Cover Test
Observation
Observation
 Optometrist should be
Optometrist should be
looking for obvious
looking for obvious
stimulus
stimulus
 Pseudo esotropia
Pseudo esotropia
-Epicanthic folds
-Epicanthic folds
-Short inter pupillary
distance
distance
- negative angle Kappa
 Pseudo exotropia
Pseudo exotropia
-Wide inter pupillary
distance
distance
-Positive angle Kappa
Hirschberg Test
Hirschberg Test
 Patient has to fix the
Patient has to fix the
penlight of the examiner,
held at 50cm
held at 50cm
 Examine the corneal reflex
Examine the corneal reflex
in relation to the centre
of the pupil
of the pupil
Krimsky Test  Prism Bar Reflex Test
 Helpful for estimating
Helpful for estimating
the magnitude of infant’s
strabismus, cause poor
vision
vision
Bruckner Test
Bruckner Test
 Illuminate infant’s both
Illuminate infant’s both
eyes with a direct
eyes with a direct
ophthalmoscope from1mt
 By comparing the
By comparing the
reflexes examiner can
evaluate binocular
evaluate binocular
alignment
alignment
Cover Test
Cover Test
 Direct cover test
Direct cover test
 Cover uncover test
Cover uncover test
 Alternate cover test
Alternate cover test
ENVIRONMENT ADJUSTMENT
 Reception area--small chairs
Reception area--small chairs
toys
toys
games
games
puzzles
puzzles
 Scheduling appt—Child’s daily rhythm.
Scheduling appt—Child’s daily rhythm.
 Small but meaningful changes
Small but meaningful changes
 Normal wallpapers --familiar cartoons
Normal wallpapers --familiar cartoons
 choose to conduct exam--without white coat--
choose to conduct exam--without white coat--
reduce the appearance of ophthalmic
equipment
equipment
“Thank
Y0U”
SHIV AAJ BHI GURU HAI

Visual_Acuity_Assessment_in_Children.ppt

  • 1.
    Visual Acuity Assessment inChildren RAJNISH KISHORE 28th August 2010
  • 2.
    Visual Acuity Visual Acuity Defined as an estimation of spatial resolution Defined as an estimation of spatial resolution ability ability  Only a part of visual function Only a part of visual function 1. Minimum distinguishable acuity 1. Minimum distinguishable acuity 2. Minimum separable acuity 2. Minimum separable acuity 3. Minimum recognizable or legible acuity 3. Minimum recognizable or legible acuity
  • 3.
    Why record visualacuity in children ? Why record visual acuity in children ?  Most eye problems can be treated if detected Most eye problems can be treated if detected early early  Useful in decision making Useful in decision making  To know if visual development is normal To know if visual development is normal  Helps decide eligibility for low vision and Helps decide eligibility for low vision and rehabilitation services rehabilitation services
  • 4.
    History History  In mid1950s, with the establishment of the In mid 1950s, with the establishment of the Allen cards, development of pediatric acuity Allen cards, development of pediatric acuity testing techniques were reported testing techniques were reported
  • 5.
    Age Groups Age Groups Infants (Birth – 14 months) Infants (Birth – 14 months)  Toddlers (14 months – 2 Toddlers (14 months – 21 1 / /2 2 years) years)  Preschoolers (2 Preschoolers (21 1 / /2 2 years – 5 years) years – 5 years)  School going children (5 years – 15 School going children (5 years – 15 years) years)
  • 6.
    Age Age Approx. SnellenAcuity Approx. Snellen Acuity Birth Birth 6/300 (20/1000) 6/300 (20/1000) 1month 1month 6/200 – 6/90 (20/667) 6/200 – 6/90 (20/667) 3months 3months 6/90 – 6/60 (20/300 – 20/200) 6/90 – 6/60 (20/300 – 20/200) 6months 6months 6/36 – 6/30 (20/120 – 20/100) 6/36 – 6/30 (20/120 – 20/100) 9months 9months 6/24 (20/80) 6/24 (20/80) 1year 1year 6/18 (20/60) 6/18 (20/60) 18months 18months 6/12 (20/40) 6/12 (20/40) 2years 2years 6/12 – 6/9 (20/40 – 20/30) 6/12 – 6/9 (20/40 – 20/30) 3years 3years 6/9 – 6/6 singles (20/30 – 20/20) 6/9 – 6/6 singles (20/30 – 20/20) 4years 4years 6/9 – 6/6 crowded(20/30 – 20/20) 6/9 – 6/6 crowded(20/30 – 20/20) 5years 5years 6/6 – 6/5 (20/20 – 20/17) 6/6 – 6/5 (20/20 – 20/17)
  • 10.
    Ability to fixateand Follow Ability to fixate and Follow
  • 11.
    Methods of testingVisual Acuity Methods of testing Visual Acuity in Infants in Infants  Fixation Maintain Fixation Maintain  Fixation Preference Fixation Preference  Optokinetic Nystagmus (OKN) Optokinetic Nystagmus (OKN)  Force Choice Preferential looking test (FCPL) Force Choice Preferential looking test (FCPL)  Visual Evoked Potential (VEP) Visual Evoked Potential (VEP)
  • 12.
    Fixation Maintain Fixation Maintain There are two types fixations are present There are two types fixations are present 1.Centric 1.Centric 2. Eccentric 2. Eccentric  Component Component of Fixation of Fixation C = C = Central Central S = S = Steady Steady M M = Maintained = Maintained
  • 13.
    Fixation Preference Fixation Preference Place a 10D base down prism in front of one eye Place a 10D base down prism in front of one eye  Alternate fixation indicate equal visual acuity in both Alternate fixation indicate equal visual acuity in both eyes eyes  If fixation does not maintain then preferred eye If fixation does not maintain then preferred eye occluded occluded  If fixation is maintained through a blink, then also If fixation is maintained through a blink, then also visual acuity is good visual acuity is good
  • 14.
    Optokinetic Nystagmus Optokinetic Nystagmus OKN drum consist of OKN drum consist of white and black strips white and black strips rotates in front of rotates in front of infant’s eye infant’s eye  Examiner has to follow Examiner has to follow the fixation movement the fixation movement of patient’s eye of patient’s eye
  • 15.
    Force Choice PreferentialLooking Test Force Choice Preferential Looking Test  Infants prefer to fixate high Infants prefer to fixate high contrast bold strips rather than contrast bold strips rather than homogenous field of light homogenous field of light  Two target and a central fixation Two target and a central fixation light at infant’s eye level light at infant’s eye level  Examiner has to become familiar Examiner has to become familiar with the child’s looking style with the child’s looking style First fixation First fixation Duration of fixation Duration of fixation Facial expression of patient Facial expression of patient
  • 16.
    Visual Evoked Potential VisualEvoked Potential / / Visual Visual Evoked Cortical Potential Evoked Cortical Potential  A checkerboard stimulus A checkerboard stimulus phase altered at a rate of phase altered at a rate of 6 cycle/sec in front of the 6 cycle/sec in front of the patient’s eyes patient’s eyes  A electrode placed on A electrode placed on skull over occipital lobe skull over occipital lobe  Result is compared with Result is compared with the VEP of adult the VEP of adult
  • 17.
    Methods of testingVisual Acuity in Methods of testing Visual Acuity in Toddlers Toddlers  Hundred and Thousand Sweet Test Hundred and Thousand Sweet Test  The Cardiff Acuity Test The Cardiff Acuity Test  Dott Visual Acuity Testing Dott Visual Acuity Testing
  • 18.
    Hundred and ThousandSweet Test Hundred and Thousand Sweet Test  A very sweet test A very sweet test  If child able to pick If child able to pick up small sweets at 33 up small sweets at 33 cm, visual acuity is cm, visual acuity is at least 6/24 or 20/80 at least 6/24 or 20/80
  • 19.
    The Cardiff AcuityTest The Cardiff Acuity Test  The principle of the target design The principle of the target design is that of the vanishing optotype is that of the vanishing optotype  The targets are pictures drawn The targets are pictures drawn with a white band bordered by with a white band bordered by two black bands, all on a neutral two black bands, all on a neutral grey background grey background  The examiner simply observes The examiner simply observes the child’s fixation the child’s fixation
  • 20.
    Card Picture LogMARSnellen Snellen (1M) Acuity Ft Meters B plane 0.9 20/160 6/96 C teacup 0.8 20/127 6/76 D hanger 0.7 20/100 6/60 E clock 0.6 20/80 6/48 F phone 0.5 20/63 6/38 G scissors 0.4 20/50 6/30 H glass 0.3 20/40 6/24 I ball 0.2 20/32 6/19 J plane 0.1 20/25 6/15 K hanger 0 20/20 6/12 L scissors -0.1 20/16 6/9.5
  • 21.
    Dott Visual AcuityTesting Dott Visual Acuity Testing  Black dots on white background Black dots on white background  Touch a black dot Touch a black dot  Test dist--25 cm Test dist--25 cm  VA--20/800 to 20/20 VA--20/800 to 20/20
  • 22.
    Administration of Testsin Preschoolers Administration of Tests in Preschoolers  Step 1 Step 1 A pretest to teach and check the child's A pretest to teach and check the child's reliability in responding to the test reliability in responding to the test  Step 2 Step 2 A test to assure that the child’s responses are A test to assure that the child’s responses are reliable at 10ft (3m) reliable at 10ft (3m)  Step 3 Step 3 Actual measurement of acuity level at 10ft Actual measurement of acuity level at 10ft (3mt) (3mt)
  • 23.
    Methods of testingVisual Acuity in Methods of testing Visual Acuity in Preschoolers Preschoolers  LEA Symbols LEA Symbols  Light House Flash and Card Testing Light House Flash and Card Testing  Allen Picture Card Allen Picture Card  Broken Wheel Test Broken Wheel Test  Tumbling Tumbling E E chart chart  Landolt Landolt C C chart chart  Sjogren hand test Sjogren hand test  HOTV test HOTV test
  • 24.
    LEA Symbols test LEASymbols test  Task is to match and point Task is to match and point out the distance target out the distance target  10 feet distance 10 feet distance  pictures--circle pictures--circle square square house house apple apple
  • 25.
    Light House FlashCard Testing Light House Flash Card Testing  12 cards are available, size 12 cards are available, size of each card is of each card is 4 4×5 inch ×5 inch  These cards have three These cards have three types of picture target types of picture target  Target size available from Target size available from 20 20 / /200 200 – – 20 20 / /10 10  In In 20 20 / /200 200 card we have card we have 20 20 / /100 100 target size on the reverse target size on the reverse side side
  • 26.
    Allen Picture Card AllenPicture Card  Here 6 pictures have been Here 6 pictures have been used used --Horse, Bird, Cake, Hand --Horse, Bird, Cake, Hand Car and Telephone Car and Telephone  Card size : 4 Card size : 4 × × 4 inch with white 4 inch with white background background
  • 27.
    Broken Wheel Test BrokenWheel Test  Here cards are presented with Here cards are presented with picture of a car, very familiar picture of a car, very familiar to the child to the child  Two cards are held before the Two cards are held before the child, he simply has to child, he simply has to recognize recognize which one is broken which one is broken  It consist of 8 pairs of test It consist of 8 pairs of test cards and a sample pair of card cards and a sample pair of card (equivalent to (equivalent to 20 20 /120 /120 test size) test size)
  • 28.
    Tumbling Tumbling E E chart chart English E letter is used in English E letter is used in different directions different directions  The child has to detect the The child has to detect the orientation of the limbs orientation of the limbs  Simons introduced use three Simons introduced use three directions to avoid confusion directions to avoid confusion
  • 29.
    Landolt Landolt C C chart chartSjogren hand test Sjogren hand test
  • 30.
    HOTV Test HOTV Test Optotypes are used Optotypes are used to avoid left right to avoid left right confusion confusion  Child has to identify Child has to identify the letter optotypes the letter optotypes
  • 31.
    Methods of testingVisual Acuity in Methods of testing Visual Acuity in School going children School going children  Tumbling Tumbling E E chart chart  Landolt Landolt C C chart chart  Sjogren hand chart Sjogren hand chart  Snellen’s chart Snellen’s chart  Log Mar Chart Log Mar Chart
  • 32.
    Snellen’s chart Snellen’s chart 7 diff size levels 7 diff size levels  1 letter at largest size 1 letter at largest size level & no. at each level & no. at each size level increases size level increases  No log progression No log progression
  • 33.
    Log Mar Chart LogMar Chart  A logarithmic size A logarithmic size progression progression  Same no. of letters at Same no. of letters at each level each level  Between letter & Between letter & between row spaces between row spaces proportional to letter proportional to letter size size  Good legibility for Good legibility for optotype at each level optotype at each level
  • 34.
    Evaluation of BinocularVision Evaluation of Binocular Vision Binocular vision of children is been greatly Binocular vision of children is been greatly affected in presence of strabismus affected in presence of strabismus  Direction Direction  Frequency Frequency  Magnitude Magnitude  Laterality Laterality  AC/A ratio AC/A ratio  Cosmesis Cosmesis
  • 35.
    Sequence of Testingfor Binocular Sequence of Testing for Binocular Alignment Alignment 1. 1. Observation Observation 2. 2. Hirschberg Test Hirschberg Test 3. 3. Krimsky Test Prism Bar Reflex Test Krimsky Test Prism Bar Reflex Test 4. 4. Bruckner Test Bruckner Test 5. 5. Cover Test Cover Test
  • 36.
    Observation Observation  Optometrist shouldbe Optometrist should be looking for obvious looking for obvious stimulus stimulus  Pseudo esotropia Pseudo esotropia -Epicanthic folds -Epicanthic folds -Short inter pupillary -Short inter pupillary distance distance - negative angle Kappa - negative angle Kappa  Pseudo exotropia Pseudo exotropia -Wide inter pupillary -Wide inter pupillary distance distance -Positive angle Kappa -Positive angle Kappa
  • 37.
    Hirschberg Test Hirschberg Test Patient has to fix the Patient has to fix the penlight of the examiner, penlight of the examiner, held at 50cm held at 50cm  Examine the corneal reflex Examine the corneal reflex in relation to the centre in relation to the centre of the pupil of the pupil
  • 38.
    Krimsky Test Prism Bar Reflex Test Krimsky Test Prism Bar Reflex Test  Helpful for estimating Helpful for estimating the magnitude of infant’s the magnitude of infant’s strabismus, cause poor strabismus, cause poor vision vision
  • 39.
    Bruckner Test Bruckner Test Illuminate infant’s both Illuminate infant’s both eyes with a direct eyes with a direct ophthalmoscope from1mt ophthalmoscope from1mt  By comparing the By comparing the reflexes examiner can reflexes examiner can evaluate binocular evaluate binocular alignment alignment
  • 40.
    Cover Test Cover Test Direct cover test Direct cover test  Cover uncover test Cover uncover test  Alternate cover test Alternate cover test
  • 41.
    ENVIRONMENT ADJUSTMENT ENVIRONMENT ADJUSTMENT Reception area--small chairs Reception area--small chairs toys toys games games puzzles puzzles  Scheduling appt—Child’s daily rhythm. Scheduling appt—Child’s daily rhythm.  Small but meaningful changes Small but meaningful changes
  • 42.
     Normal wallpapers--familiar cartoons Normal wallpapers --familiar cartoons  choose to conduct exam--without white coat-- choose to conduct exam--without white coat-- reduce the appearance of ophthalmic reduce the appearance of ophthalmic equipment equipment
  • 43.

Editor's Notes

  • #4 Snellen chart was introduced in 1862. In 1903 American Ophthalmological Society established the use of capital letters
  • #16 visual evoked potential (VEP) is an evoked potential caused by sensory stimulation of a subject's visual field and is observed using an electroencephalography. Commonly used visual stimuli are flashing lights, or checkerboards on a video screen that flicker between black on white to white on black (invert contrast). Visual evoked potentials are very useful in detecting blindness in patients that cannot communicate, such as babies or non-human animals. If repeated stimulation of the visual field causes no changes in EEG potentials, then the subject's brain is probably not receiving any signals from his/her eyes. Other applications include the diagnosis of optic neuritis, which causes the signal to be delayed. Such a delay is also a classic finding in Multiple Sclerosis. Visual evoked potentials are furthermore used in the investigation of basic functions of visual perception.
  • #25 Test distance 3mt. At first patient is shown big pictures to identify that. House, umbrella and apple.
  • #26 Allen cards 4 * 4 inch white cards 4 cards each in a cluster Drawings on each side-4 cards in 1 cluster Drawings on one side- 3 cards & 1 card for test instructions Name the objects correctly --not imp Birthday cake as birthday
  • #41 meaningful changes= High contrast