Downloaded 623 times

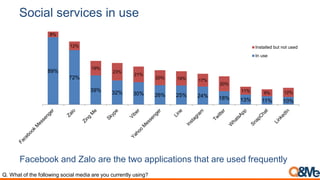
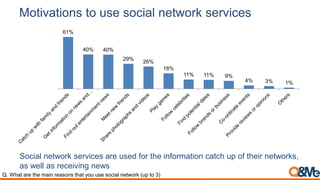
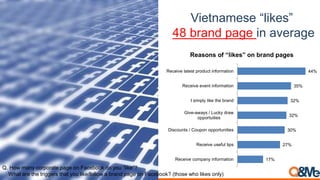
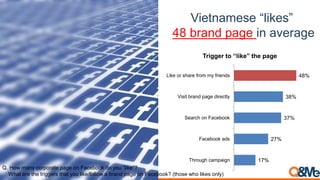
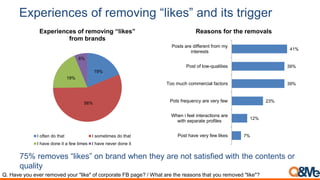

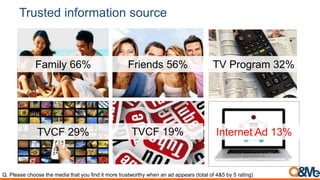
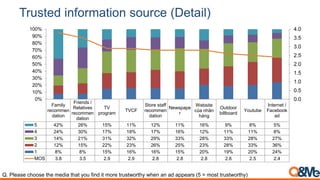
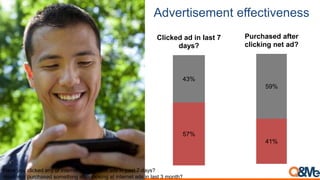

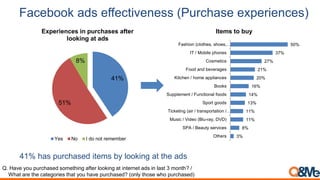
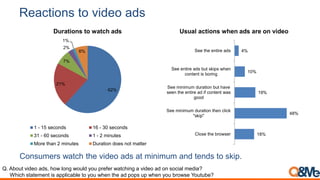
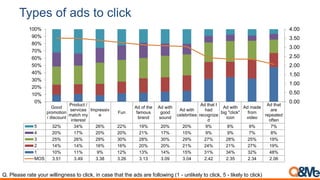
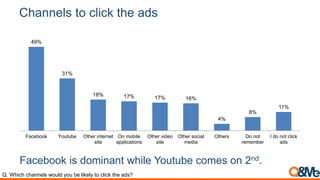
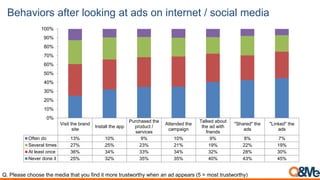
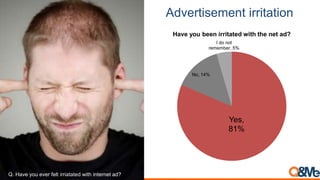
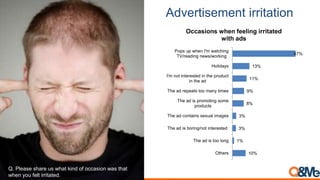
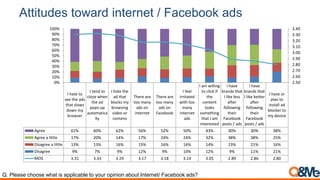


Vietnam's social media usage was surveyed by Asia Plus Inc. The key findings were: - Facebook and Zalo were the most used social media platforms in Vietnam. - Vietnamese used social media primarily for keeping up with friends/networks and receiving news. - Most Vietnamese accessed the internet via smartphones. - Brand pages were "liked" mainly to receive product/event info and discounts. Videos ads under 30 seconds received the most engagement. - Friends and family were considered the most trusted sources of information over advertising. However, 41% had purchased products after seeing online ads. The survey provided insights into Vietnamese social media behaviors and attitudes toward digital advertising.

![[Survey] Vietnam mom's shopping behavior change](https://cdn.slidesharecdn.com/ss_thumbnails/momsshoppingbehaviorssurvey0622fin-170622051113-thumbnail.jpg?width=640&height=640&fit=bounds)


![[Survey] Vietnamese health consciousness and fitness demand](https://cdn.slidesharecdn.com/ss_thumbnails/vietnamesefitnessdemand-171230164614-thumbnail.jpg?width=640&height=640&fit=bounds)

![[Survey Report] Vietnam Youth Lifestyle](https://cdn.slidesharecdn.com/ss_thumbnails/vietnamyouthreporten1124-151123033055-lva1-app6892-thumbnail.jpg?width=640&height=640&fit=bounds)


![[Research];[Social marketing]](https://cdn.slidesharecdn.com/ss_thumbnails/guitapchimarketing-viettrackmarketresearch-sep2009-101230031053-phpapp02-thumbnail.jpg?width=640&height=640&fit=bounds)


![[Survey] Comparison b/w Vietnam Airlines and VieJet](https://cdn.slidesharecdn.com/ss_thumbnails/vietnamairvsvietjet-170604040856-thumbnail.jpg?width=640&height=640&fit=bounds)


