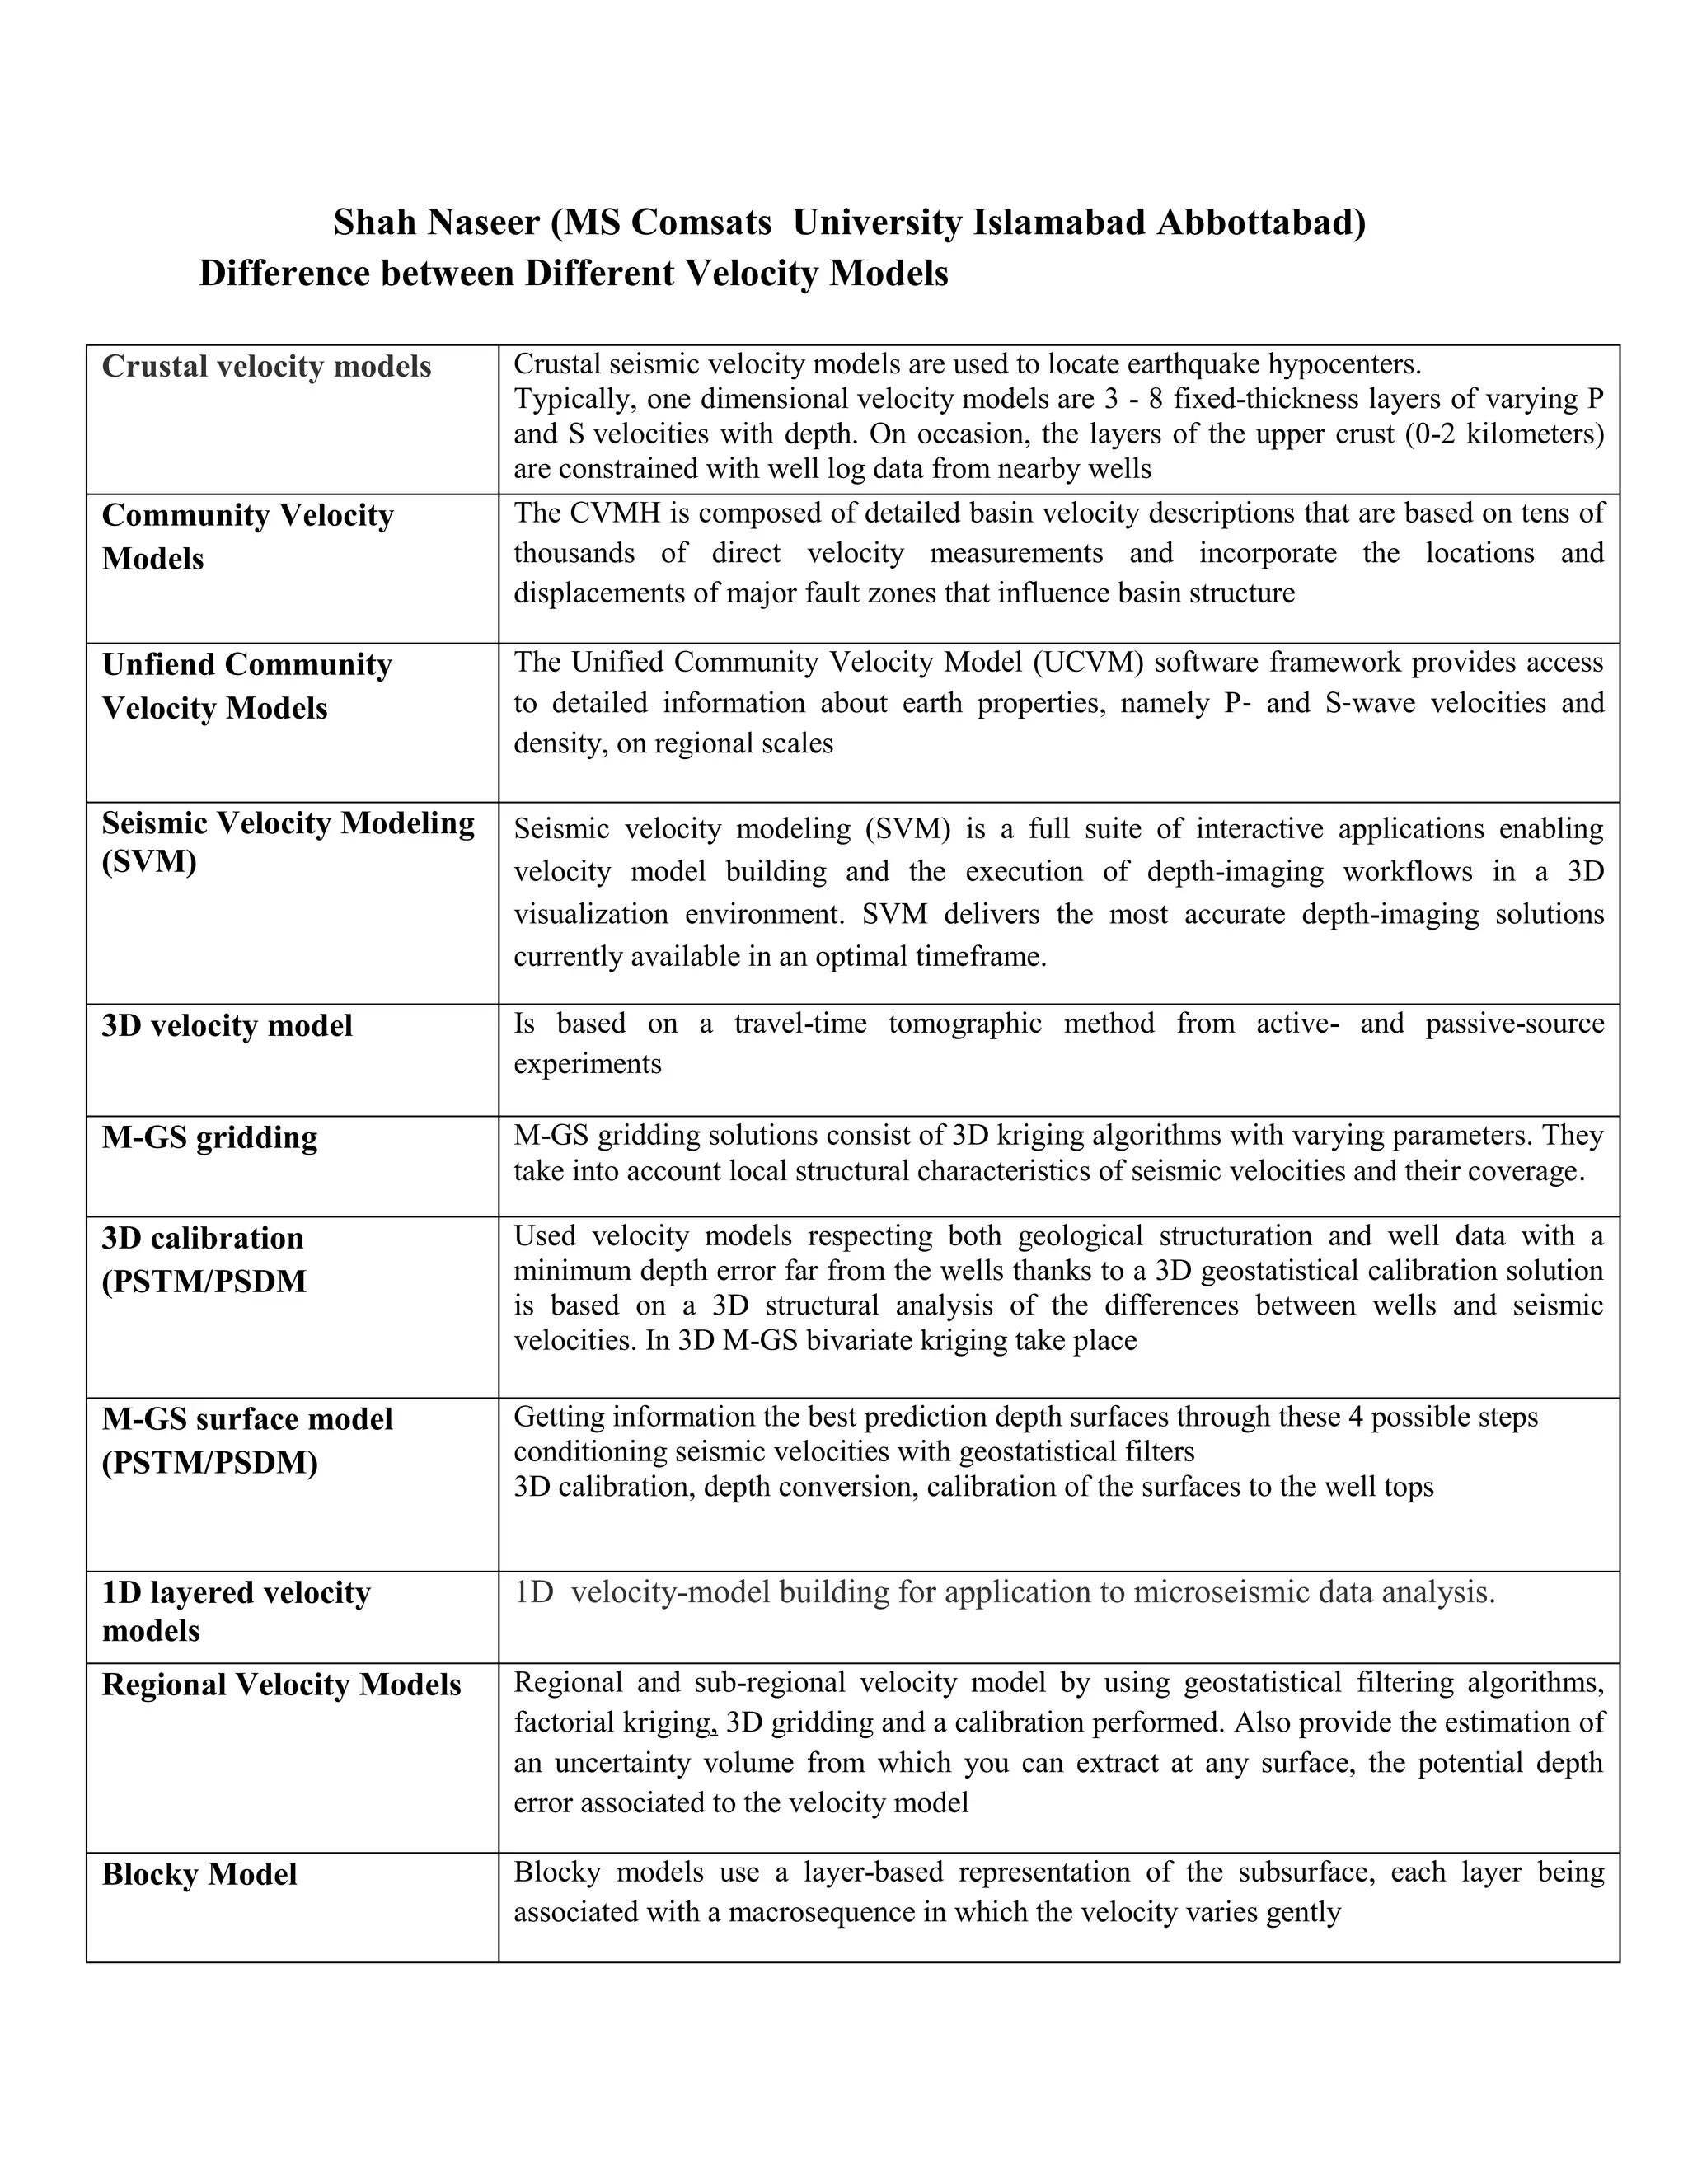
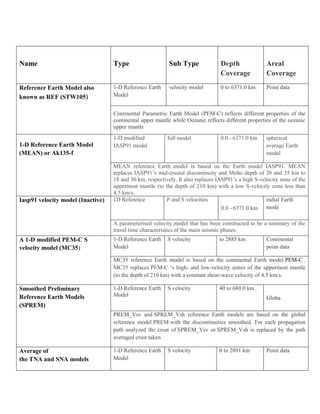
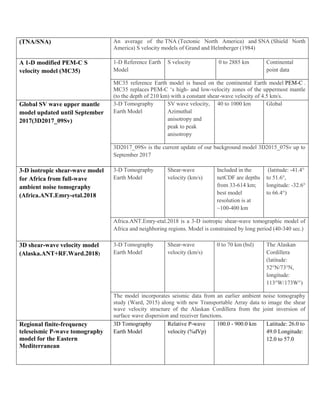
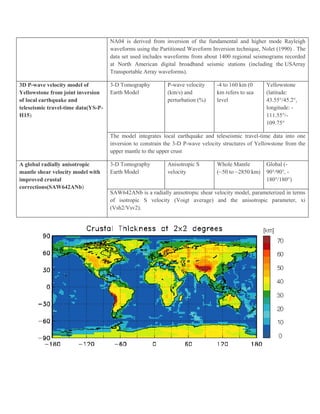
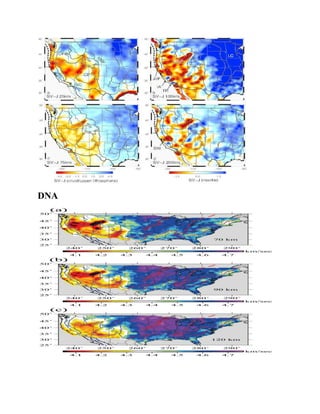
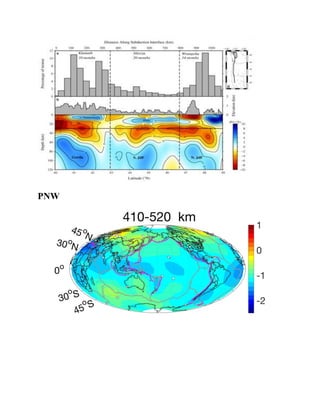
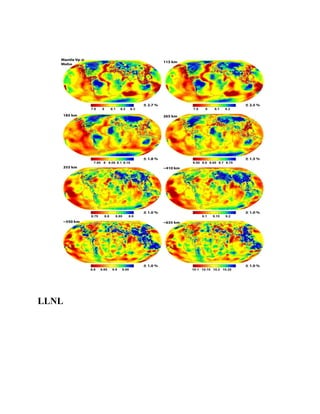
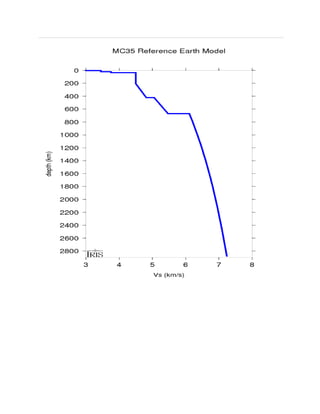
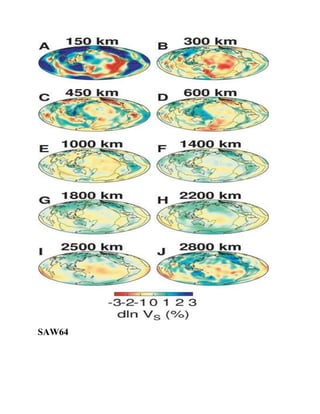
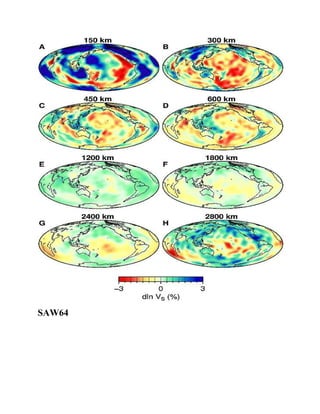
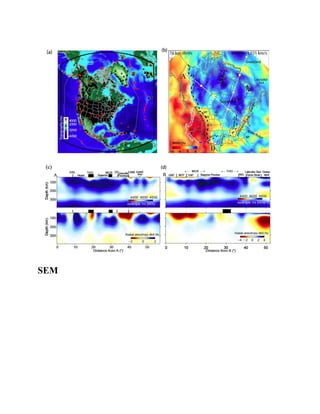
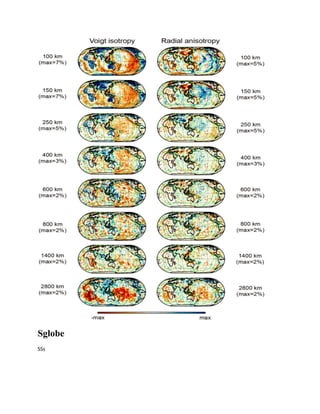
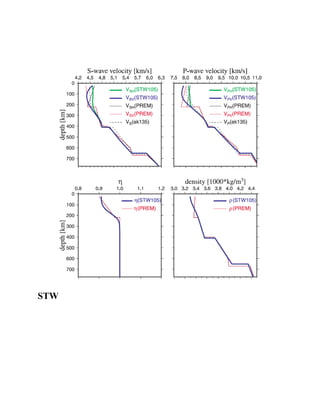
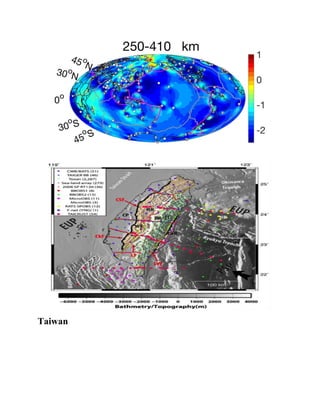
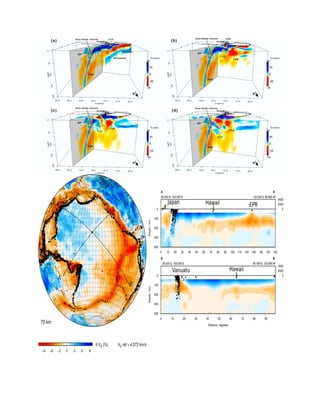
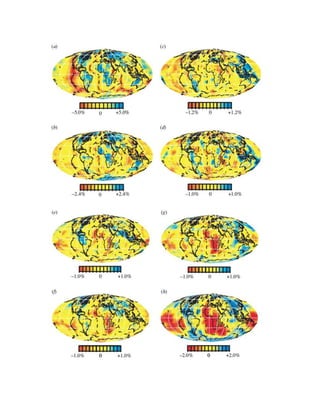
The document discusses several types of seismic velocity models including 1D layered models, community velocity models based on direct measurements, unified community models, and 3D tomography models derived from active and passive seismic data. It provides details on numerous global and regional reference models for the crust, mantle, and specific tectonic provinces.
Mineral deposits known to occur in Egypt; Classification of mineral deposit in Egypt, Possible Areas for Investment in Mineral Industry in Egypt, Mineral Commodities
Geology is the one of the most interesting subject about mother earth which can be best studied on field. This report of geological field work done at Chobhar area, Kathmandu consists observation with analysis regarding geological features, structures and processes.
Basin margins and its formation mechanism.Usama Shah
This great work done by M. Wajid Manzoor, student of PU Lahore, will help you to understand basics of Basin Margins, its formation mechanism, and most important thing that is Sedimentary Basins of Pakistan.
https://planet-geology.com/geology-gate-2021-crash-course/
Solution to the GATE 2018 Geology and Geophysics (Geology option) Examination. GATE is the national level examination that is used to test subject-specific knowledge. GATE score is used by universities for awarding admissions to their graduate programmes and by government companies to recruit technical professionals.
Planet-G provides online GSI and GATE coaching for Geology students:
Visit our channel at: https://www.youtube.com/channel/UC8GLL_Ppud7U51HA0tFRYvw
https://geologyplanet.wordpress.com/
Geological surveys are normally undertaken by private agencies, state government departs of mines and geology, and national geological survey organizations. They maintain the geological inventory of various formations, mineral deposits and resources. They keep all records for the advancement of knowledge of geosciences for the benefit of the nation. Geological mapping are parts of a geological survey. It involves certain procedures. This lesson highlights the methods and procedures of geological mapping.
Testing the global grid of master events for waveform cross correlation with ...Ivan Kitov
Abstract
The Comprehensive Nuclear-Test-Ban Treaty’s verification regime requires uniform distribution of monitoring capabilities over the globe. The use of waveform cross correlation as a monitoring technique demands waveform templates from master events outside regions of natural seismicity and test sites. We populated aseismic areas with masters having synthetic templates for predefined sets (from 3 to 10) of primary array stations of the International Monitoring System. Previously, we tested the global set of master events and synthetic templates using IMS seismic data for February 12, 2013 and demonstrated excellent detection and location capability of the matched filter technique. In this study, we test the global grid of synthetic master events using seismic events from the Reviewed Event Bulletin. For detection, we use standard STA/LTA (SNR) procedure applied to the time series of cross correlation coefficient (CC). Phase association is based on SNR, CC, and arrival times. Azimuth and slowness estimates based f-k analysis cross correlation traces are used to reject false arrivals.
The analysis of all of the significant processes that formed a basin and deformed its sedimentary fill from basin-scale processes (e.g., plate tectonics)
to centimeter-scale processes (e.g., fracturing)
Seismic waves are the waves of energy caused by the sudden breaking of rock within the earth or an explosion.
Response of material to the arrival of energy fronts released by rupture.
Energy that travels through the earth and is recorded on seismographs.
A fossil is the preserved remains of a once-living organism.
Fossils give clues about organisms that lived long ago. They help to show that evolution has occurred.
They also provide evidence about how Earth’s surface has changed over time.
Fossils help scientists understand what past environments may have been like.
A fossil is an impression, cast,
original material or track of any animal or plant that is preserved in rock after the original organic material is transformed or removed.
Second-largest phylum in number of species- over 100,000 described.
Ecologically widespread- marine, freshwater, terrestrial (gastropods very successful on land)
Variety of body plans (therefore, many classes within the phylum)
Variety in body size- from ~1 mm to ~18 m (60 feet). 80% are under 5 cm, but many are large and therefore significant as food for man.
A synthetic gemstone is identical to a natural gemstone in almost every way.This includes the same basic crystal structure, refractive index, specific gravity, chemical composition, colors, and other characteristics. Since the same gemological tests are used for stone identification on both natural and synthetic gems, it is sometimes even possible for a gemologist to be puzzled as to whether or not a stone is natural or synthetic. When this occurs, the best course of action is to send the stone to an accredited gem laboratory, like the Gemological Institute of America. They can positively determin ewhether a stone is synthetic or naturally occuring. Only minor internal characteristics allow separation of a synthetic gemstone from a natural gemston
Slide 1: Title Slide
Extrachromosomal Inheritance
Slide 2: Introduction to Extrachromosomal Inheritance
Definition: Extrachromosomal inheritance refers to the transmission of genetic material that is not found within the nucleus.
Key Components: Involves genes located in mitochondria, chloroplasts, and plasmids.
Slide 3: Mitochondrial Inheritance
Mitochondria: Organelles responsible for energy production.
Mitochondrial DNA (mtDNA): Circular DNA molecule found in mitochondria.
Inheritance Pattern: Maternally inherited, meaning it is passed from mothers to all their offspring.
Diseases: Examples include Leber’s hereditary optic neuropathy (LHON) and mitochondrial myopathy.
Slide 4: Chloroplast Inheritance
Chloroplasts: Organelles responsible for photosynthesis in plants.
Chloroplast DNA (cpDNA): Circular DNA molecule found in chloroplasts.
Inheritance Pattern: Often maternally inherited in most plants, but can vary in some species.
Examples: Variegation in plants, where leaf color patterns are determined by chloroplast DNA.
Slide 5: Plasmid Inheritance
Plasmids: Small, circular DNA molecules found in bacteria and some eukaryotes.
Features: Can carry antibiotic resistance genes and can be transferred between cells through processes like conjugation.
Significance: Important in biotechnology for gene cloning and genetic engineering.
Slide 6: Mechanisms of Extrachromosomal Inheritance
Non-Mendelian Patterns: Do not follow Mendel’s laws of inheritance.
Cytoplasmic Segregation: During cell division, organelles like mitochondria and chloroplasts are randomly distributed to daughter cells.
Heteroplasmy: Presence of more than one type of organellar genome within a cell, leading to variation in expression.
Slide 7: Examples of Extrachromosomal Inheritance
Four O’clock Plant (Mirabilis jalapa): Shows variegated leaves due to different cpDNA in leaf cells.
Petite Mutants in Yeast: Result from mutations in mitochondrial DNA affecting respiration.
Slide 8: Importance of Extrachromosomal Inheritance
Evolution: Provides insight into the evolution of eukaryotic cells.
Medicine: Understanding mitochondrial inheritance helps in diagnosing and treating mitochondrial diseases.
Agriculture: Chloroplast inheritance can be used in plant breeding and genetic modification.
Slide 9: Recent Research and Advances
Gene Editing: Techniques like CRISPR-Cas9 are being used to edit mitochondrial and chloroplast DNA.
Therapies: Development of mitochondrial replacement therapy (MRT) for preventing mitochondrial diseases.
Slide 10: Conclusion
Summary: Extrachromosomal inheritance involves the transmission of genetic material outside the nucleus and plays a crucial role in genetics, medicine, and biotechnology.
Future Directions: Continued research and technological advancements hold promise for new treatments and applications.
Slide 11: Questions and Discussion
Invite Audience: Open the floor for any questions or further discussion on the topic.
Earliest Galaxies in the JADES Origins Field: Luminosity Function and Cosmic ...Sérgio Sacani
We characterize the earliest galaxy population in the JADES Origins Field (JOF), the deepest
imaging field observed with JWST. We make use of the ancillary Hubble optical images (5 filters
spanning 0.4−0.9µm) and novel JWST images with 14 filters spanning 0.8−5µm, including 7 mediumband filters, and reaching total exposure times of up to 46 hours per filter. We combine all our data
at > 2.3µm to construct an ultradeep image, reaching as deep as ≈ 31.4 AB mag in the stack and
30.3-31.0 AB mag (5σ, r = 0.1” circular aperture) in individual filters. We measure photometric
redshifts and use robust selection criteria to identify a sample of eight galaxy candidates at redshifts
z = 11.5 − 15. These objects show compact half-light radii of R1/2 ∼ 50 − 200pc, stellar masses of
M⋆ ∼ 107−108M⊙, and star-formation rates of SFR ∼ 0.1−1 M⊙ yr−1
. Our search finds no candidates
at 15 < z < 20, placing upper limits at these redshifts. We develop a forward modeling approach to
infer the properties of the evolving luminosity function without binning in redshift or luminosity that
marginalizes over the photometric redshift uncertainty of our candidate galaxies and incorporates the
impact of non-detections. We find a z = 12 luminosity function in good agreement with prior results,
and that the luminosity function normalization and UV luminosity density decline by a factor of ∼ 2.5
from z = 12 to z = 14. We discuss the possible implications of our results in the context of theoretical
models for evolution of the dark matter halo mass function.
Nutraceutical market, scope and growth: Herbal drug technologyLokesh Patil
As consumer awareness of health and wellness rises, the nutraceutical market—which includes goods like functional meals, drinks, and dietary supplements that provide health advantages beyond basic nutrition—is growing significantly. As healthcare expenses rise, the population ages, and people want natural and preventative health solutions more and more, this industry is increasing quickly. Further driving market expansion are product formulation innovations and the use of cutting-edge technology for customized nutrition. With its worldwide reach, the nutraceutical industry is expected to keep growing and provide significant chances for research and investment in a number of categories, including vitamins, minerals, probiotics, and herbal supplements.
Cancer cell metabolism: special Reference to Lactate PathwayAADYARAJPANDEY1
Normal Cell Metabolism:
Cellular respiration describes the series of steps that cells use to break down sugar and other chemicals to get the energy we need to function.
Energy is stored in the bonds of glucose and when glucose is broken down, much of that energy is released.
Cell utilize energy in the form of ATP.
The first step of respiration is called glycolysis. In a series of steps, glycolysis breaks glucose into two smaller molecules - a chemical called pyruvate. A small amount of ATP is formed during this process.
Most healthy cells continue the breakdown in a second process, called the Kreb's cycle. The Kreb's cycle allows cells to “burn” the pyruvates made in glycolysis to get more ATP.
The last step in the breakdown of glucose is called oxidative phosphorylation (Ox-Phos).
It takes place in specialized cell structures called mitochondria. This process produces a large amount of ATP. Importantly, cells need oxygen to complete oxidative phosphorylation.
If a cell completes only glycolysis, only 2 molecules of ATP are made per glucose. However, if the cell completes the entire respiration process (glycolysis - Kreb's - oxidative phosphorylation), about 36 molecules of ATP are created, giving it much more energy to use.
IN CANCER CELL:
Unlike healthy cells that "burn" the entire molecule of sugar to capture a large amount of energy as ATP, cancer cells are wasteful.
Cancer cells only partially break down sugar molecules. They overuse the first step of respiration, glycolysis. They frequently do not complete the second step, oxidative phosphorylation.
This results in only 2 molecules of ATP per each glucose molecule instead of the 36 or so ATPs healthy cells gain. As a result, cancer cells need to use a lot more sugar molecules to get enough energy to survive.
introduction to WARBERG PHENOMENA:
WARBURG EFFECT Usually, cancer cells are highly glycolytic (glucose addiction) and take up more glucose than do normal cells from outside.
Otto Heinrich Warburg (; 8 October 1883 – 1 August 1970) In 1931 was awarded the Nobel Prize in Physiology for his "discovery of the nature and mode of action of the respiratory enzyme.
WARNBURG EFFECT : cancer cells under aerobic (well-oxygenated) conditions to metabolize glucose to lactate (aerobic glycolysis) is known as the Warburg effect. Warburg made the observation that tumor slices consume glucose and secrete lactate at a higher rate than normal tissues.
What is greenhouse gasses and how many gasses are there to affect the Earth.moosaasad1975
What are greenhouse gasses how they affect the earth and its environment what is the future of the environment and earth how the weather and the climate effects.
THE IMPORTANCE OF MARTIAN ATMOSPHERE SAMPLE RETURN.Sérgio Sacani
The return of a sample of near-surface atmosphere from Mars would facilitate answers to several first-order science questions surrounding the formation and evolution of the planet. One of the important aspects of terrestrial planet formation in general is the role that primary atmospheres played in influencing the chemistry and structure of the planets and their antecedents. Studies of the martian atmosphere can be used to investigate the role of a primary atmosphere in its history. Atmosphere samples would also inform our understanding of the near-surface chemistry of the planet, and ultimately the prospects for life. High-precision isotopic analyses of constituent gases are needed to address these questions, requiring that the analyses are made on returned samples rather than in situ.
Professional air quality monitoring systems provide immediate, on-site data for analysis, compliance, and decision-making.
Monitor common gases, weather parameters, particulates.
1. Shah Naseer (MS Comsats University Islamabad Abbottabad)
Difference between Different Velocity Models
Crustal velocity models Crustal seismic velocity models are used to locate earthquake hypocenters.
Typically, one dimensional velocity models are 3 - 8 fixed-thickness layers of varying P
and S velocities with depth. On occasion, the layers of the upper crust (0-2 kilometers)
are constrained with well log data from nearby wells
Community Velocity
Models
The CVMH is composed of detailed basin velocity descriptions that are based on tens of
thousands of direct velocity measurements and incorporate the locations and
displacements of major fault zones that influence basin structure
Unfiend Community
Velocity Models
The Unified Community Velocity Model (UCVM) software framework provides access
to detailed information about earth properties, namely P‐ and S‐wave velocities and
density, on regional scales
Seismic Velocity Modeling
(SVM)
Seismic velocity modeling (SVM) is a full suite of interactive applications enabling
velocity model building and the execution of depth-imaging workflows in a 3D
visualization environment. SVM delivers the most accurate depth-imaging solutions
currently available in an optimal timeframe.
3D velocity model Is based on a travel-time tomographic method from active- and passive-source
experiments
M-GS gridding M-GS gridding solutions consist of 3D kriging algorithms with varying parameters. They
take into account local structural characteristics of seismic velocities and their coverage.
3D calibration
(PSTM/PSDM
Used velocity models respecting both geological structuration and well data with a
minimum depth error far from the wells thanks to a 3D geostatistical calibration solution
is based on a 3D structural analysis of the differences between wells and seismic
velocities. In 3D M-GS bivariate kriging take place
M-GS surface model
(PSTM/PSDM)
Getting information the best prediction depth surfaces through these 4 possible steps
conditioning seismic velocities with geostatistical filters
3D calibration, depth conversion, calibration of the surfaces to the well tops
1D layered velocity
models
1D velocity-model building for application to microseismic data analysis.
Regional Velocity Models Regional and sub-regional velocity model by using geostatistical filtering algorithms,
factorial kriging, 3D gridding and a calibration performed. Also provide the estimation of
an uncertainty volume from which you can extract at any surface, the potential depth
error associated to the velocity model
Blocky Model Blocky models use a layer-based representation of the subsurface, each layer being
associated with a macrosequence in which the velocity varies gently
2. Name Type Sub Type Depth
Coverage
Areal
Coverage
Reference Earth Model also
known as REF (STW105)
1-D Reference Earth
Model
velocity model 0 to 6371.0 km Point data
Continental Parametric Earth Model (PEM-C) reflects different properties of the
continental upper mantle while Oceanic reflects different properties of the oceanic
upper mantle
1-D Reference Earth Model
(MEAN) or Ak135-f
1-D modified
IASP91 model
full model 0.0 - 6371.0 km spherical
average Earth
model
MEAN reference Earth model is based on the Earth model IASP91. MEAN
replaces IASP91’s mid-crustal discontinuity and Moho depth of 20 and 35 km to
18 and 30 km, respectively. It also replaces IASP91’s a high S-velocity zone of the
uppermost mantle (to the depth of 210 km) with a low S-velocity zone less than
4.5 km/s.
Iasp91 velocity model (Inactive) 1D Reference P and S velocities
0.0 - 6371.0 km
radial Earth
mode
A parameterised velocity model that has been constructed to be a summary of the
travel time characteristics of the main seismic phases.
A 1-D modified PEM-C S
velocity model (MC35)
1-D Reference Earth
Model
S velocity to 2885 km Continental
point data
MC35 reference Earth model is based on the continental Earth model PEM-C .
MC35 replaces PEM-C ‘s high- and low-velocity zones of the uppermost mantle
(to the depth of 210 km) with a constant shear-wave velocity of 4.5 km/s.
Smoothed Preliminary
Reference Earth Models
(SPREM)
1-D Reference Earth
Model
S velocity 40 to 680.0 km
Globa
PREM_Vsv and SPREM_Vsh reference Earth models are based on the global
reference model PREM with the discontinuities smoothed. For each propagation
path analyzed the crust of SPREM_Vsv or SPREM_Vsh is replaced by the path
averaged crust taken
Average of
the TNA and SNA models
1-D Reference Earth
Model
S velocity 0 to 2891 km Point data
3. (TNA/SNA) An average of the TNA (Tectonic North America) and SNA (Shield North
America) S velocity models of Grand and Helmberger (1984)
A 1-D modified PEM-C S
velocity model (MC35)
1-D Reference Earth
Model
S velocity 0 to 2885 km Continental
point data
MC35 reference Earth model is based on the continental Earth model PEM-C .
MC35 replaces PEM-C ‘s high- and low-velocity zones of the uppermost mantle
(to the depth of 210 km) with a constant shear-wave velocity of 4.5 km/s.
Global SV wave upper mantle
model updated until September
2017(3D2017_09Sv)
3-D Tomography
Earth Model
SV wave velocity,
Azimuthal
anisotropy and
peak to peak
anisotropy
40 to 1000 km Global
3D2017_09Sv is the current update of our background model 3D2015_07Sv up to
September 2017
3-D isotropic shear-wave model
for Africa from full-wave
ambient noise tomography
(Africa.ANT.Emry-etal.2018
3-D Tomography
Earth Model
Shear-wave
velocity (km/s)
Included in the
netCDF are depths
from 33-614 km;
best model
resolution is at
~100-400 km
(latitude: -41.4°
to 51.6°,
longitude: -32.6°
to 66.4°)
Africa.ANT.Emry-etal.2018 is a 3-D isotropic shear-wave tomographic model of
Africa and neighboring regions. Model is constrained by long period (40-340 sec.)
3D shear-wave velocity model
(Alaska.ANT+RF.Ward.2018)
3-D Tomography
Earth Model
Shear-wave
velocity (km/s)
0 to 70 km (bsl) The Alaskan
Cordillera
(latitude:
52°N/73°N,
longitude:
113°W/173W°)
The model incorporates seismic data from an earlier ambient noise tomography
study (Ward, 2015) along with new Transportable Array data to image the shear
wave velocity structure of the Alaskan Cordillera from the joint inversion of
surface wave dispersion and receiver functions.
Regional finite-frequency
teleseismic P-wave tomography
model for the Eastern
Mediterranean
3D Tomography
Earth Model
Relative P-wave
velocity (%dVp)
100.0 - 900.0 km Latitude: 26.0 to
49.0 Longitude:
12.0 to 57.0
4. Model uses relative arrival time residuals from 936 earthquakes recorded at 313
stations of a variety of temporary and permanent seismic deployments in Turkey,
Greece, Cyprus, and Armenia. Residuals are measured in four frequency bands and
inverted in a finite-frequency tomographic inversion
Preliminary Reference Earth
Model (PREM)
1-D Reference Earth
Model
full model 0 to 6371.0 km Point data
The Preliminary Reference Earth Model, Dziewonski and Anderson (1981) , is an
average Earth model that incorporates anelastic dispersion and anisotropy and
therefore it is frequency-dependent and transversely isotropic for the upper mantle.
Parametric Earth Models
(PEM)
1-D Reference Earth
Model
full model 0 to 6371.0 km Point data
Continental Parametric Earth Model (PEM-C) reflects different properties of the
continental upper mantle.s Oceanic Parametric Earth Model (PEM-O) reflects
different properties of the oceanic upper mantle
Global upper mantle surface
wave tomography
model(CAM2016)
3-D Tomography
Earth Model
S velocity Upper mantle (40
to 680 km
Global
CAM2016 is a group of global upper mantle models based on multi-mode surface
wave tomography
P- and S-velocity models for the
western US integrating body-
and surface-wave
constraints(DNA13)
3-D Tomography
Earth Model
P and S velocity
perturbations(%)
0 to 1280km (best
resolution 0 to
1000km)
United States
(25°/52°, -126°/-
72°)
The DNA13 model integrates teleseismic body-wave traveltime and surface-wave
phase velocity measurements into a single inversion to constrain the P- and S-wave
velocity structure s
A global compressional velocity
model of the mantle from
cluster Analysis of long-period
Waveforms (HMSL-P06)
3-D Tomography
Earth Model
Compressional
velocity
perturbation (%)
66 to 2900 km Global (-
90°/90°, -
180°/180°)
HMSL-P06 is an isotropic P velocity model with 18 layers (approximately 100 km
thickness in the upper mantle and 200 km in the lower mantle) and 2578 blocks in
each layer (approximately 4 degree equal area blocks at the equator). The upper
mantle is constrained to be a scaled
North American upper mantle
surface wave tomography model
(NA04)
3-D Tomography
Earth Model
S velocit Upper mantle (70
to 670 km)
North America
(10°/85°, -170°/-
55°)
5. NA04 is derived from inversion of the fundamental and higher mode Rayleigh
waveforms using the Partitioned Waveform Inversion technique, Nolet (1990) . The
data set used includes waveforms from about 1400 regional seismograms recorded
at North American digital broadband seismic stations (including the USArray
Transportable Array waveforms).
3D P-wave velocity model of
Yellowstone from joint inversion
of local earthquake and
teleseismic travel-time data(YS-P-
H15)
3-D Tomography
Earth Model
P-wave velocity
(km/s) and
perturbation (%)
-4 to 160 km (0
km refers to sea
level
Yellowstone
(latitude:
43.55°/45.2°,
longitude: -
111.55°/-
109.75°
The model integrates local earthquake and teleseismic travel-time data into one
inversion to constrain the 3-D P-wave velocity structures of Yellowstone from the
upper mantle to the upper crust
A global radially anisotropic
mantle shear velocity model with
improved crustal
corrections(SAW642ANb)
3-D Tomography
Earth Model
Anisotropic S
velocity
Whole Mantle
(~50 to ~2850 km)
Global (-
90°/90°, -
180°/180°)
SAW642ANb is a radially anisotropic shear velocity model, parameterized in terms
of isotropic S velocity (Voigt average) and the anisotropic parameter, xi
(Vsh2/Vsv2).