SlideShare a Scribd company logo
1 of 19
FWS 04 L 10 – Structural AnalysisCourtesy of ExxonMobil
Lecture 10Lecture 10
Hor. 2
Hor. 1
Hor. 3
FWS 04 L 10 – Structural AnalysisCourtesy of ExxonMobil
Structural Analysis - What is it?
The analysis of all of the significant processes that
formed a basin and deformed its sedimentary fill
from basin-scale processes (e.g., plate tectonics)
to centimeter-scale processes (e.g., fracturing)
Some Major Elements:
• Basin Formation
• Fault Network Mapping
• Stratigraphic Deformation
• Present-Day Trap Definition
• Timing of Trap Development
FWS 04
Steps of Seismic Data Interpretation
• Picking of time and depth.
• Generation of synthetic seismogram.
• Marking targeted horizon.
• Identification of faults.
• Generating grids.
• Generation of time structure maps.
• Generation of depth contour maps.
• Analyzing results and conclusions.
L 10 – Structural AnalysisCourtesy of ExxonMobil
FWS 04 L 10 – Structural AnalysisCourtesy of ExxonMobil
Role of Seismic Interpretation
• Identify and map faults, folds, uplifts, and
other structural elements
• Interpret structural settings and structural
styles
• Insure 3D geometric consistency in an
interpretation - is it structurally valid?
• Determine timing relationships, especially
the timing of trap formation
• Check if the interpretation is admissibility
FWS 04 L 5 – Seismic MethodCourtesy of ExxonMobil
Seismic Interpretation
Determine the local geology from the subsurface images
• Map faults and other structural features
• Map unconformities and other major stratal surfaces
• Interpret depositional environments
• Infer lithofacies from reflection patterns & velocities
• Predict ages of stratal units
• Examine elements of the HC systems
Mitchum et al., 1977
AAPG©1977 reprinted with permission of the AAPG
whose permission is required for further use.
FWS 04 L 10 – Structural AnalysisCourtesy of ExxonMobil
A Caution about Seismic Images
Most seismic data
is displayed in 2-
way TIME, which
can distort
geometric
relationships
Watch the vertical
exaggeration
It changes with depth
V:H is 1:1
At 2500 m/s
V:H is 0.9:1
At 3000 m/s
1 km
V:H is 0.8:1
At 3500 m/s
V:H is 1.3:1
At 1900 m/s
FWS 04 L 10 – Structural AnalysisCourtesy of ExxonMobil
The WEAKNESSES of Seismic Data
• Limited resolution: can’t resolve “small”
features
• Steep dips can be difficult to image
• Acquisition can be difficult, e. g. in areas of:
variable topography, variable surface
geology, or “hard” water bottom
• Vertical axis is typically (migrated) time, not
depth
– Velocity variations distort geometries
• Display scales are commonly not V:H=1:1,
which results in distortions of geometries
• Typically we can’t “see” hydrocarbons
FWS 04 L 10 – Structural AnalysisCourtesy of ExxonMobil
Basic Observations: Profile View
We can recognize moderate- to large-scale
faults on seismic profiles by:
• Termination of reflections
• Offset in stratigraphic markers
• Abrupt changes in dip
• Abrupt changes in seismic patterns
• Fault plane reflections
• Associated folding or sag
• Discontinuities
FWS 04
Seismic Section
L 10 – Structural AnalysisCourtesy of ExxonMobil
FWS 04
Synthethic Seismogram
L 10 – Structural AnalysisCourtesy of ExxonMobil
FWS 04 L 10 – Structural AnalysisCourtesy of ExxonMobil
Fault Identification: Time Slice View
1856 ms
Do you see evidence for faults?Do you see evidence for faults?
FWS 04 L 10 – Structural AnalysisCourtesy of ExxonMobil
Fault Identification: Profile Views
A
B
C
tie
W EN S
A B C
Faults must tie on
lines that intersect
or the interpretation
is not internally
consistent
FWS 04
Time Contour Map
L 10 – Structural AnalysisCourtesy of ExxonMobil
FWS 04 L 10 – Structural AnalysisCourtesy of ExxonMobil
FWS 04
Depth Contour Map
L 10 – Structural AnalysisCourtesy of ExxonMobil
FWS 04 L 10 – Structural AnalysisCourtesy of ExxonMobil
FWS 04
Isopach Map
L 10 – Structural AnalysisCourtesy of ExxonMobil
FWS 04 L 10 – Structural AnalysisCourtesy of ExxonMobil

More Related Content

What's hot

Avo ppt (Amplitude Variation with Offset)
Avo ppt (Amplitude Variation with Offset)Avo ppt (Amplitude Variation with Offset)
Avo ppt (Amplitude Variation with Offset)Haseeb Ahmed
 
Seismic Attributes .pptx
Seismic Attributes .pptxSeismic Attributes .pptx
Seismic Attributes .pptxHaseeb Ahmed
 
Bp sesmic interpretation
Bp sesmic interpretationBp sesmic interpretation
Bp sesmic interpretationMarwan Mahmoud
 
Static model development
Static model developmentStatic model development
Static model developmentKunal Rathod
 
Interpretation 23.12.13
Interpretation 23.12.13Interpretation 23.12.13
Interpretation 23.12.13Shashwat Sinha
 
Seismic attribute analysis using complex trace analysis
Seismic attribute analysis using complex trace analysisSeismic attribute analysis using complex trace analysis
Seismic attribute analysis using complex trace analysisSomak Hajra
 
Quantitative and Qualitative Seismic Interpretation of Seismic Data
Quantitative and Qualitative Seismic Interpretation of Seismic Data Quantitative and Qualitative Seismic Interpretation of Seismic Data
Quantitative and Qualitative Seismic Interpretation of Seismic Data Haseeb Ahmed
 
Role of Seismic Attributes in Petroleum Exploration_30May22.pptx
Role of Seismic Attributes in Petroleum Exploration_30May22.pptxRole of Seismic Attributes in Petroleum Exploration_30May22.pptx
Role of Seismic Attributes in Petroleum Exploration_30May22.pptxNagaLakshmiVasa
 
Practical sequence stratigraphy for iconoclasts
Practical sequence stratigraphy for iconoclastsPractical sequence stratigraphy for iconoclasts
Practical sequence stratigraphy for iconoclastsChristopher Modica
 
Seismic data processing 13 stacking&migration
Seismic data processing 13 stacking&migrationSeismic data processing 13 stacking&migration
Seismic data processing 13 stacking&migrationAmin khalil
 
Petrophysic interpretation
Petrophysic interpretationPetrophysic interpretation
Petrophysic interpretationAndi Anriansyah
 
Seismic data processing
Seismic data processingSeismic data processing
Seismic data processingShah Naseer
 
seismic interpretations
seismic interpretationsseismic interpretations
seismic interpretationsBryanMagwood1
 
Seismic Data Processing, Ahmed Osama
Seismic Data Processing, Ahmed OsamaSeismic Data Processing, Ahmed Osama
Seismic Data Processing, Ahmed OsamaAhmed Osama
 
Formation evaluation and well log correlation
Formation evaluation and well log correlationFormation evaluation and well log correlation
Formation evaluation and well log correlationSwapnil Pal
 

What's hot (20)

3D Facies Modeling
3D Facies Modeling3D Facies Modeling
3D Facies Modeling
 
seismic inversion
seismic inversionseismic inversion
seismic inversion
 
Principles of seismic data processing m.m.badawy
Principles of seismic data processing m.m.badawyPrinciples of seismic data processing m.m.badawy
Principles of seismic data processing m.m.badawy
 
Avo ppt (Amplitude Variation with Offset)
Avo ppt (Amplitude Variation with Offset)Avo ppt (Amplitude Variation with Offset)
Avo ppt (Amplitude Variation with Offset)
 
Seismic Attributes .pptx
Seismic Attributes .pptxSeismic Attributes .pptx
Seismic Attributes .pptx
 
Introduction to velocity model building
Introduction to velocity model buildingIntroduction to velocity model building
Introduction to velocity model building
 
Velocity model building in Petrel
Velocity model building in PetrelVelocity model building in Petrel
Velocity model building in Petrel
 
Bp sesmic interpretation
Bp sesmic interpretationBp sesmic interpretation
Bp sesmic interpretation
 
Static model development
Static model developmentStatic model development
Static model development
 
Interpretation 23.12.13
Interpretation 23.12.13Interpretation 23.12.13
Interpretation 23.12.13
 
Seismic attribute analysis using complex trace analysis
Seismic attribute analysis using complex trace analysisSeismic attribute analysis using complex trace analysis
Seismic attribute analysis using complex trace analysis
 
Quantitative and Qualitative Seismic Interpretation of Seismic Data
Quantitative and Qualitative Seismic Interpretation of Seismic Data Quantitative and Qualitative Seismic Interpretation of Seismic Data
Quantitative and Qualitative Seismic Interpretation of Seismic Data
 
Role of Seismic Attributes in Petroleum Exploration_30May22.pptx
Role of Seismic Attributes in Petroleum Exploration_30May22.pptxRole of Seismic Attributes in Petroleum Exploration_30May22.pptx
Role of Seismic Attributes in Petroleum Exploration_30May22.pptx
 
Practical sequence stratigraphy for iconoclasts
Practical sequence stratigraphy for iconoclastsPractical sequence stratigraphy for iconoclasts
Practical sequence stratigraphy for iconoclasts
 
Seismic data processing 13 stacking&migration
Seismic data processing 13 stacking&migrationSeismic data processing 13 stacking&migration
Seismic data processing 13 stacking&migration
 
Petrophysic interpretation
Petrophysic interpretationPetrophysic interpretation
Petrophysic interpretation
 
Seismic data processing
Seismic data processingSeismic data processing
Seismic data processing
 
seismic interpretations
seismic interpretationsseismic interpretations
seismic interpretations
 
Seismic Data Processing, Ahmed Osama
Seismic Data Processing, Ahmed OsamaSeismic Data Processing, Ahmed Osama
Seismic Data Processing, Ahmed Osama
 
Formation evaluation and well log correlation
Formation evaluation and well log correlationFormation evaluation and well log correlation
Formation evaluation and well log correlation
 

Similar to Structur Alanalysis

WS-D1-CEWRE_PPT.pdf
WS-D1-CEWRE_PPT.pdfWS-D1-CEWRE_PPT.pdf
WS-D1-CEWRE_PPT.pdfssuserca460e
 
6a - Fracture characterisation.ppt
6a - Fracture characterisation.ppt6a - Fracture characterisation.ppt
6a - Fracture characterisation.pptSaadTaman
 
Chapter 2 Of Rock Engineering
Chapter 2 Of  Rock  EngineeringChapter 2 Of  Rock  Engineering
Chapter 2 Of Rock EngineeringNgo Hung Long
 
Seismic Analysis of Elevated Water Tank
Seismic Analysis of Elevated Water TankSeismic Analysis of Elevated Water Tank
Seismic Analysis of Elevated Water TankKalaivanan Murthy
 
Seismic stratigraphy techniques
Seismic stratigraphy techniquesSeismic stratigraphy techniques
Seismic stratigraphy techniquesNabaz Jawhar
 
Seismic_Interpretation slides, presentation
Seismic_Interpretation slides, presentationSeismic_Interpretation slides, presentation
Seismic_Interpretation slides, presentationOlumideAjayi22
 
Mine water risk in open pit slope stability
Mine water risk in open pit slope stabilityMine water risk in open pit slope stability
Mine water risk in open pit slope stabilitySafdar Ali
 
Intern PPT Presentation
Intern PPT PresentationIntern PPT Presentation
Intern PPT PresentationGilson Hogan
 
SEISMIC FOR EXPLORING SEABED MINERALS AT THE MID-ATLANTIC RIDGE
SEISMIC FOR EXPLORING SEABED MINERALS AT THE MID-ATLANTIC RIDGESEISMIC FOR EXPLORING SEABED MINERALS AT THE MID-ATLANTIC RIDGE
SEISMIC FOR EXPLORING SEABED MINERALS AT THE MID-ATLANTIC RIDGEiQHub
 
Underground rock reinforcement and support
Underground rock reinforcement and supportUnderground rock reinforcement and support
Underground rock reinforcement and supportBalraj Joshi
 
Earthquake effect on underground structures
Earthquake effect on underground structuresEarthquake effect on underground structures
Earthquake effect on underground structuresHoda Yahyaei
 
Lecture-1.ppt
Lecture-1.pptLecture-1.ppt
Lecture-1.pptWageYado
 
Loew - pore pressure
Loew - pore pressureLoew - pore pressure
Loew - pore pressureceriuniroma
 

Similar to Structur Alanalysis (20)

WS-D1-CEWRE_PPT.pdf
WS-D1-CEWRE_PPT.pdfWS-D1-CEWRE_PPT.pdf
WS-D1-CEWRE_PPT.pdf
 
6a - Fracture characterisation.ppt
6a - Fracture characterisation.ppt6a - Fracture characterisation.ppt
6a - Fracture characterisation.ppt
 
SLOPE STABILITY AND FAILURE
SLOPE STABILITY AND FAILURESLOPE STABILITY AND FAILURE
SLOPE STABILITY AND FAILURE
 
Chapter 2 Of Rock Engineering
Chapter 2 Of  Rock  EngineeringChapter 2 Of  Rock  Engineering
Chapter 2 Of Rock Engineering
 
Seismic Analysis of Elevated Water Tank
Seismic Analysis of Elevated Water TankSeismic Analysis of Elevated Water Tank
Seismic Analysis of Elevated Water Tank
 
Seismic stratigraphy techniques
Seismic stratigraphy techniquesSeismic stratigraphy techniques
Seismic stratigraphy techniques
 
Seismic_Interpretation slides, presentation
Seismic_Interpretation slides, presentationSeismic_Interpretation slides, presentation
Seismic_Interpretation slides, presentation
 
document.pdf
document.pdfdocument.pdf
document.pdf
 
Mine water risk in open pit slope stability
Mine water risk in open pit slope stabilityMine water risk in open pit slope stability
Mine water risk in open pit slope stability
 
Intern PPT Presentation
Intern PPT PresentationIntern PPT Presentation
Intern PPT Presentation
 
A Methodology to Assess the Potential Impacts of Longwall Mining on Streams i...
A Methodology to Assess the Potential Impacts of Longwall Mining on Streams i...A Methodology to Assess the Potential Impacts of Longwall Mining on Streams i...
A Methodology to Assess the Potential Impacts of Longwall Mining on Streams i...
 
2535.pdf
2535.pdf2535.pdf
2535.pdf
 
SEISMIC FOR EXPLORING SEABED MINERALS AT THE MID-ATLANTIC RIDGE
SEISMIC FOR EXPLORING SEABED MINERALS AT THE MID-ATLANTIC RIDGESEISMIC FOR EXPLORING SEABED MINERALS AT THE MID-ATLANTIC RIDGE
SEISMIC FOR EXPLORING SEABED MINERALS AT THE MID-ATLANTIC RIDGE
 
Underground rock reinforcement and support
Underground rock reinforcement and supportUnderground rock reinforcement and support
Underground rock reinforcement and support
 
Earthquake effect on underground structures
Earthquake effect on underground structuresEarthquake effect on underground structures
Earthquake effect on underground structures
 
Lecture-1.ppt
Lecture-1.pptLecture-1.ppt
Lecture-1.ppt
 
Loew - pore pressure
Loew - pore pressureLoew - pore pressure
Loew - pore pressure
 
Seismic Design Basics - Superstructure
Seismic Design Basics - SuperstructureSeismic Design Basics - Superstructure
Seismic Design Basics - Superstructure
 
chapter 8.pptx
chapter 8.pptxchapter 8.pptx
chapter 8.pptx
 
chapter 8.pptx
chapter 8.pptxchapter 8.pptx
chapter 8.pptx
 

More from Shah Naseer

More from Shah Naseer (20)

Velocity Models Difference
Velocity Models DifferenceVelocity Models Difference
Velocity Models Difference
 
Seismic acquisition survey
Seismic acquisition survey Seismic acquisition survey
Seismic acquisition survey
 
Seismic acquisition
Seismic acquisitionSeismic acquisition
Seismic acquisition
 
2 D 3D_ seismic survey
2 D 3D_ seismic survey2 D 3D_ seismic survey
2 D 3D_ seismic survey
 
Seismic waves
Seismic wavesSeismic waves
Seismic waves
 
The geological time scale
The geological time scaleThe geological time scale
The geological time scale
 
fossils
fossilsfossils
fossils
 
Pompeii
PompeiiPompeii
Pompeii
 
Pompeii
PompeiiPompeii
Pompeii
 
What is a fossil?
What is a fossil?What is a fossil?
What is a fossil?
 
Planktonic foraminifera
Planktonic foraminiferaPlanktonic foraminifera
Planktonic foraminifera
 
Mollusca
MolluscaMollusca
Mollusca
 
Mollusc
MolluscMollusc
Mollusc
 
Fossils
 Fossils Fossils
Fossils
 
Classification
ClassificationClassification
Classification
 
Brachiopods
Brachiopods Brachiopods
Brachiopods
 
Benthic foraminifera
Benthic foraminifera Benthic foraminifera
Benthic foraminifera
 
SYNTHETIC GEMSTONE
SYNTHETIC GEMSTONESYNTHETIC GEMSTONE
SYNTHETIC GEMSTONE
 
Seismicity
SeismicitySeismicity
Seismicity
 
Graphite
GraphiteGraphite
Graphite
 

Recently uploaded

RESPIRATORY ADAPTATIONS TO HYPOXIA IN HUMNAS.pptx
RESPIRATORY ADAPTATIONS TO HYPOXIA IN HUMNAS.pptxRESPIRATORY ADAPTATIONS TO HYPOXIA IN HUMNAS.pptx
RESPIRATORY ADAPTATIONS TO HYPOXIA IN HUMNAS.pptxFarihaAbdulRasheed
 
GenBio2 - Lesson 1 - Introduction to Genetics.pptx
GenBio2 - Lesson 1 - Introduction to Genetics.pptxGenBio2 - Lesson 1 - Introduction to Genetics.pptx
GenBio2 - Lesson 1 - Introduction to Genetics.pptxBerniceCayabyab1
 
Harmful and Useful Microorganisms Presentation
Harmful and Useful Microorganisms PresentationHarmful and Useful Microorganisms Presentation
Harmful and Useful Microorganisms Presentationtahreemzahra82
 
Twin's paradox experiment is a meassurement of the extra dimensions.pptx
Twin's paradox experiment is a meassurement of the extra dimensions.pptxTwin's paradox experiment is a meassurement of the extra dimensions.pptx
Twin's paradox experiment is a meassurement of the extra dimensions.pptxEran Akiva Sinbar
 
Vision and reflection on Mining Software Repositories research in 2024
Vision and reflection on Mining Software Repositories research in 2024Vision and reflection on Mining Software Repositories research in 2024
Vision and reflection on Mining Software Repositories research in 2024AyushiRastogi48
 
BREEDING FOR RESISTANCE TO BIOTIC STRESS.pptx
BREEDING FOR RESISTANCE TO BIOTIC STRESS.pptxBREEDING FOR RESISTANCE TO BIOTIC STRESS.pptx
BREEDING FOR RESISTANCE TO BIOTIC STRESS.pptxPABOLU TEJASREE
 
Neurodevelopmental disorders according to the dsm 5 tr
Neurodevelopmental disorders according to the dsm 5 trNeurodevelopmental disorders according to the dsm 5 tr
Neurodevelopmental disorders according to the dsm 5 trssuser06f238
 
Behavioral Disorder: Schizophrenia & it's Case Study.pdf
Behavioral Disorder: Schizophrenia & it's Case Study.pdfBehavioral Disorder: Schizophrenia & it's Case Study.pdf
Behavioral Disorder: Schizophrenia & it's Case Study.pdfSELF-EXPLANATORY
 
Best Call Girls In Sector 29 Gurgaon❤️8860477959 EscorTs Service In 24/7 Delh...
Best Call Girls In Sector 29 Gurgaon❤️8860477959 EscorTs Service In 24/7 Delh...Best Call Girls In Sector 29 Gurgaon❤️8860477959 EscorTs Service In 24/7 Delh...
Best Call Girls In Sector 29 Gurgaon❤️8860477959 EscorTs Service In 24/7 Delh...lizamodels9
 
The dark energy paradox leads to a new structure of spacetime.pptx
The dark energy paradox leads to a new structure of spacetime.pptxThe dark energy paradox leads to a new structure of spacetime.pptx
The dark energy paradox leads to a new structure of spacetime.pptxEran Akiva Sinbar
 
TOPIC 8 Temperature and Heat.pdf physics
TOPIC 8 Temperature and Heat.pdf physicsTOPIC 8 Temperature and Heat.pdf physics
TOPIC 8 Temperature and Heat.pdf physicsssuserddc89b
 
zoogeography of pakistan.pptx fauna of Pakistan
zoogeography of pakistan.pptx fauna of Pakistanzoogeography of pakistan.pptx fauna of Pakistan
zoogeography of pakistan.pptx fauna of Pakistanzohaibmir069
 
Speech, hearing, noise, intelligibility.pptx
Speech, hearing, noise, intelligibility.pptxSpeech, hearing, noise, intelligibility.pptx
Speech, hearing, noise, intelligibility.pptxpriyankatabhane
 
BIOETHICS IN RECOMBINANT DNA TECHNOLOGY.
BIOETHICS IN RECOMBINANT DNA TECHNOLOGY.BIOETHICS IN RECOMBINANT DNA TECHNOLOGY.
BIOETHICS IN RECOMBINANT DNA TECHNOLOGY.PraveenaKalaiselvan1
 
Pests of castor_Binomics_Identification_Dr.UPR.pdf
Pests of castor_Binomics_Identification_Dr.UPR.pdfPests of castor_Binomics_Identification_Dr.UPR.pdf
Pests of castor_Binomics_Identification_Dr.UPR.pdfPirithiRaju
 
Pests of soyabean_Binomics_IdentificationDr.UPR.pdf
Pests of soyabean_Binomics_IdentificationDr.UPR.pdfPests of soyabean_Binomics_IdentificationDr.UPR.pdf
Pests of soyabean_Binomics_IdentificationDr.UPR.pdfPirithiRaju
 
LIGHT-PHENOMENA-BY-CABUALDIONALDOPANOGANCADIENTE-CONDEZA (1).pptx
LIGHT-PHENOMENA-BY-CABUALDIONALDOPANOGANCADIENTE-CONDEZA (1).pptxLIGHT-PHENOMENA-BY-CABUALDIONALDOPANOGANCADIENTE-CONDEZA (1).pptx
LIGHT-PHENOMENA-BY-CABUALDIONALDOPANOGANCADIENTE-CONDEZA (1).pptxmalonesandreagweneth
 
‏‏VIRUS - 123455555555555555555555555555555555555555
‏‏VIRUS -  123455555555555555555555555555555555555555‏‏VIRUS -  123455555555555555555555555555555555555555
‏‏VIRUS - 123455555555555555555555555555555555555555kikilily0909
 
Scheme-of-Work-Science-Stage-4 cambridge science.docx
Scheme-of-Work-Science-Stage-4 cambridge science.docxScheme-of-Work-Science-Stage-4 cambridge science.docx
Scheme-of-Work-Science-Stage-4 cambridge science.docxyaramohamed343013
 

Recently uploaded (20)

RESPIRATORY ADAPTATIONS TO HYPOXIA IN HUMNAS.pptx
RESPIRATORY ADAPTATIONS TO HYPOXIA IN HUMNAS.pptxRESPIRATORY ADAPTATIONS TO HYPOXIA IN HUMNAS.pptx
RESPIRATORY ADAPTATIONS TO HYPOXIA IN HUMNAS.pptx
 
GenBio2 - Lesson 1 - Introduction to Genetics.pptx
GenBio2 - Lesson 1 - Introduction to Genetics.pptxGenBio2 - Lesson 1 - Introduction to Genetics.pptx
GenBio2 - Lesson 1 - Introduction to Genetics.pptx
 
Volatile Oils Pharmacognosy And Phytochemistry -I
Volatile Oils Pharmacognosy And Phytochemistry -IVolatile Oils Pharmacognosy And Phytochemistry -I
Volatile Oils Pharmacognosy And Phytochemistry -I
 
Harmful and Useful Microorganisms Presentation
Harmful and Useful Microorganisms PresentationHarmful and Useful Microorganisms Presentation
Harmful and Useful Microorganisms Presentation
 
Twin's paradox experiment is a meassurement of the extra dimensions.pptx
Twin's paradox experiment is a meassurement of the extra dimensions.pptxTwin's paradox experiment is a meassurement of the extra dimensions.pptx
Twin's paradox experiment is a meassurement of the extra dimensions.pptx
 
Vision and reflection on Mining Software Repositories research in 2024
Vision and reflection on Mining Software Repositories research in 2024Vision and reflection on Mining Software Repositories research in 2024
Vision and reflection on Mining Software Repositories research in 2024
 
BREEDING FOR RESISTANCE TO BIOTIC STRESS.pptx
BREEDING FOR RESISTANCE TO BIOTIC STRESS.pptxBREEDING FOR RESISTANCE TO BIOTIC STRESS.pptx
BREEDING FOR RESISTANCE TO BIOTIC STRESS.pptx
 
Neurodevelopmental disorders according to the dsm 5 tr
Neurodevelopmental disorders according to the dsm 5 trNeurodevelopmental disorders according to the dsm 5 tr
Neurodevelopmental disorders according to the dsm 5 tr
 
Behavioral Disorder: Schizophrenia & it's Case Study.pdf
Behavioral Disorder: Schizophrenia & it's Case Study.pdfBehavioral Disorder: Schizophrenia & it's Case Study.pdf
Behavioral Disorder: Schizophrenia & it's Case Study.pdf
 
Best Call Girls In Sector 29 Gurgaon❤️8860477959 EscorTs Service In 24/7 Delh...
Best Call Girls In Sector 29 Gurgaon❤️8860477959 EscorTs Service In 24/7 Delh...Best Call Girls In Sector 29 Gurgaon❤️8860477959 EscorTs Service In 24/7 Delh...
Best Call Girls In Sector 29 Gurgaon❤️8860477959 EscorTs Service In 24/7 Delh...
 
The dark energy paradox leads to a new structure of spacetime.pptx
The dark energy paradox leads to a new structure of spacetime.pptxThe dark energy paradox leads to a new structure of spacetime.pptx
The dark energy paradox leads to a new structure of spacetime.pptx
 
TOPIC 8 Temperature and Heat.pdf physics
TOPIC 8 Temperature and Heat.pdf physicsTOPIC 8 Temperature and Heat.pdf physics
TOPIC 8 Temperature and Heat.pdf physics
 
zoogeography of pakistan.pptx fauna of Pakistan
zoogeography of pakistan.pptx fauna of Pakistanzoogeography of pakistan.pptx fauna of Pakistan
zoogeography of pakistan.pptx fauna of Pakistan
 
Speech, hearing, noise, intelligibility.pptx
Speech, hearing, noise, intelligibility.pptxSpeech, hearing, noise, intelligibility.pptx
Speech, hearing, noise, intelligibility.pptx
 
BIOETHICS IN RECOMBINANT DNA TECHNOLOGY.
BIOETHICS IN RECOMBINANT DNA TECHNOLOGY.BIOETHICS IN RECOMBINANT DNA TECHNOLOGY.
BIOETHICS IN RECOMBINANT DNA TECHNOLOGY.
 
Pests of castor_Binomics_Identification_Dr.UPR.pdf
Pests of castor_Binomics_Identification_Dr.UPR.pdfPests of castor_Binomics_Identification_Dr.UPR.pdf
Pests of castor_Binomics_Identification_Dr.UPR.pdf
 
Pests of soyabean_Binomics_IdentificationDr.UPR.pdf
Pests of soyabean_Binomics_IdentificationDr.UPR.pdfPests of soyabean_Binomics_IdentificationDr.UPR.pdf
Pests of soyabean_Binomics_IdentificationDr.UPR.pdf
 
LIGHT-PHENOMENA-BY-CABUALDIONALDOPANOGANCADIENTE-CONDEZA (1).pptx
LIGHT-PHENOMENA-BY-CABUALDIONALDOPANOGANCADIENTE-CONDEZA (1).pptxLIGHT-PHENOMENA-BY-CABUALDIONALDOPANOGANCADIENTE-CONDEZA (1).pptx
LIGHT-PHENOMENA-BY-CABUALDIONALDOPANOGANCADIENTE-CONDEZA (1).pptx
 
‏‏VIRUS - 123455555555555555555555555555555555555555
‏‏VIRUS -  123455555555555555555555555555555555555555‏‏VIRUS -  123455555555555555555555555555555555555555
‏‏VIRUS - 123455555555555555555555555555555555555555
 
Scheme-of-Work-Science-Stage-4 cambridge science.docx
Scheme-of-Work-Science-Stage-4 cambridge science.docxScheme-of-Work-Science-Stage-4 cambridge science.docx
Scheme-of-Work-Science-Stage-4 cambridge science.docx
 

Structur Alanalysis

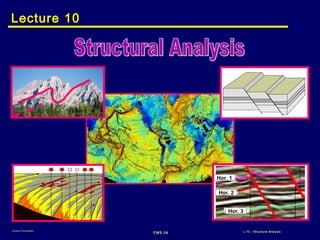
  • 1. FWS 04 L 10 – Structural AnalysisCourtesy of ExxonMobil Lecture 10Lecture 10 Hor. 2 Hor. 1 Hor. 3
  • 2. FWS 04 L 10 – Structural AnalysisCourtesy of ExxonMobil Structural Analysis - What is it? The analysis of all of the significant processes that formed a basin and deformed its sedimentary fill from basin-scale processes (e.g., plate tectonics) to centimeter-scale processes (e.g., fracturing) Some Major Elements: • Basin Formation • Fault Network Mapping • Stratigraphic Deformation • Present-Day Trap Definition • Timing of Trap Development
  • 3. FWS 04 Steps of Seismic Data Interpretation • Picking of time and depth. • Generation of synthetic seismogram. • Marking targeted horizon. • Identification of faults. • Generating grids. • Generation of time structure maps. • Generation of depth contour maps. • Analyzing results and conclusions. L 10 – Structural AnalysisCourtesy of ExxonMobil
  • 4. FWS 04 L 10 – Structural AnalysisCourtesy of ExxonMobil Role of Seismic Interpretation • Identify and map faults, folds, uplifts, and other structural elements • Interpret structural settings and structural styles • Insure 3D geometric consistency in an interpretation - is it structurally valid? • Determine timing relationships, especially the timing of trap formation • Check if the interpretation is admissibility
  • 5. FWS 04 L 5 – Seismic MethodCourtesy of ExxonMobil Seismic Interpretation Determine the local geology from the subsurface images • Map faults and other structural features • Map unconformities and other major stratal surfaces • Interpret depositional environments • Infer lithofacies from reflection patterns & velocities • Predict ages of stratal units • Examine elements of the HC systems Mitchum et al., 1977 AAPG©1977 reprinted with permission of the AAPG whose permission is required for further use.
  • 6. FWS 04 L 10 – Structural AnalysisCourtesy of ExxonMobil A Caution about Seismic Images Most seismic data is displayed in 2- way TIME, which can distort geometric relationships Watch the vertical exaggeration It changes with depth V:H is 1:1 At 2500 m/s V:H is 0.9:1 At 3000 m/s 1 km V:H is 0.8:1 At 3500 m/s V:H is 1.3:1 At 1900 m/s
  • 7. FWS 04 L 10 – Structural AnalysisCourtesy of ExxonMobil The WEAKNESSES of Seismic Data • Limited resolution: can’t resolve “small” features • Steep dips can be difficult to image • Acquisition can be difficult, e. g. in areas of: variable topography, variable surface geology, or “hard” water bottom • Vertical axis is typically (migrated) time, not depth – Velocity variations distort geometries • Display scales are commonly not V:H=1:1, which results in distortions of geometries • Typically we can’t “see” hydrocarbons
  • 8. FWS 04 L 10 – Structural AnalysisCourtesy of ExxonMobil Basic Observations: Profile View We can recognize moderate- to large-scale faults on seismic profiles by: • Termination of reflections • Offset in stratigraphic markers • Abrupt changes in dip • Abrupt changes in seismic patterns • Fault plane reflections • Associated folding or sag • Discontinuities
  • 9. FWS 04 Seismic Section L 10 – Structural AnalysisCourtesy of ExxonMobil
  • 10. FWS 04 Synthethic Seismogram L 10 – Structural AnalysisCourtesy of ExxonMobil
  • 11. FWS 04 L 10 – Structural AnalysisCourtesy of ExxonMobil
  • 12. FWS 04 L 10 – Structural AnalysisCourtesy of ExxonMobil Fault Identification: Time Slice View 1856 ms Do you see evidence for faults?Do you see evidence for faults?
  • 13. FWS 04 L 10 – Structural AnalysisCourtesy of ExxonMobil Fault Identification: Profile Views A B C tie W EN S A B C Faults must tie on lines that intersect or the interpretation is not internally consistent
  • 14. FWS 04 Time Contour Map L 10 – Structural AnalysisCourtesy of ExxonMobil
  • 15. FWS 04 L 10 – Structural AnalysisCourtesy of ExxonMobil
  • 16. FWS 04 Depth Contour Map L 10 – Structural AnalysisCourtesy of ExxonMobil
  • 17. FWS 04 L 10 – Structural AnalysisCourtesy of ExxonMobil
  • 18. FWS 04 Isopach Map L 10 – Structural AnalysisCourtesy of ExxonMobil
  • 19. FWS 04 L 10 – Structural AnalysisCourtesy of ExxonMobil

Editor's Notes

  1. SLIDE 1 This slide introduces module 10 on Structural Interpretation
  2. SLIDE 2 What is structural analysis? Ideally, it is the analysis of all of the significant processes that formed a basin and deformed its sedimentary fill from basin-scale processes (e.g., plate tectonics) to centimeter-scale processes (e.g., fracturing) Typically, what we focus on is : How did the basin form? Mapping the major fault systems Looking at sediment deformation for potential traps Identifying present-day traps and things that may control their fill level (trap size) In some cases, we may need to work out when the trap formed & its size history
  3. SLIDE 3 What type of things can we get from seismic data in terms of structural geology? We can: identify and map faults, folds, uplifts, and other structural elements Interpret structural settings and structural styles Setting = divergent, convergent, etc. More on styles in a few minutes Insure 3D geometric consistency in an interpretation - is it structurally valid? This will be the focus of the first exercise Determine timing relationships, especially the timing of trap formation Especially important if HC migration occurred about the same time as the trap formed Check if the interpretation is admissibility – have we violated any laws of nature
  4. SLIDE 21 After seismic acquisition and processing, we have seismic interpretation Here is where we take the images and deduce the subsurface geology This includes: Map faults and other structural features Map unconformities and other major stratal surfaces Interpret depositional environments Infer lithofacies from reflection patterns & velocities Predict ages of stratal units Examine elements of the HC systems
  5. SLIDE 4 A caution about seismic data Here is a seismic profile from the area you will work in exercise 1 Most (~95%) seismic data has a vertical scale of two-way travel time This is the basic unit of measure – how long did it take for the acoustic wave to travel down and be reflected up to the detector Since velocity is not constant – but overall increases with depth The time scale is not linear with depth A 10 ms interval at a shallow depth corresponds to less thickness than a 10 ms interval at a great depth Thus the vertical-to-horizontal ratio changes with depth – or vertical exaggeration Structural geologists prefer to look at profiles with a V:H ratio of 1:1 At 1:1 a dip in the subsurface of, say, 10 degrees will show as a dip of 10 degrees on the seismic section We can adjust the seismic display – usually we set the zone of interest (main reservoir) to a V:H of 1:1 Deeper the V:H will decrease slowly; shallower it will slowly increase
  6. SLIDE 6 This slide shows the weaknesses of seismic data Seismic data has limited resolution: can’t resolve “small” features – like a horst block 1 km by 1 km Steep dips (> about 35 degrees) can be very difficult to image Acquisition can be difficult, e. g. in areas of: variable topography, variable surface geology, or “hard” water bottom Vertical axis is typically (migrated) time, not depth Velocity variations distort geometries Display scales are commonly not V:H=1:1, which results in distortions of geometries Typically we can’t “see” hydrocarbons
  7. SLIDE 8 What are some of the clues we look for on seismic data to recognize faults? They are listed here: Termination of reflections (point out some) Offset in stratigraphic markers Abrupt changes in dip – NOT on this example Abrupt changes in seismic patterns – e.g. a strong, continuous reflection turns into a low amplitude region Fault plane reflections – ONLY when fault dips less than about 30 degrees Associated folding or sag (some of this above the red fault) Discontinuities – more about this on the NEXT slide
  8. SLIDE 9 Here is a view of some seismic data, offshore LA It is part of a 3D seismic volume It is a MAP view at a time depth of 1.856 seconds two-way time; or 1856 milleseconds (ms) Blue are compressions – what would be black on a B&W section; white = zero amplitudes; red = ‘white’ troughs Can anyone see evidence for 1 or more faults? On the right of the image, a fault is apparent by the offset of the blue & red bands Other faults can be seen towards the south (bottom Some small faults are towards the west – small offsets in the red reflection bands These faults are relatively easy to spot since the ‘bands’ are at a high angle to the fault traces There is a curvilinear fault that starts just NW of center and curves towards the SE This one is hard to see because the ‘bands’ and the fault trace are at low angles (almost parallel) In the early 1980s, people came up with a technique to enhance faults in 3D seismic data Amaco was smart enough to patent their method – which they called Coherency Basically, one trace is compared to its neighboring traces over a small time gate If the traces are perfectly identical in shape – a value of 1.0 is assigned As the similarity of the traces decreases, the assigned values also decreases to 0.95, 0.90, 0.88, etc. More technically, we perform a cross correlation between a reference trace and its neighboring traces The value is the cross-correlation coefficient
  9. SLIDE 12 For both 2D and 3D seismic, we want our fault planes to be consistent in 3D A fault plane in the earth will have one depth point at any given location (latitude, longitude) For our interpretation, this means at any seismic trace our interpreted fault plane should have only 1 two-way time value On this slide, the upper left is a map view of a seismic survey area The seismic is a line intersect with a 90 degree turn A-B runs north to south; B-C runs west to east The red fault is consistently interpreted – consistent does not mean correct necessarily but a correct interpretation must be consistent The fault plane on the two perpendicular lines has the same TWT where the two lines join We say the fault “ties” at this location We would not want to see the fault high on one side and low on the other – a “mistie” The yellow line represents a stratigraphic horizon, down-dropped near the line intersection point (B) FYI, the colors on the map view represent the TWT for the yellow horizon Hot colors are shallow, cool colors are deeper You can see the fault gap for the red fault where A-B and B-C are located (down to the south