Download to read offline
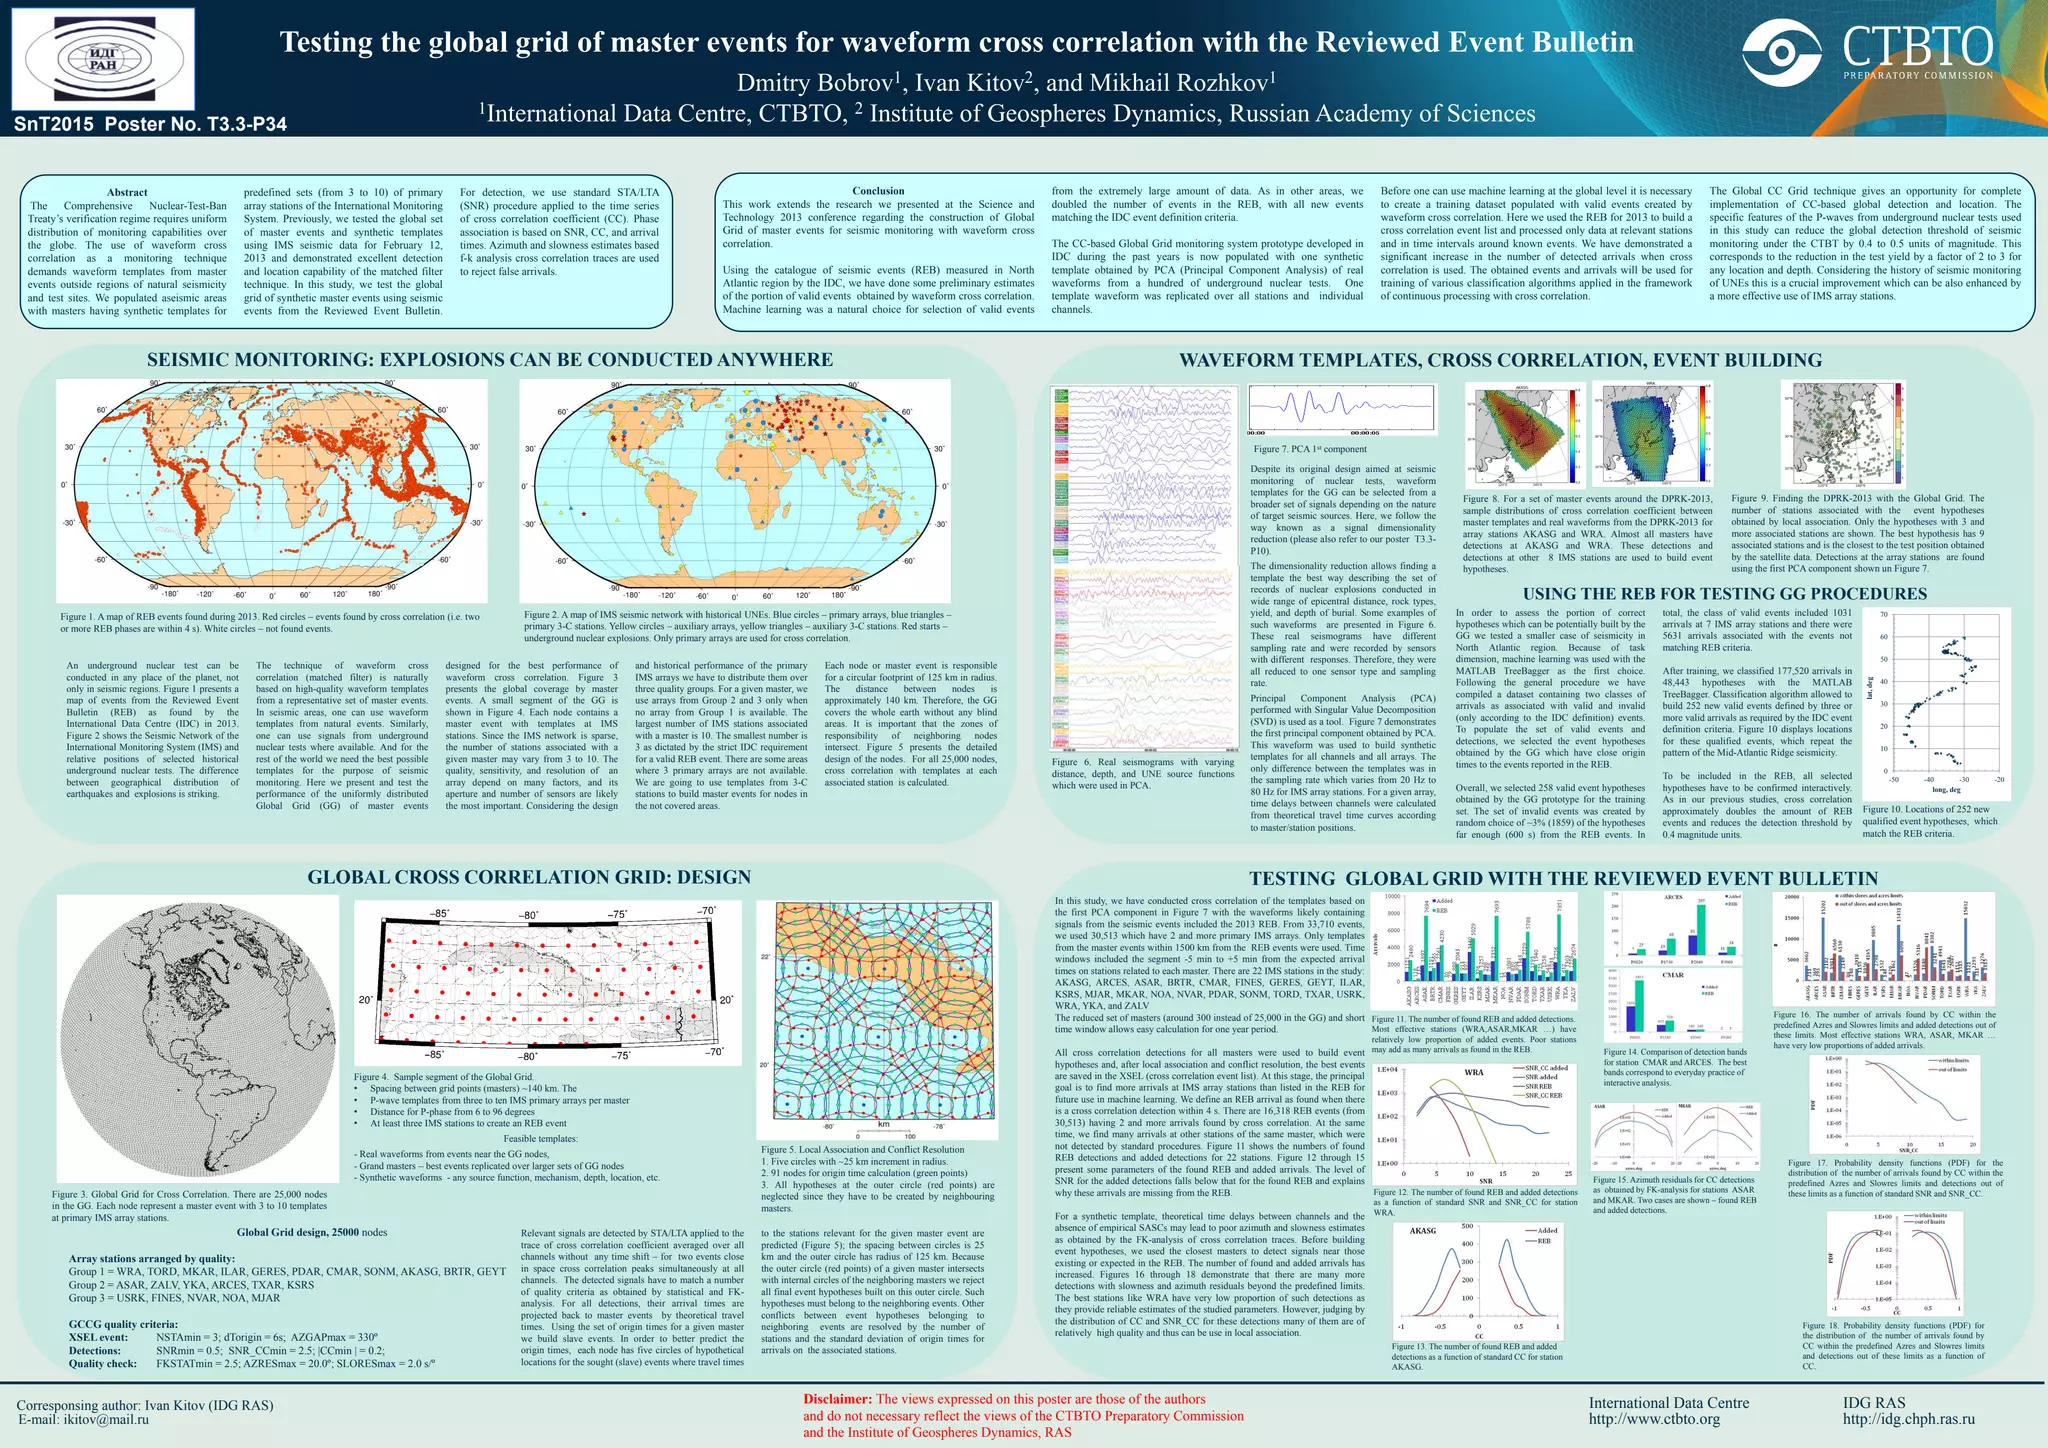

This document presents the testing of a global grid of master events for seismic monitoring through waveform cross-correlation. The study enhances previous research by populating aseismic regions with synthetic templates and demonstrates the efficacy of using machine learning to classify seismic events, ultimately increasing the detection and categorization of events related to nuclear tests. The technique is designed to improve detection thresholds and reduce false alarms, showcasing significant advancements in global seismic monitoring capabilities.