Metallogenic Epoch and Province
Metallogenetic Epochs
Metallogenetic epochs, as defined above, are specific periods characterised by formation of large number of mineral deposits. It does not mean that all the mineral deposits formed during a definite metallogenetic epochs. In India the chief metallogenetic epochs were:
1. Precambrian
2. Late Palaeozoic
3. Late Mesozoic to Early Tertiary
The current ppt discusses the different types of lineations formed due to deformation.
Lineations are genetically related to the foliation planes on which they occur, particularly where both are shaped by mineral orientations. Therefore, the planar and linear fabrics are both together aspects of the same three-dimensional geometry, which is related to the shape of the finite strain ellipsoid or,
more important still, to the history of incremental strains.
Hi I'm Misson Choudhury , A Post Graduate student, Graduated from Utkal university and Now pursuing my m.sc in applied geology at Bangalore university, Bangalore, i love geological mapping,drawing,hill climbing and tracking..
Gravity anomaly across reagional structuresAmit K. Mishra
Gravity Anomaly across continents and ocean, gravity anomaly across mid-oceanic ridges, gravity anomaly across orogenic belts, and gravity anomaly across subduction zones.
Cartography is the science of map making related to geography, mathematics, geodesy, and human habitat, economy and society. Its a discipline developed during the early period of human civilization. With the development of science and technology, it has changed its paradigm twice. Its been digital, more integrated and very useful global media for communication.
Structural measurements in oriented core photograph january 2019_galkineVadim Galkine
n this post I describe the method of structural measurements of planar structures using oriented core digital photographs. The main advantage of the method is an opportunity to reduce field-based time of the drill-core processing. All the measurements can be done in the office.
Users can work either in the standard GIS platforms (ArcMap, MapInfo etc) or even use digitizers outside of GIS environment which makes the technique comparatively cheap.
The method consists of two steps:
1) digitazing photographs and obtaining a table of xy coordinates of the three-point sets of planar structures
2) calculating actual structure orientations using the MSExcel calculation spreadsheets.
The spreadsheets are provided as attachments to the post. They can also be downloaded from http://remoteexploration.com/oriented-core-techniques.html
Map projection is a systematic drawing of parallel of latitudes and meridians of longitude on a plane surface for the whole earth or a part of it on a certain scale so that any point on the earth surface may correspond to that on the drawing.
Maps cannot be created without map projections. All map projections necessarily distort the surface in some fashion.
Depending on the purpose of the map, some distortions are acceptable and others are not; therefore, different map projections exist in order to preserve some properties of the sphere-like body at the expense of other properties.
There is no limit to the number of possible map projections.
A graphic representation of the intersection of the geological bodies in the subsurface with a vertical plane of a certain orientation. It is a section of the terrain where the different types of rocks, their location, age, and composition, and the geometric relationship between them are represented. Which are made on the basis of geologic maps and data from geologic observations, mine works, boreholes, geophysical investigations, and so on.
Preparation of Geologic Sections:
1. Decide what the geologic cross section is going to be used for, and use this to guide you in selecting the appropriate scales.
2. Choose appropriate vertical and horizontal scales.
3. On the map, locate the well or borehole positions, land service elevations, depth of the well and the number of geologic units in each well bore.
4. Transfer the geologic information from each will long to the cross-section. This information represents discrete points of knowledge about the subsurface geology. Part of the geologist skills is interpretation from these discrete points of knowledge to those areas that lie in between. Part of this exercise is determining what units can be lumped together versus those which should be spit apart. Again, this mostly related to the data that is trying to be displayed.
5. Correlate the geologic information between boreholes. Applying knowledge of the specific deposition features of the rock or sediments can be used to increase the accuracy of the model. Look for differences in lithology, texture, or sediment or rock properties as a guide to defining contacts between contiguous geologic units. Use solid lines to indicate reasonably certain relations between discrete data points. Dashed lines are used to indicate uncertainty or inferred data. Areas where does not exist are typically labeled with question marks.
6. Incorporate Legend, Orientation, Title, and Scales to the cross-section. Ensure the units and use the same colour and pattern scheme as on the original geologic map.
Legend – the legend is a key to the patterns used to identify each unit on the cross-section. The units are ordered from oldest formation at the bottom of the legend to youngest unit at the top of the legend.
Orientation – the orientation of the cross-section is the direction that the cross-section line makes on Earth . You can indicate the orientation by writing the corresponding direction at each end of the cross-section (e.g., west and east).
Title – a descriptive title for the cross-section. You can include the letters used to identify the line on the original geological map in the title.
Scale – include a ratio scale and/or a bar scale to show the scale of the cross-section. The vertical and horizontal scales should be the same, so you only need to include one scale on the cross-section.
Strike and Dip Method
To measure and describe the geometry of geological layers, geologists apply the concepts of strike and dip.
•Strike refers to the line formed by the inte
Practical Local Geoid Modelling of Benin City, Nigeria from Gravimetric Obser...IJAEMSJORNAL
The geometric heights obtained from GNSS observations cannot be used for engineering works as they are not reduced to the geoid. This study presents practical local geoid modelling from gravimetric observations using the modified Stokes integral for engineering applications in Benin City. A total of 52 points were observed with GNSS receivers and a gravimeter to respectively obtain their positions and absolute gravity values. The theoretical gravity values of the points were computed on the Clarke 1880 ellipsoid to obtain their local gravity anomalies. The modified Stokes integral was applied to compute the geoid heights of the points. The combined topographic effect was applied to the computed geoid heights of the points to obtain their precise geoid heights. The mean of the precise geoid heights of the points was computed to obtain the local gravimetric geoid model of the study area. The determined geoid model was validated for its reliability as well as the accuracy using the RMSE index. It is recommended that the use of assumed, as well as handheld GPS receiver heights for engineering works should be totally abolished as this study has established the local geoid model of Benin City.
Comparing Evolved Extractive Text Summary Scores of Bidirectional Encoder Rep...University of Maribor
Slides from:
11th International Conference on Electrical, Electronics and Computer Engineering (IcETRAN), Niš, 3-6 June 2024
Track: Artificial Intelligence
https://www.etran.rs/2024/en/home-english/
Deep Behavioral Phenotyping in Systems Neuroscience for Functional Atlasing a...Ana Luísa Pinho
Functional Magnetic Resonance Imaging (fMRI) provides means to characterize brain activations in response to behavior. However, cognitive neuroscience has been limited to group-level effects referring to the performance of specific tasks. To obtain the functional profile of elementary cognitive mechanisms, the combination of brain responses to many tasks is required. Yet, to date, both structural atlases and parcellation-based activations do not fully account for cognitive function and still present several limitations. Further, they do not adapt overall to individual characteristics. In this talk, I will give an account of deep-behavioral phenotyping strategies, namely data-driven methods in large task-fMRI datasets, to optimize functional brain-data collection and improve inference of effects-of-interest related to mental processes. Key to this approach is the employment of fast multi-functional paradigms rich on features that can be well parametrized and, consequently, facilitate the creation of psycho-physiological constructs to be modelled with imaging data. Particular emphasis will be given to music stimuli when studying high-order cognitive mechanisms, due to their ecological nature and quality to enable complex behavior compounded by discrete entities. I will also discuss how deep-behavioral phenotyping and individualized models applied to neuroimaging data can better account for the subject-specific organization of domain-general cognitive systems in the human brain. Finally, the accumulation of functional brain signatures brings the possibility to clarify relationships among tasks and create a univocal link between brain systems and mental functions through: (1) the development of ontologies proposing an organization of cognitive processes; and (2) brain-network taxonomies describing functional specialization. To this end, tools to improve commensurability in cognitive science are necessary, such as public repositories, ontology-based platforms and automated meta-analysis tools. I will thus discuss some brain-atlasing resources currently under development, and their applicability in cognitive as well as clinical neuroscience.
ANAMOLOUS SECONDARY GROWTH IN DICOT ROOTS.pptxRASHMI M G
Abnormal or anomalous secondary growth in plants. It defines secondary growth as an increase in plant girth due to vascular cambium or cork cambium. Anomalous secondary growth does not follow the normal pattern of a single vascular cambium producing xylem internally and phloem externally.
Salas, V. (2024) "John of St. Thomas (Poinsot) on the Science of Sacred Theol...Studia Poinsotiana
I Introduction
II Subalternation and Theology
III Theology and Dogmatic Declarations
IV The Mixed Principles of Theology
V Virtual Revelation: The Unity of Theology
VI Theology as a Natural Science
VII Theology’s Certitude
VIII Conclusion
Notes
Bibliography
All the contents are fully attributable to the author, Doctor Victor Salas. Should you wish to get this text republished, get in touch with the author or the editorial committee of the Studia Poinsotiana. Insofar as possible, we will be happy to broker your contact.
What is greenhouse gasses and how many gasses are there to affect the Earth.moosaasad1975
What are greenhouse gasses how they affect the earth and its environment what is the future of the environment and earth how the weather and the climate effects.
The use of Nauplii and metanauplii artemia in aquaculture (brine shrimp).pptxMAGOTI ERNEST
Although Artemia has been known to man for centuries, its use as a food for the culture of larval organisms apparently began only in the 1930s, when several investigators found that it made an excellent food for newly hatched fish larvae (Litvinenko et al., 2023). As aquaculture developed in the 1960s and ‘70s, the use of Artemia also became more widespread, due both to its convenience and to its nutritional value for larval organisms (Arenas-Pardo et al., 2024). The fact that Artemia dormant cysts can be stored for long periods in cans, and then used as an off-the-shelf food requiring only 24 h of incubation makes them the most convenient, least labor-intensive, live food available for aquaculture (Sorgeloos & Roubach, 2021). The nutritional value of Artemia, especially for marine organisms, is not constant, but varies both geographically and temporally. During the last decade, however, both the causes of Artemia nutritional variability and methods to improve poorquality Artemia have been identified (Loufi et al., 2024).
Brine shrimp (Artemia spp.) are used in marine aquaculture worldwide. Annually, more than 2,000 metric tons of dry cysts are used for cultivation of fish, crustacean, and shellfish larva. Brine shrimp are important to aquaculture because newly hatched brine shrimp nauplii (larvae) provide a food source for many fish fry (Mozanzadeh et al., 2021). Culture and harvesting of brine shrimp eggs represents another aspect of the aquaculture industry. Nauplii and metanauplii of Artemia, commonly known as brine shrimp, play a crucial role in aquaculture due to their nutritional value and suitability as live feed for many aquatic species, particularly in larval stages (Sorgeloos & Roubach, 2021).
Seminar of U.V. Spectroscopy by SAMIR PANDASAMIR PANDA
Spectroscopy is a branch of science dealing the study of interaction of electromagnetic radiation with matter.
Ultraviolet-visible spectroscopy refers to absorption spectroscopy or reflect spectroscopy in the UV-VIS spectral region.
Ultraviolet-visible spectroscopy is an analytical method that can measure the amount of light received by the analyte.
Remote Sensing and Computational, Evolutionary, Supercomputing, and Intellige...University of Maribor
Slides from talk:
Aleš Zamuda: Remote Sensing and Computational, Evolutionary, Supercomputing, and Intelligent Systems.
11th International Conference on Electrical, Electronics and Computer Engineering (IcETRAN), Niš, 3-6 June 2024
Inter-Society Networking Panel GRSS/MTT-S/CIS Panel Session: Promoting Connection and Cooperation
https://www.etran.rs/2024/en/home-english/
Observation of Io’s Resurfacing via Plume Deposition Using Ground-based Adapt...Sérgio Sacani
Since volcanic activity was first discovered on Io from Voyager images in 1979, changes
on Io’s surface have been monitored from both spacecraft and ground-based telescopes.
Here, we present the highest spatial resolution images of Io ever obtained from a groundbased telescope. These images, acquired by the SHARK-VIS instrument on the Large
Binocular Telescope, show evidence of a major resurfacing event on Io’s trailing hemisphere. When compared to the most recent spacecraft images, the SHARK-VIS images
show that a plume deposit from a powerful eruption at Pillan Patera has covered part
of the long-lived Pele plume deposit. Although this type of resurfacing event may be common on Io, few have been detected due to the rarity of spacecraft visits and the previously low spatial resolution available from Earth-based telescopes. The SHARK-VIS instrument ushers in a new era of high resolution imaging of Io’s surface using adaptive
optics at visible wavelengths.
Nutraceutical market, scope and growth: Herbal drug technologyLokesh Patil
As consumer awareness of health and wellness rises, the nutraceutical market—which includes goods like functional meals, drinks, and dietary supplements that provide health advantages beyond basic nutrition—is growing significantly. As healthcare expenses rise, the population ages, and people want natural and preventative health solutions more and more, this industry is increasing quickly. Further driving market expansion are product formulation innovations and the use of cutting-edge technology for customized nutrition. With its worldwide reach, the nutraceutical industry is expected to keep growing and provide significant chances for research and investment in a number of categories, including vitamins, minerals, probiotics, and herbal supplements.
The ability to recreate computational results with minimal effort and actionable metrics provides a solid foundation for scientific research and software development. When people can replicate an analysis at the touch of a button using open-source software, open data, and methods to assess and compare proposals, it significantly eases verification of results, engagement with a diverse range of contributors, and progress. However, we have yet to fully achieve this; there are still many sociotechnical frictions.
Inspired by David Donoho's vision, this talk aims to revisit the three crucial pillars of frictionless reproducibility (data sharing, code sharing, and competitive challenges) with the perspective of deep software variability.
Our observation is that multiple layers — hardware, operating systems, third-party libraries, software versions, input data, compile-time options, and parameters — are subject to variability that exacerbates frictions but is also essential for achieving robust, generalizable results and fostering innovation. I will first review the literature, providing evidence of how the complex variability interactions across these layers affect qualitative and quantitative software properties, thereby complicating the reproduction and replication of scientific studies in various fields.
I will then present some software engineering and AI techniques that can support the strategic exploration of variability spaces. These include the use of abstractions and models (e.g., feature models), sampling strategies (e.g., uniform, random), cost-effective measurements (e.g., incremental build of software configurations), and dimensionality reduction methods (e.g., transfer learning, feature selection, software debloating).
I will finally argue that deep variability is both the problem and solution of frictionless reproducibility, calling the software science community to develop new methods and tools to manage variability and foster reproducibility in software systems.
Exposé invité Journées Nationales du GDR GPL 2024
In silico drugs analogue design: novobiocin analogues.pptx
Stereographic projection
1. DR. HARISINGH GOUR
VISHWAVIDYALAYA SAGAR (M.P.)
(A Central University )
UNDER GUIDENCE OF :-
PROF P.K KATHAL &
DR GAURAV K SINGH
SEMINAR TOPIC : STEREOGRAPHIC PROJECTION
POORVA PANDEY
Y1 9251026
Mtech 1st sem
1
2. CONTENT
Content Page no
1) Introduction of stereographic projection 01 -02
2) Idea about stereonet 03-04
3) Principle of stereographic projection 05 -06
4) construction of stereographic 07- 08
projection on stereonet
5) How to plot a plane 09
6) How to plot a lineation 10
7) how to plot a pole 11
8) How to plot a plunge 12
9) Geometrical represation of planer and linear structure 13
10) About pi and ß diagram 14
11) stereographic projection of folded surface 15
12) some problems related to stereographic projection 16
3. INTRODUCTION
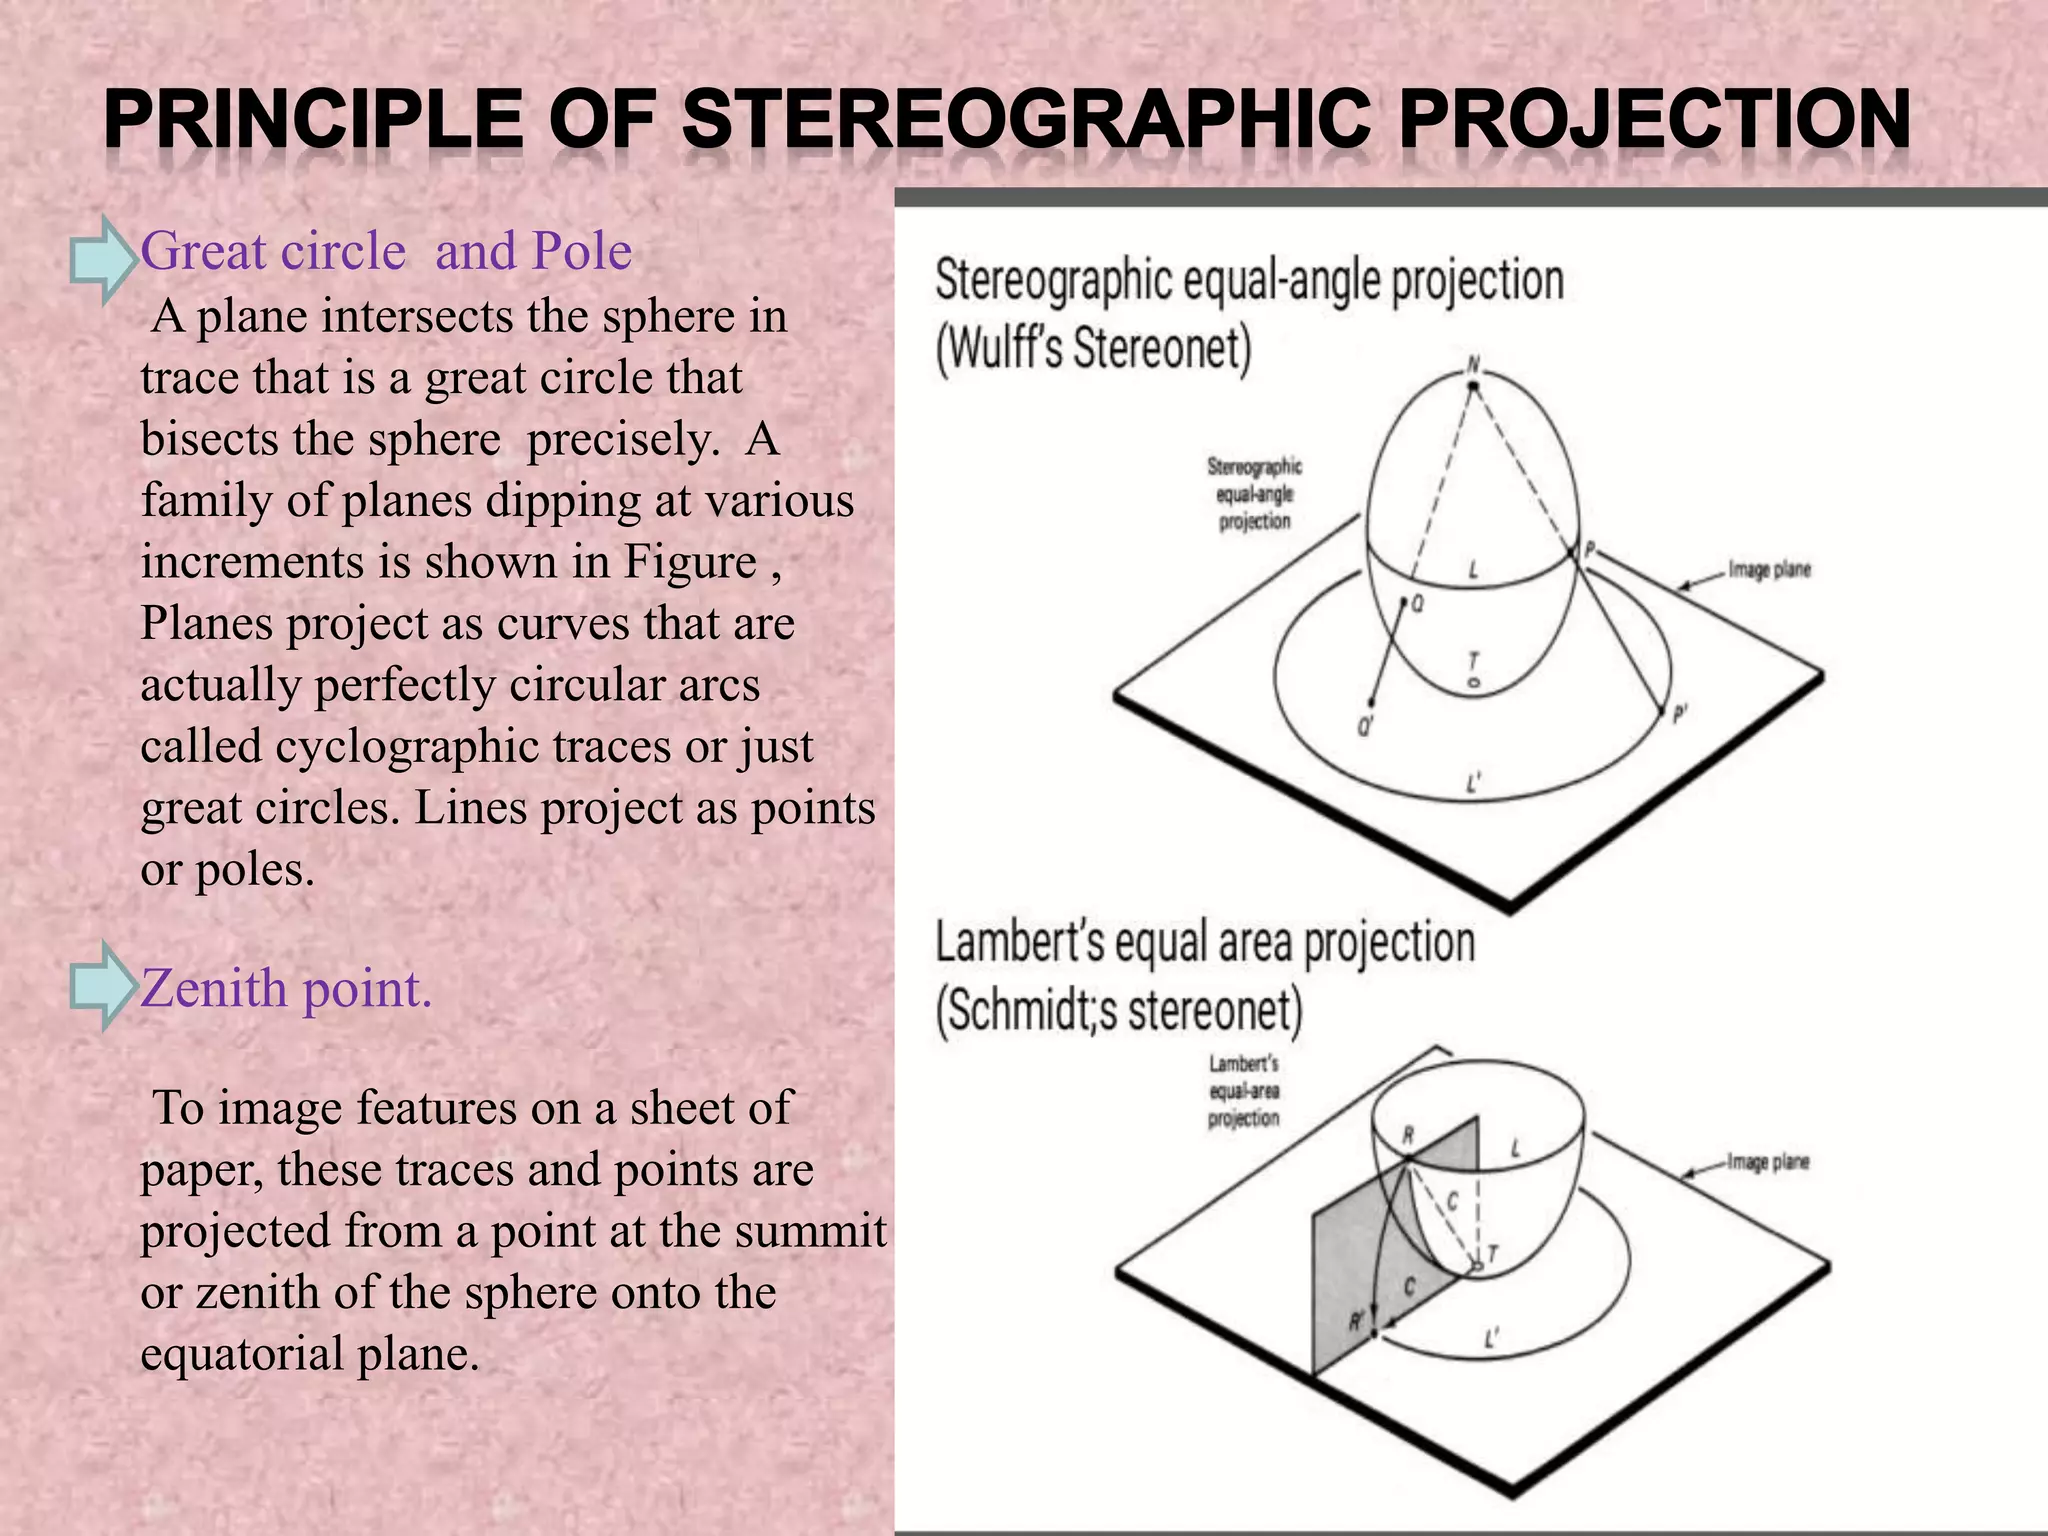
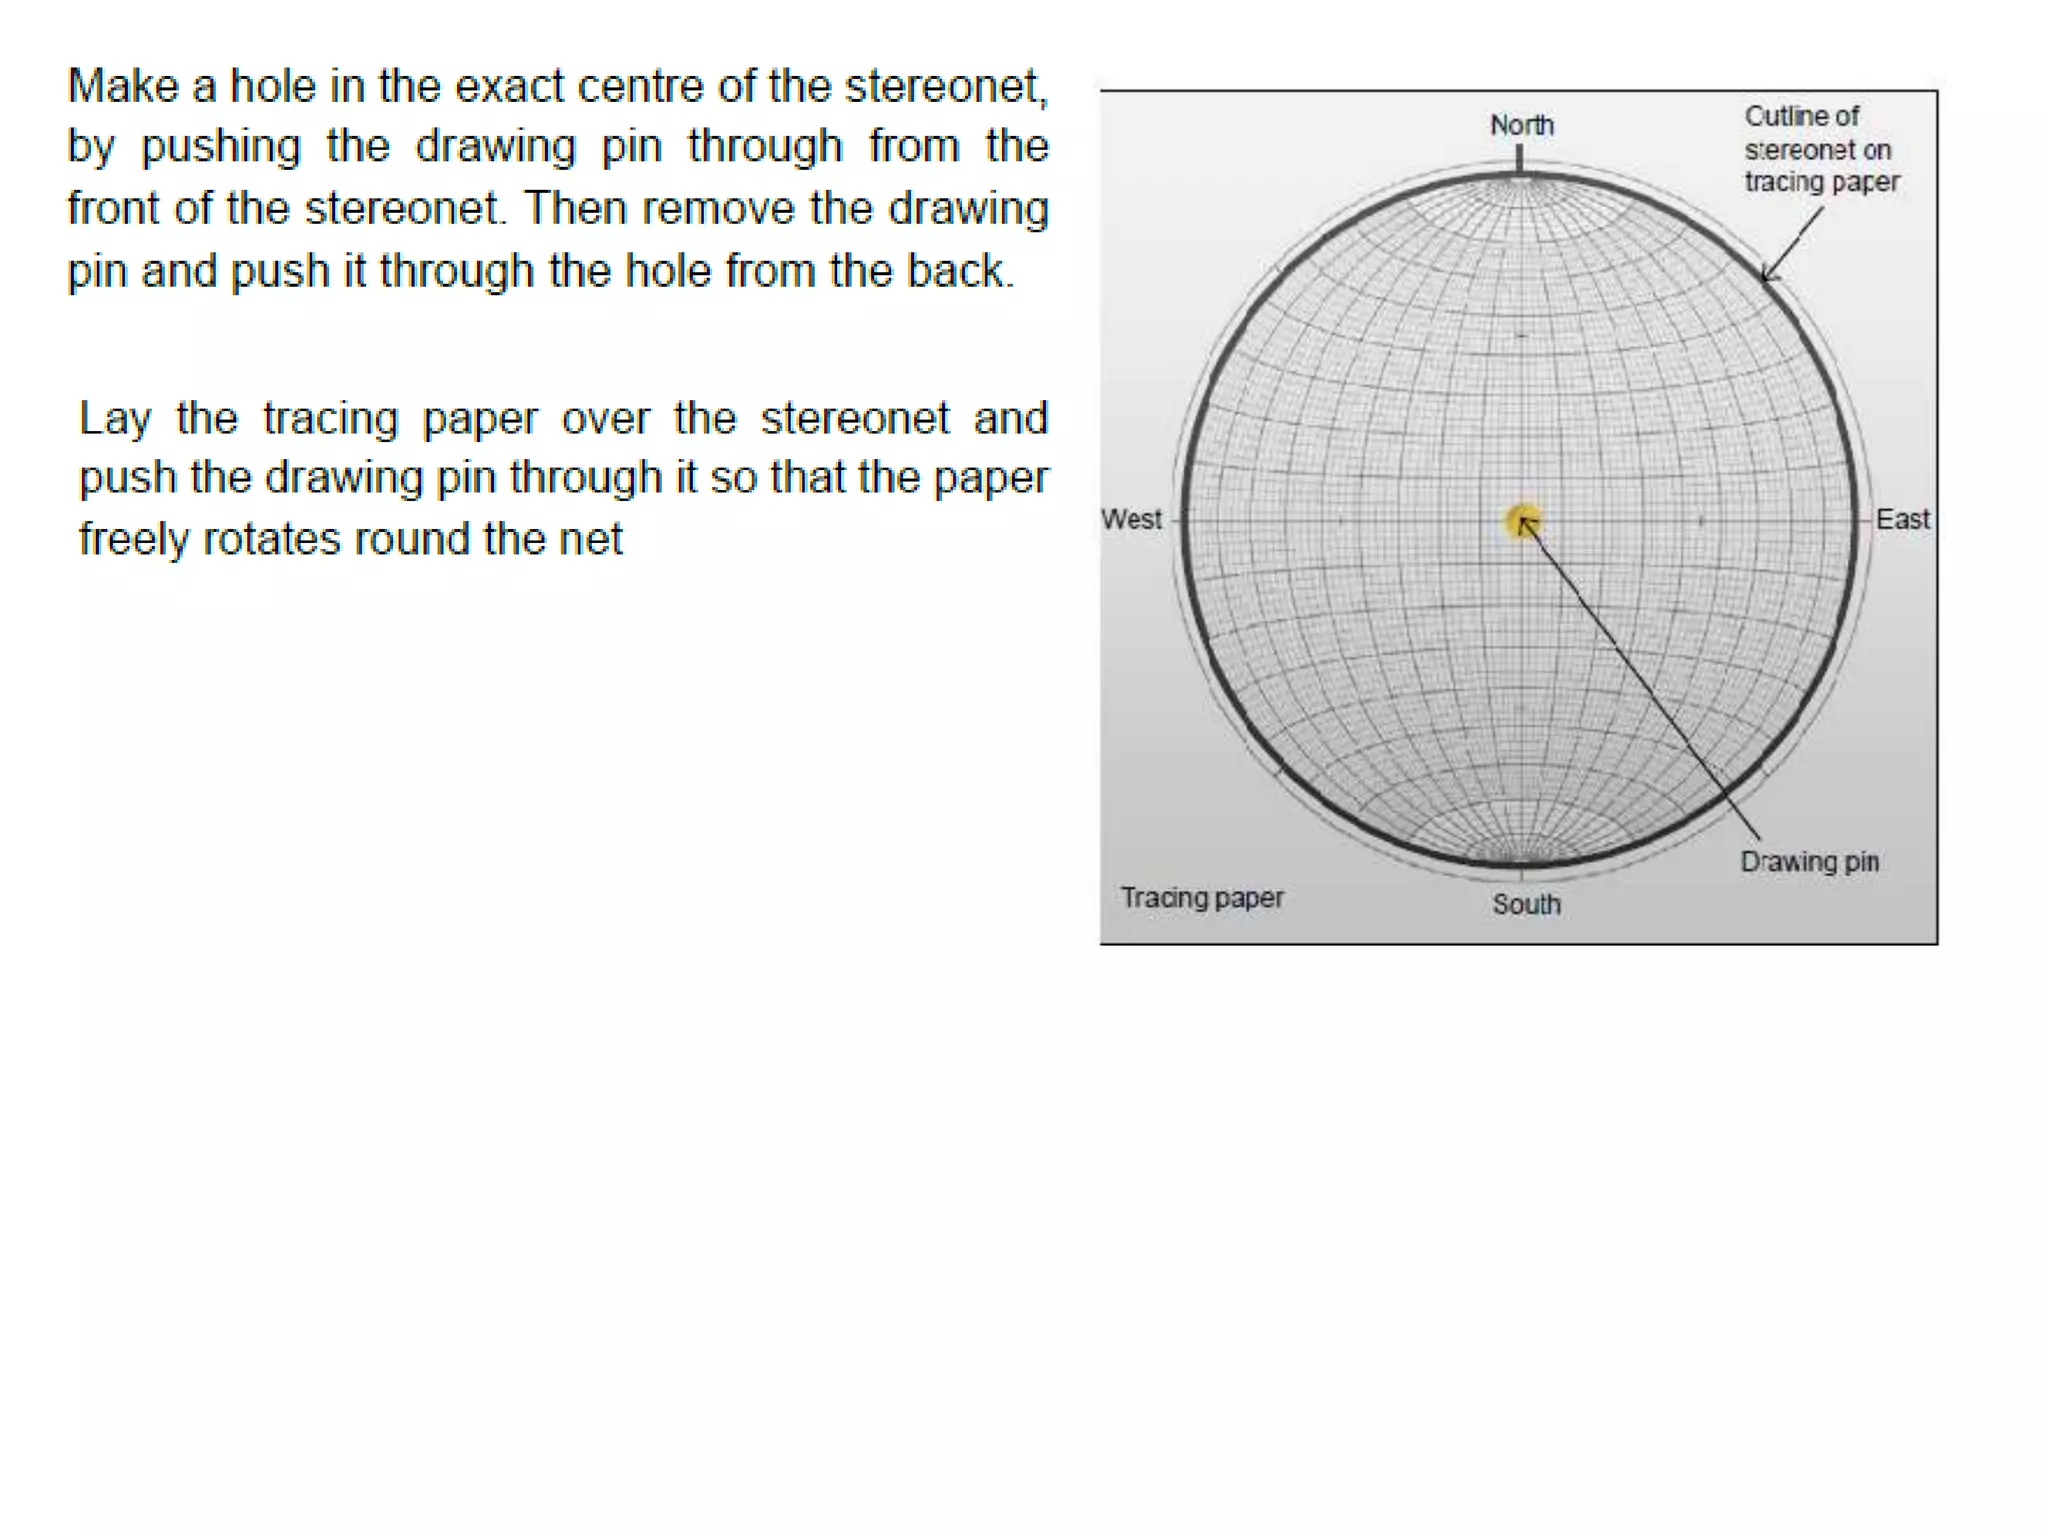
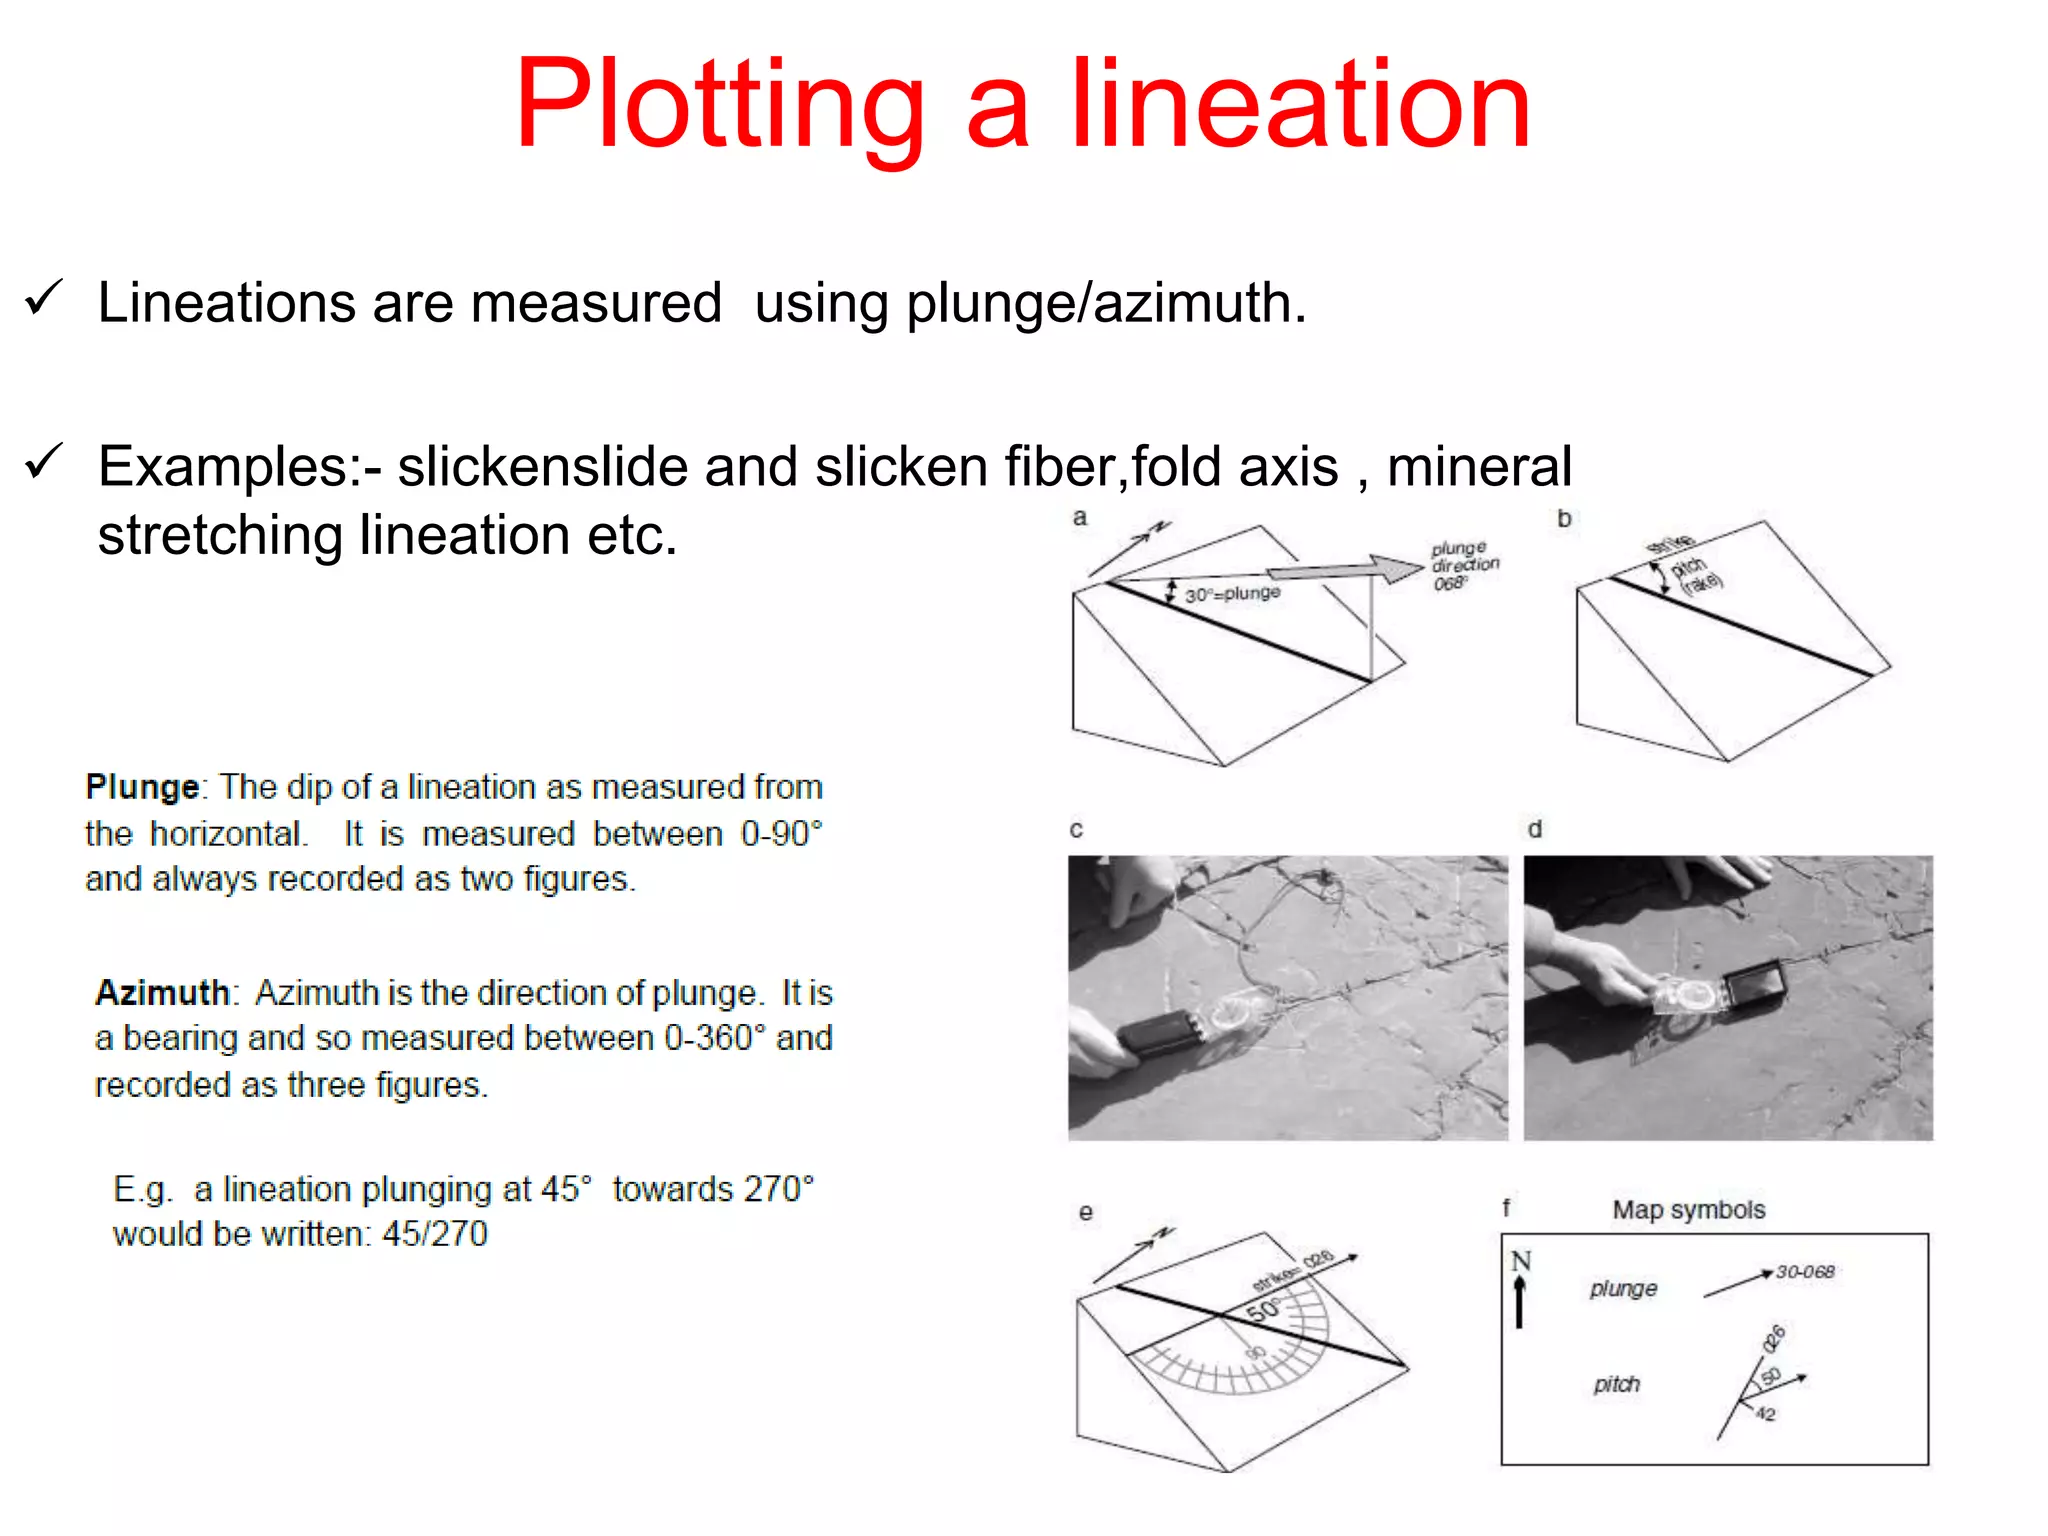
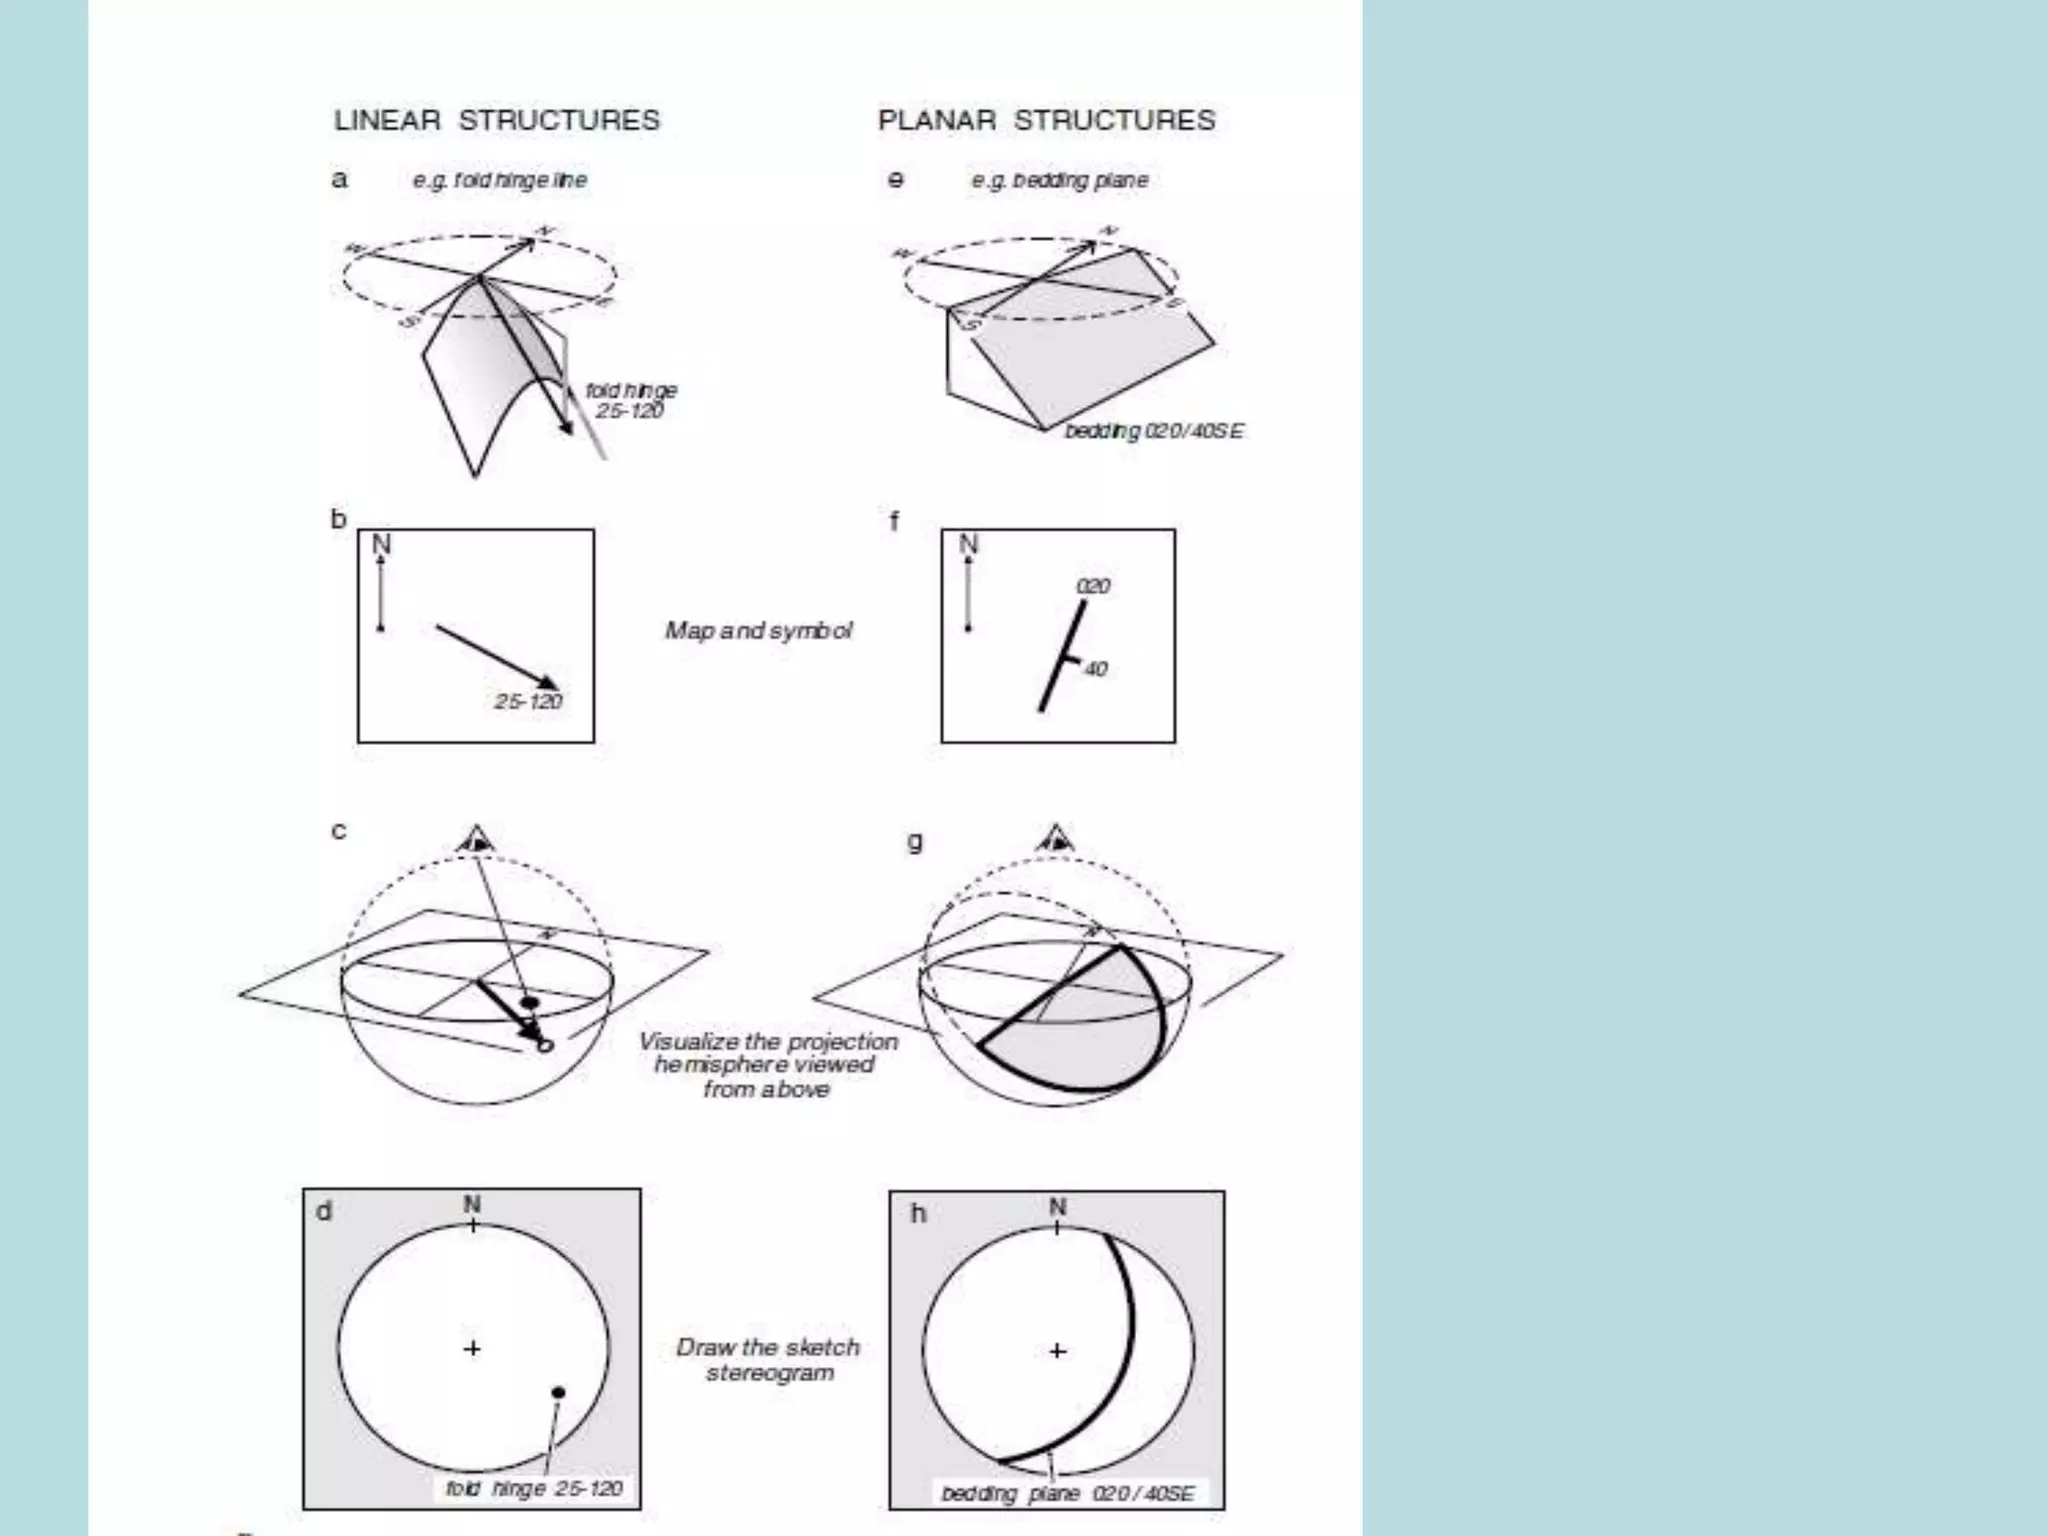
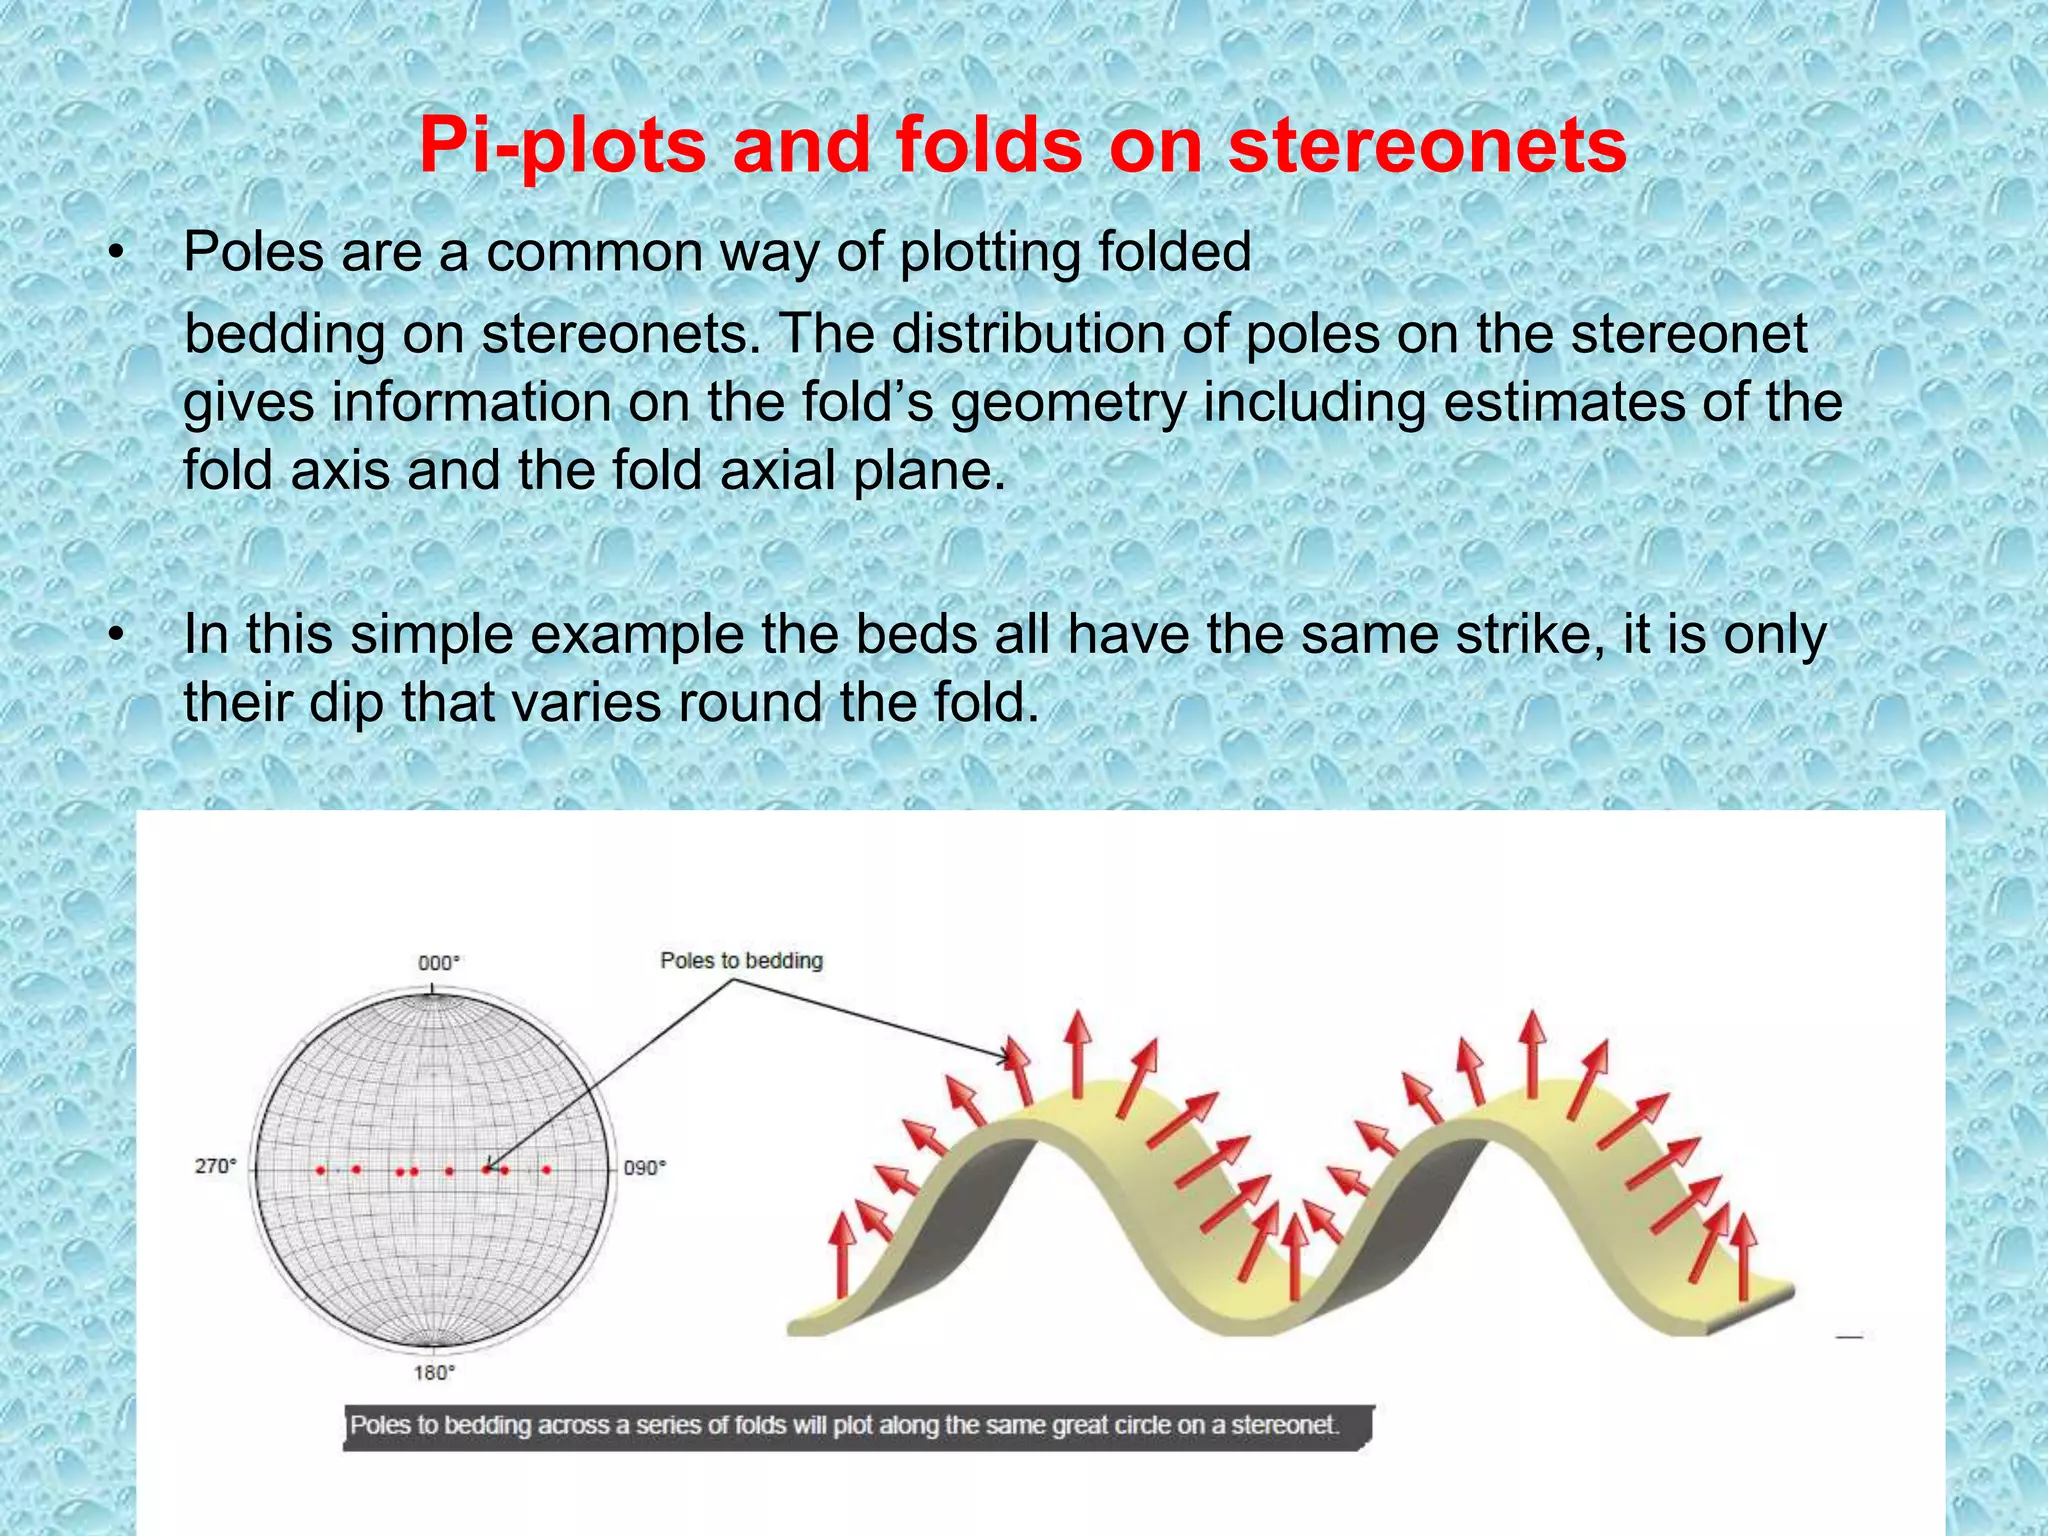
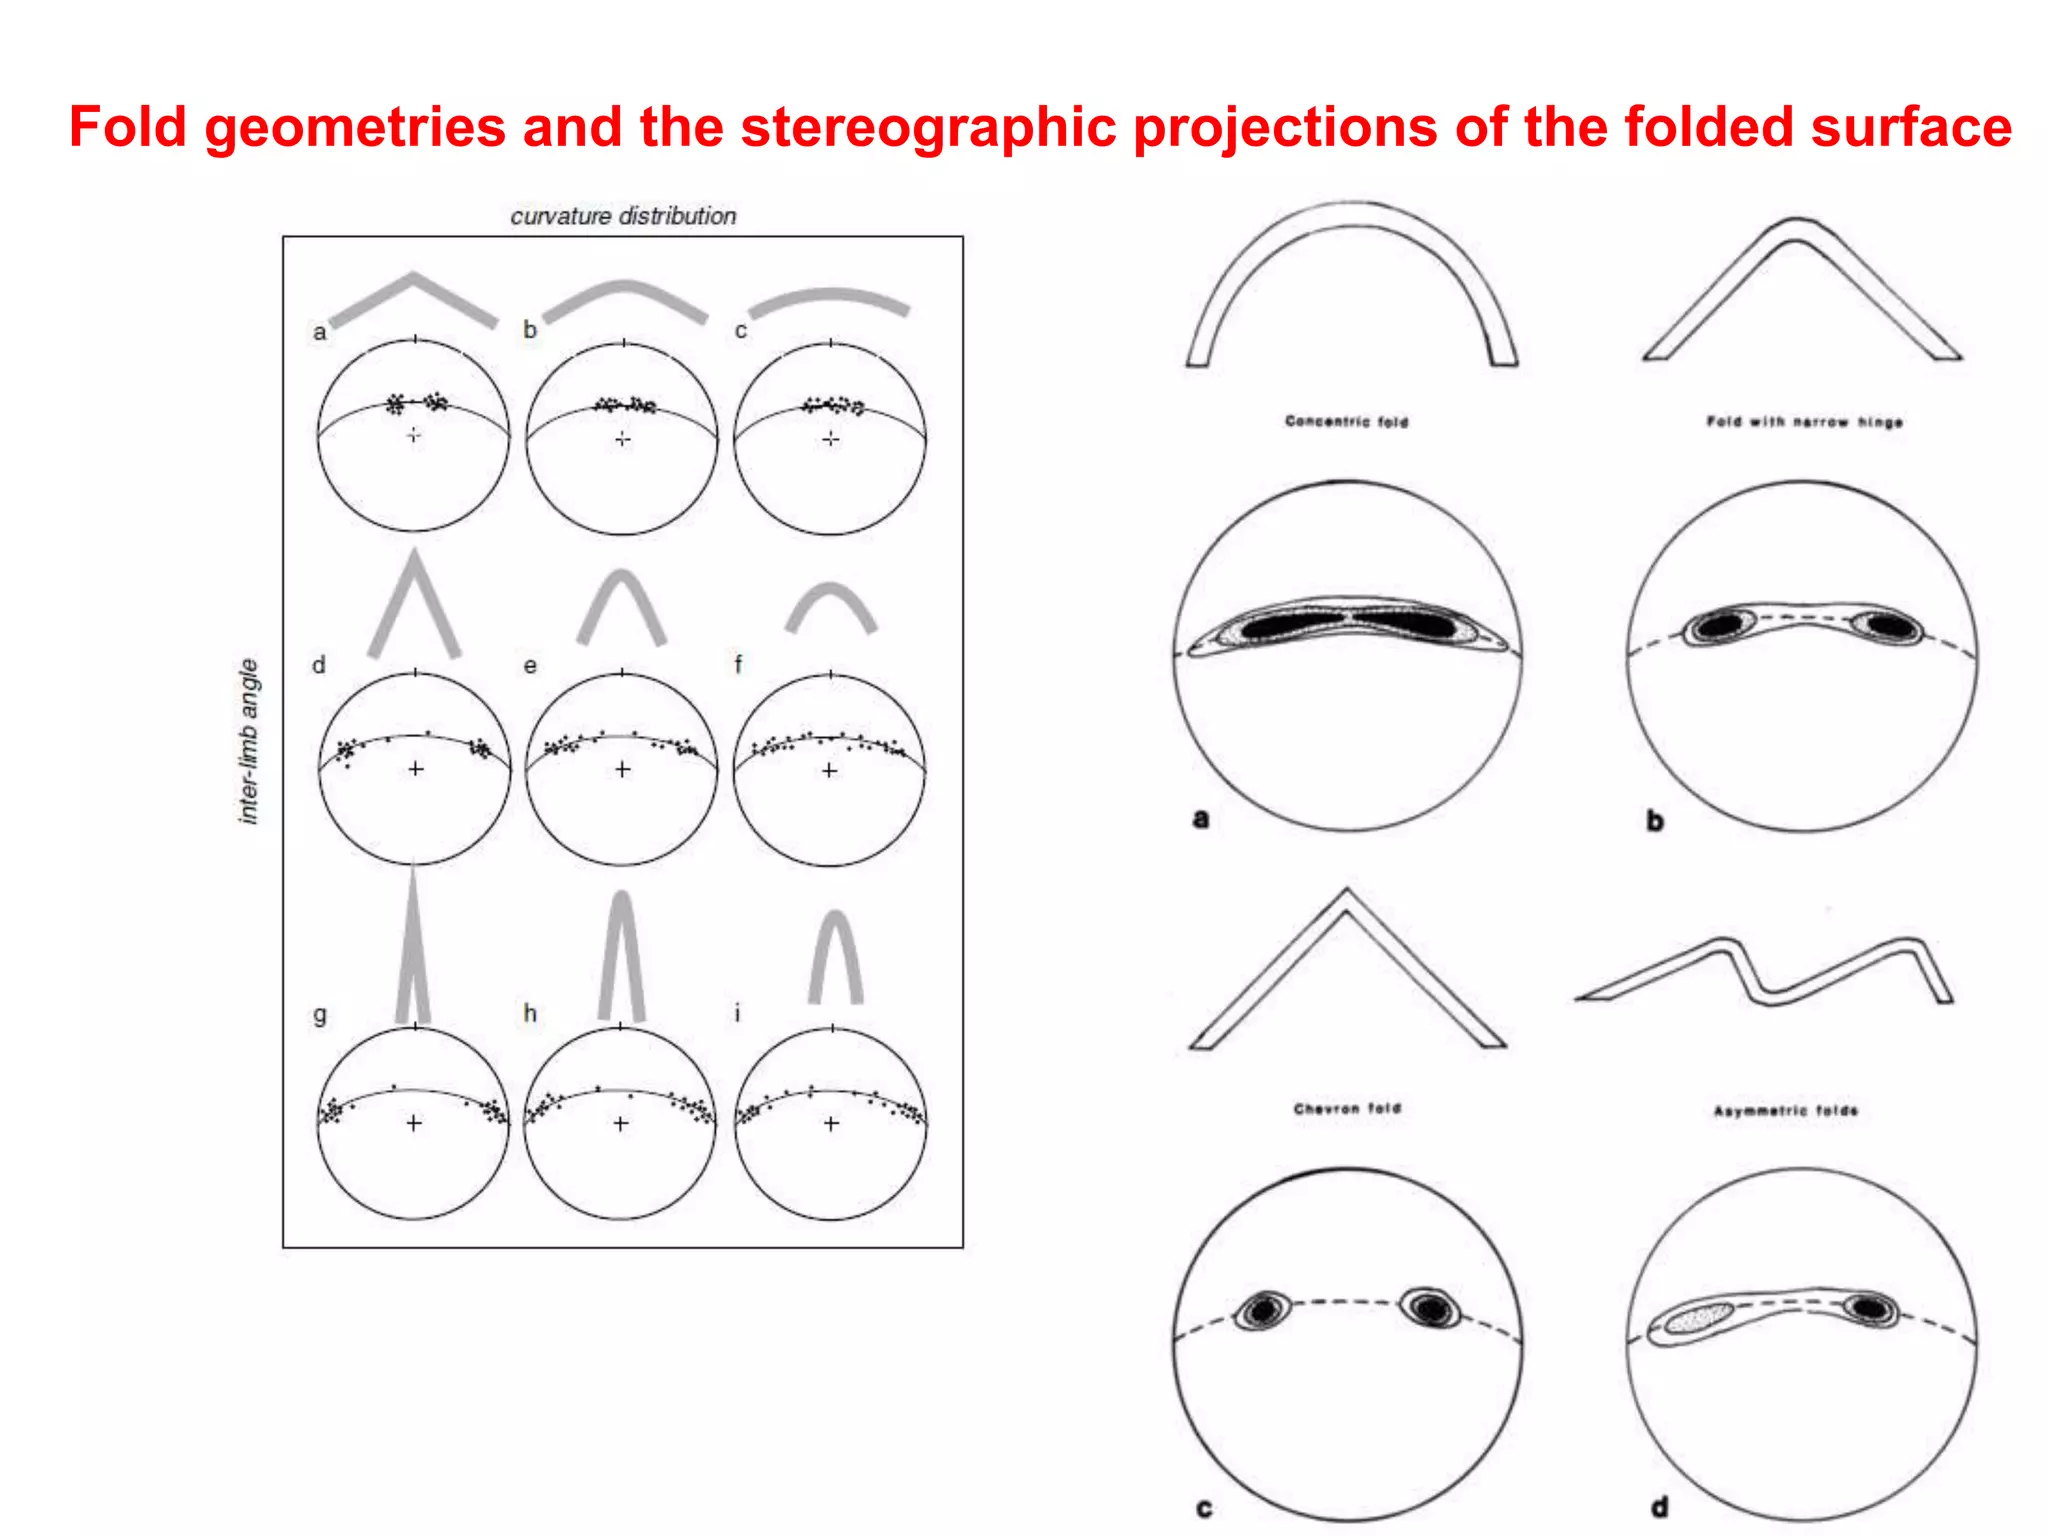
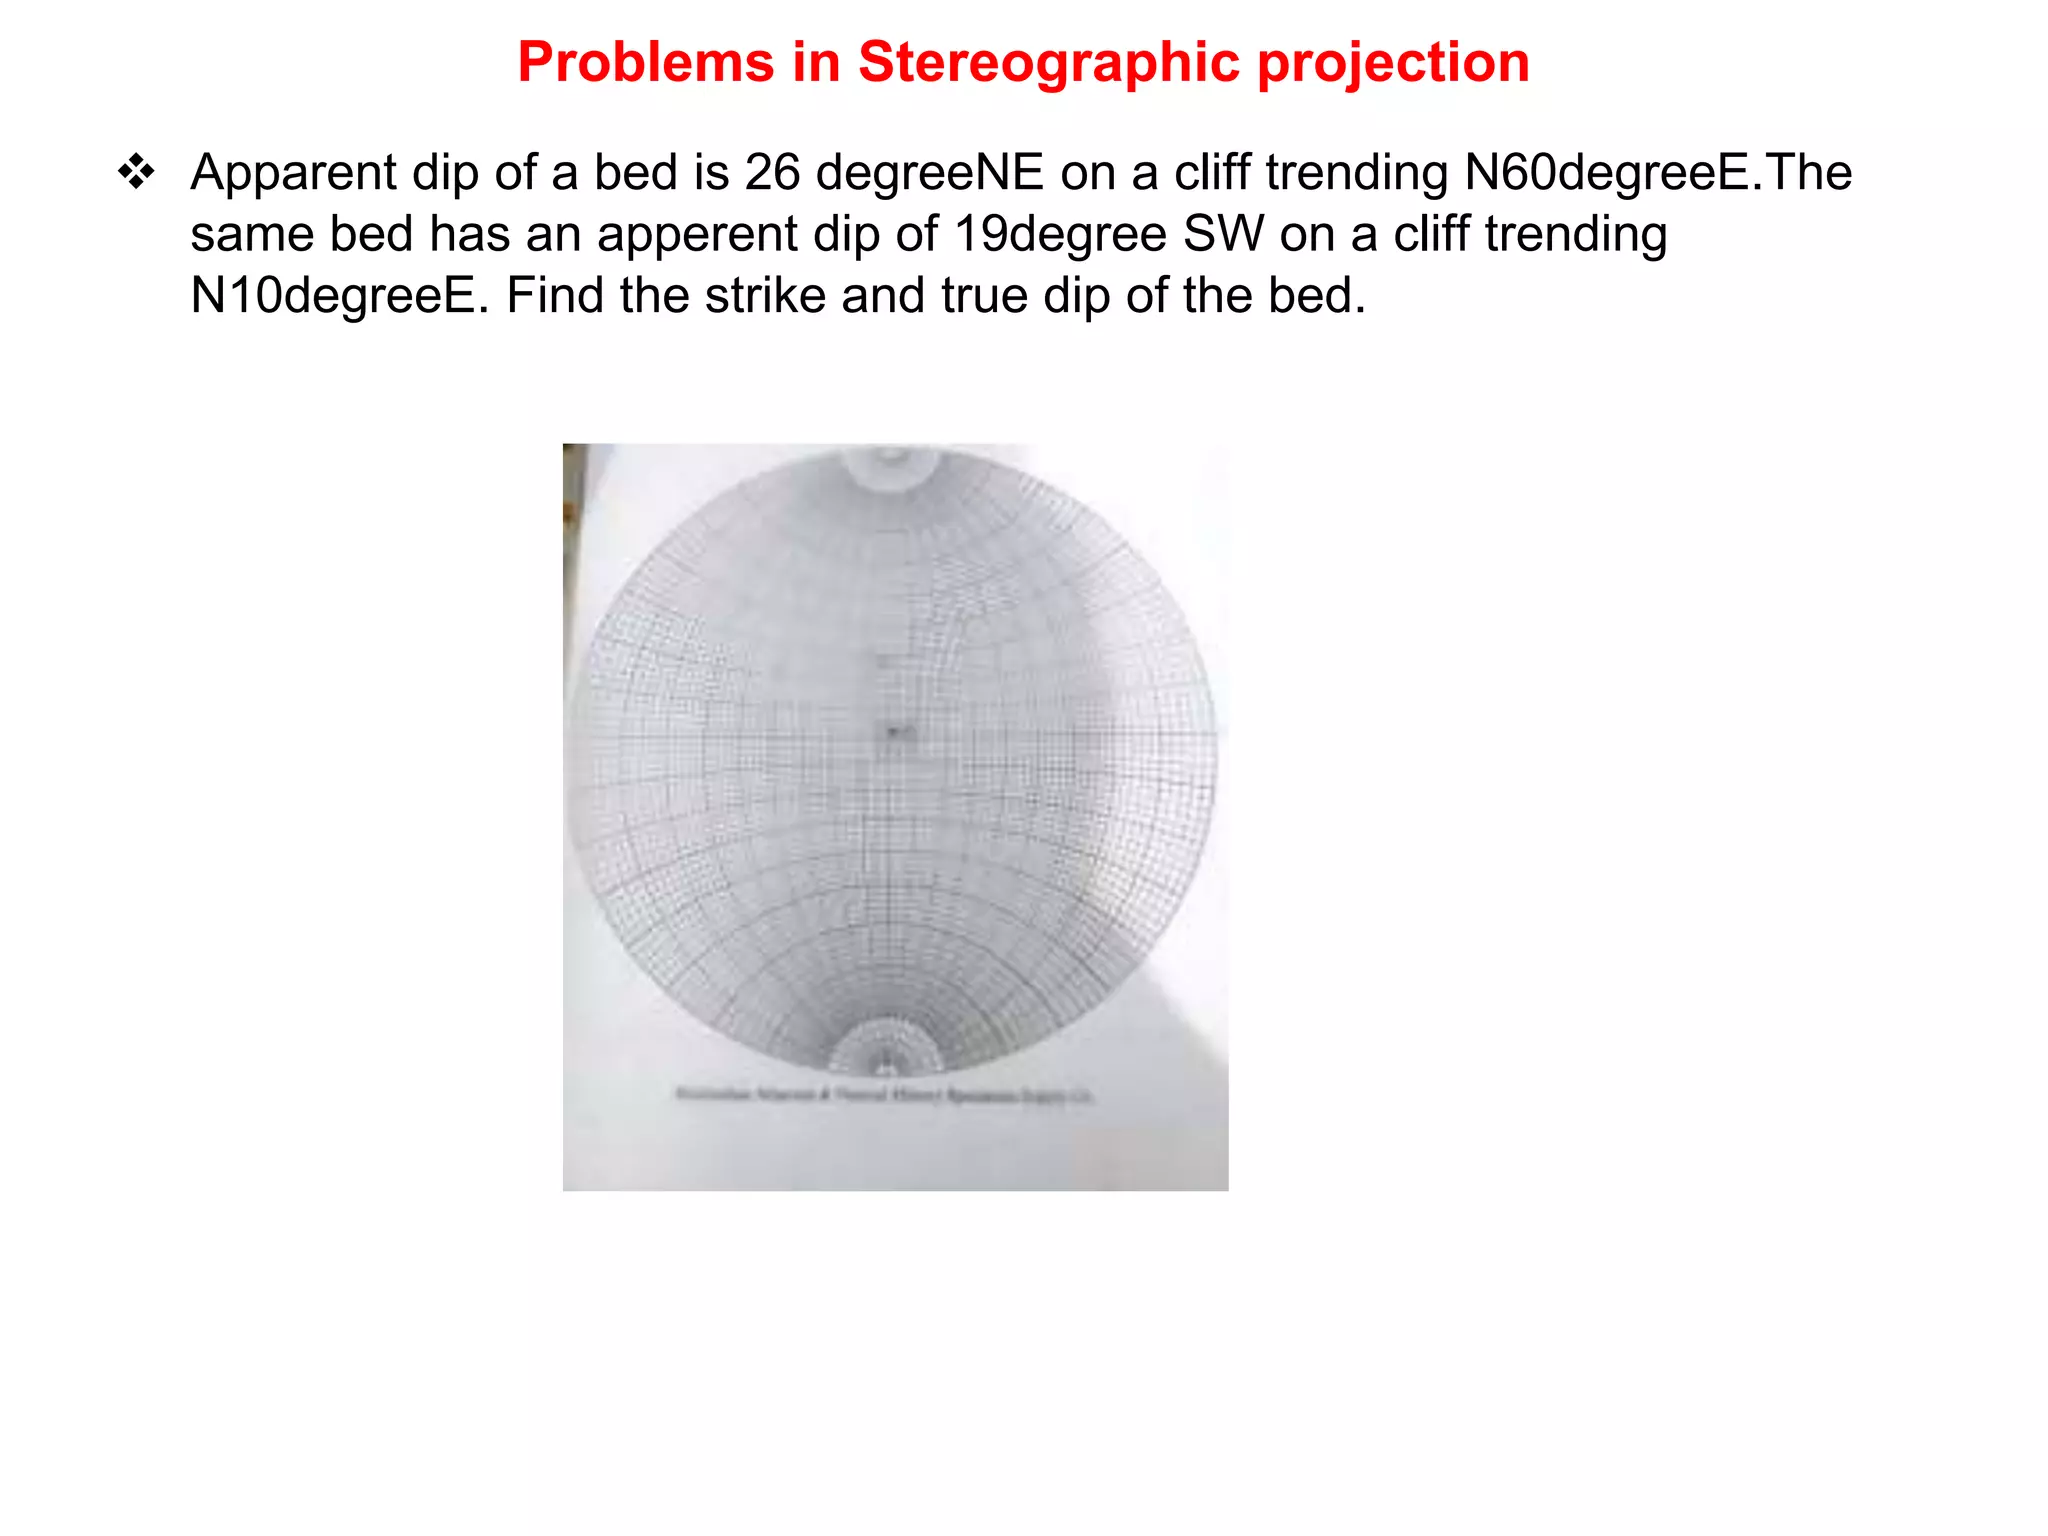
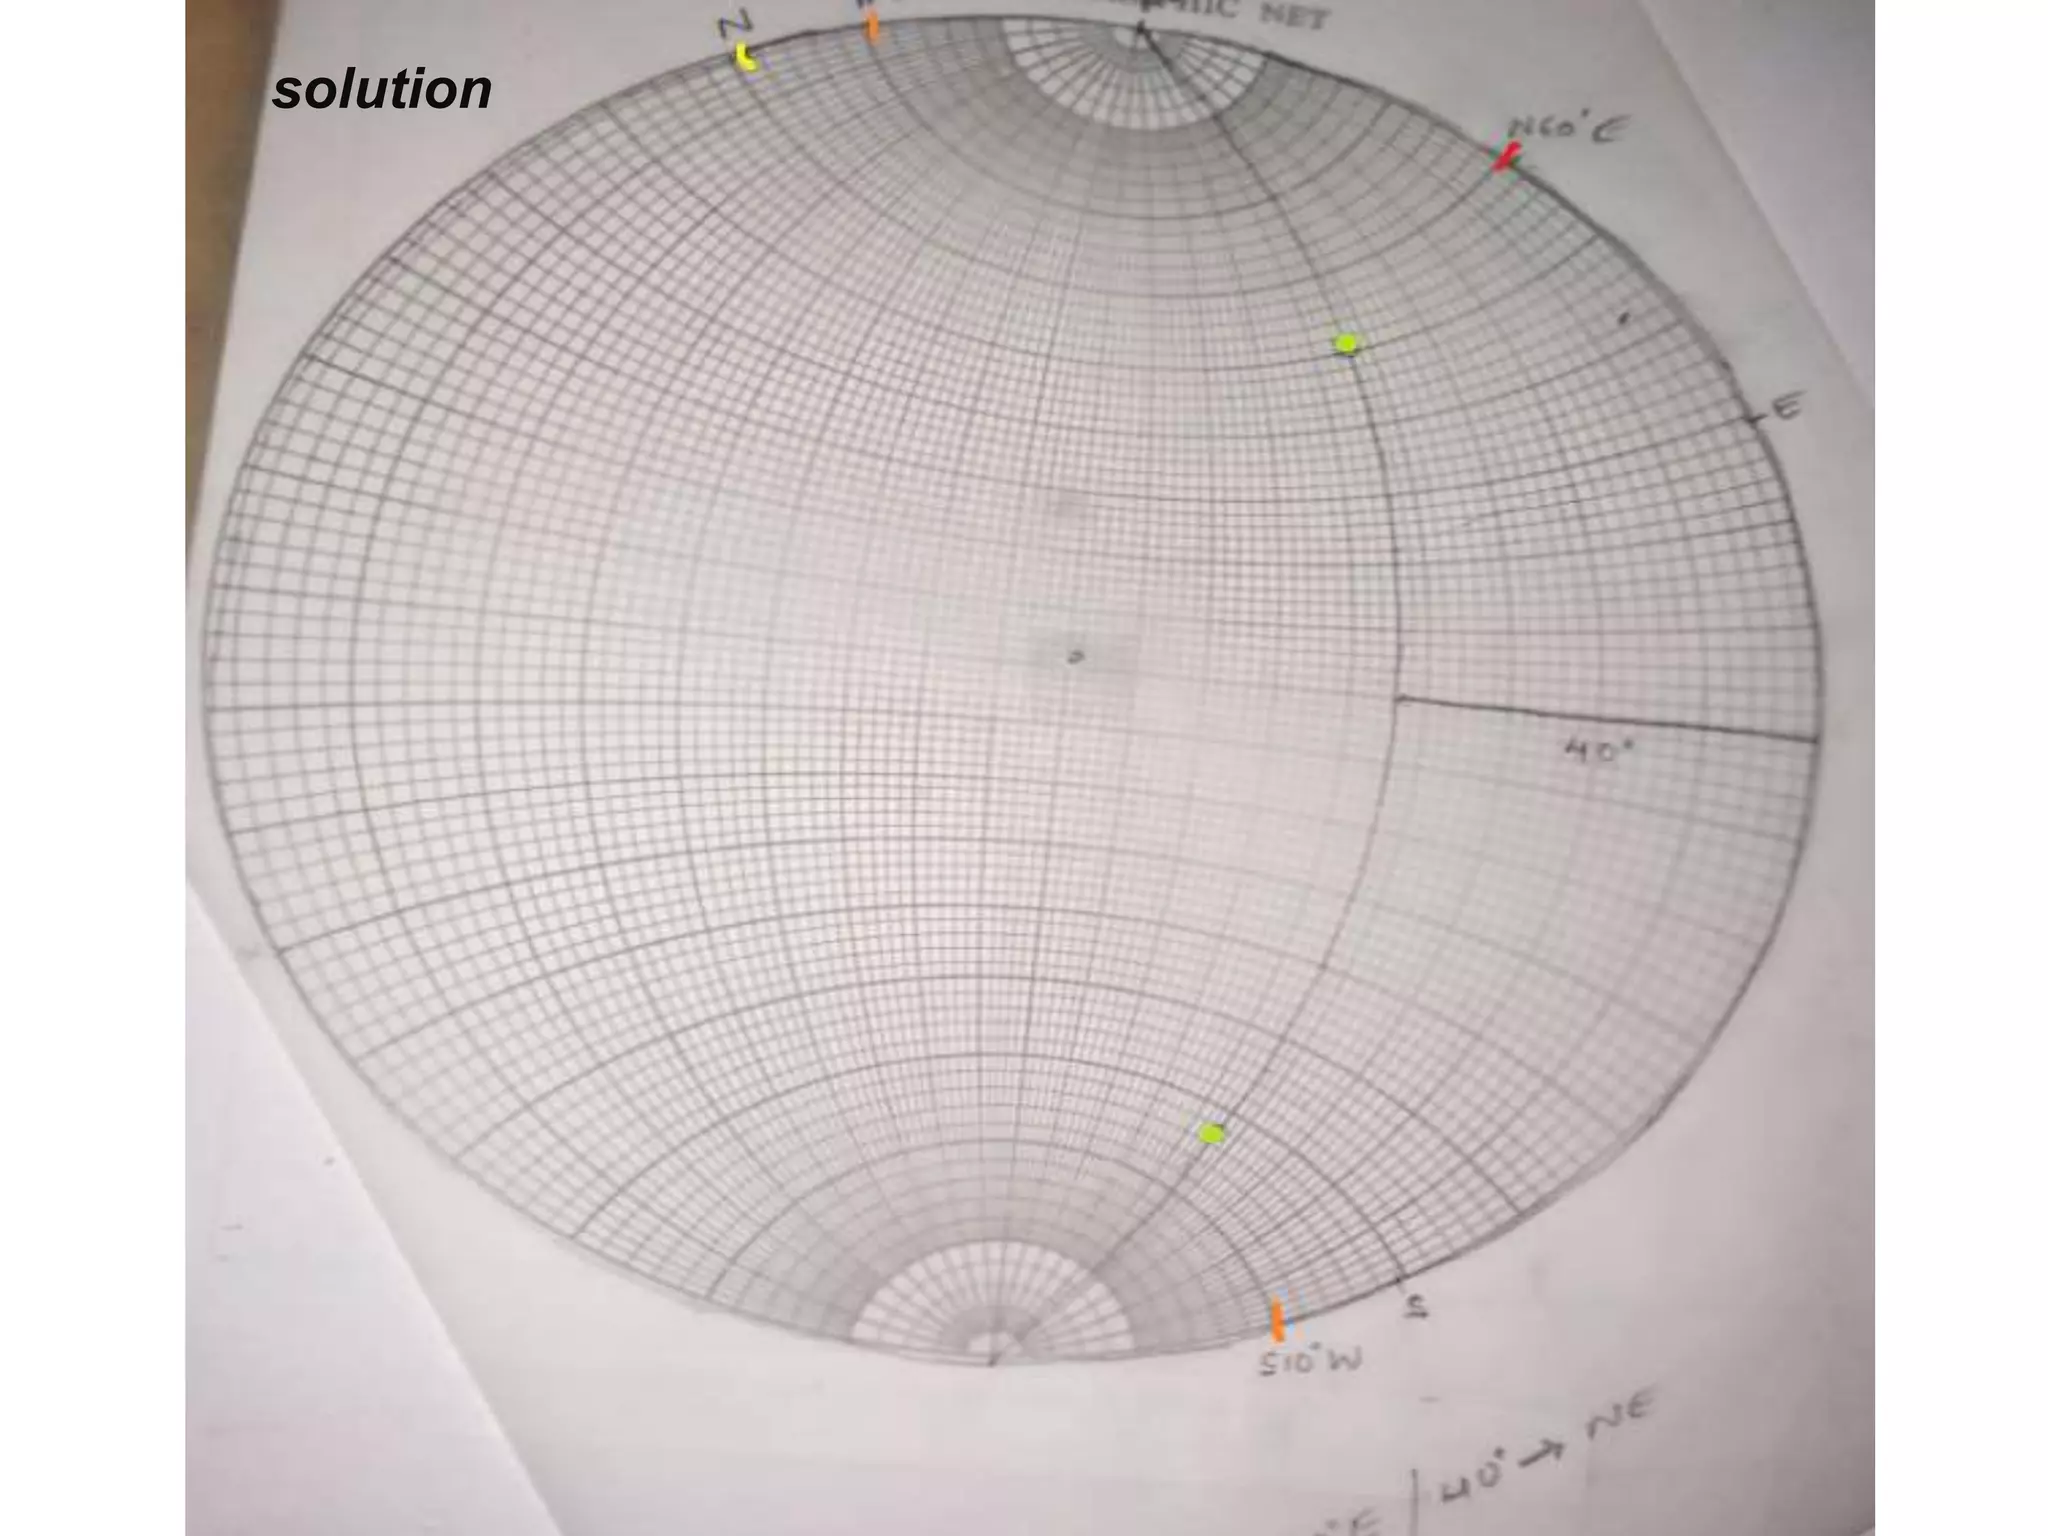
Stereographic projection is a powerful method for solving geometric problems in
structural geology. Unlike structure contouring and other map-based techniques, it
preserves only the orientation of lines and planes with no ability to preserve position
relationships. However, it is extremely useful, as orientation problems are very common
in structural geology. Used by crystallographers as a tool for representing variations in
crystal form
There are several varieties of stereonet available.
Wulff net - which is used for the construction of the true, or equal-angle
stereographic projection .
Schmidt net - which constructs an equal area projection.
5. Great circle and Pole
A plane intersects the sphere in
trace that is a great circle that
bisects the sphere precisely. A
family of planes dipping at various
increments is shown in Figure ,
Planes project as curves that are
actually perfectly circular arcs
called cyclographic traces or just
great circles. Lines project as points
or poles.
Zenith point.
To image features on a sheet of
paper, these traces and points are
projected from a point at the summit
or zenith of the sphere onto the
equatorial plane.
6.
7.
8. A
B
C
• A stereonet is a lower hemisphere graph
on to which a variety of geological data
can be plotted .stereonet are used in
many different branches of geology and
can be used in a range of ways beyond
those which are discussed here
,stereographic projection involves
plotting 34D data (planner and linear )on
to the 2D surface ,where it can be
manipulated and interpreted .
• Imagine a sphere with lines lattitude and
longitude marked on it ,A stereonet is the
plane of projection of the lower half of the
sphere –it is a lower hemisphere graph
• Imagine a plane cutting through the
centre of a lower hemisphere ( figure A)
,The stereonet forms the surface of this
lower hemisphere looking from above
where the plane touches the edge of the
lower hemisphere is an arc is projected
back up on the stereonet to form a great
circle ( figure B)
and figure C Shows the resulting
plot.
9. HOW TO PLOT A PLANE
Plot a plane with strike/dip as 090/40S
10. Lineations are measured using plunge/azimuth.
Examples:- slickenslide and slicken fiber,fold axis , mineral
stretching lineation etc.
Plotting a lineation
11.
12.
13. Plotting a pole
The pole to a plane is an imaginary line
perpendicular to the plane.
A stereonet with poles is known as a Pi (π) plot.
Plotting a pole to 055/20 SE.
● Mark on the strike reading 055°
● Note which way the plane is dipping, then rotate the
tracing paper round until this mark is aligned with north on
the stereonet.
● Find the great circle of the plane by counting along the
equator from the primitive. Count in from the direction of dip
as marked on the tracing paper (in this case SE) along the
equator line 20°.
● Count a further 90° through the centre of the net and mark
a point – this is the pole to the plane
14. Pi-plots and folds on stereonets
• Poles are a common way of plotting folded
bedding on stereonets. The distribution of poles on the stereonet
gives information on the fold’s geometry including estimates of the
fold axis and the fold axial plane.
• In this simple example the beds all have the same strike, it is only
their dip that varies round the fold.
17. Problems in Stereographic projection
Apparent dip of a bed is 26 degreeNE on a cliff trending N60degreeE.The
same bed has an apperent dip of 19degree SW on a cliff trending
N10degreeE. Find the strike and true dip of the bed.
19. An ore body occures in the plunging trough formed by a basic dyke crossing
a limestone layer. The limestone strikes N20degree E and dips 20degreeW.
The dyke strikes N15degreeW and dips 65degreeW. Find the orientation
and plunge of the ore body and its pitch on bothe vein and the bed .
21. A set of homoclinal bed ids dipping 60 degree 048degree within which
the foreset laminae of cross bedding dips 40 degree 084degree. If the
original dip direction of foreset laminae give the direction of palaeocurrent,
findout original direction of palaeocurrent.
23. Lisle,R.J,and Leyshon,P.R (2004),Stereographic projection
Technique for Geologists ad Civil Engineers.(2nd edition)
Cambridge Publication.
Jain .A.K (2014) ,an Introduction to Structural Geology( 1st
edition) Geological Society of india ,p.p 41-54
Marshak .S. Mitra G(1985) , Basic method of Structural Geology,
prentice hall publication new jersey .p.p 87-192 .
Roy ,A.K , (2009) ,Introduction to Geological Map and Structure,
3rd edition ,the world press private limited , p.p 149-173
Fossen Haakon (2010),Structural Geology 1st year of
publication
REFERENCES
24. Conclusion
In engineering geology project require stable slope ,which are dependent upon the
orientation of planer structure and their relation with angle and direction of slope .
Invaluable tools in determining attitude of ancient paleodepositional bedding which
needed to established other significant geological data .
It is helpful in plotting pi and β diagram hence guessing form of fold,
We find many undersurface bedding , folding, faulting etc ,which could be analysed
by finding its attitude with the help of stereographic projection.
We can plot many data in one place in any time and can find interrelated attitude,
so it is helpful in saving time and making many structural problem easy.