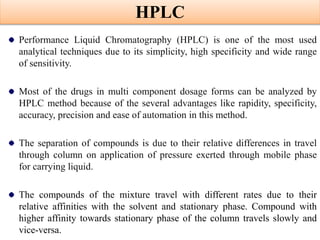
THESIS PRESENTED ON
Stability Indicating Method Development and
Validation for Assay of Propafenone in Extended
Release Capsule Dosage Form
Presented by:
Vaibhav S.Bhatt
M. Pharm(Sem IV)
Quality Assurance
122080904015
Industrial Guide:
Mr. Hemang Parikh
Group leader , ADL-US
Zydus Cadila
Guided by:
Mr. Hiren kadikar
M.pharm
Asst. Professor (Q.A)
ARIHANT SCHOOL OF PHARMACY & BRI
Uvarsad Crossroad, S.G. Highway, Adalaj,
Dist. Gandhinagar-382421, Gujarat
INTRODUCTION[1-39]
Arrhythmia is an abnormality of rate, origin or conduction or spread of
cardiac impulses.
The rhythm of the heart is determined by the generation of an impulse by
some pacemaker cell, and the conduction of that impulse to the rest of the
heart.
Disturbances in cardiac rhythm are a result of abnormalities in impulse
initiation, or conduction, or both.
Arrhythmias are of various types :-
• Ventricular arrhythmia
• Supraventricular arrhythmia
• Paroxysmal tachycardia
• Atrial flutter
• Atrial fibrilation
• Ventricular flutter
• Ventricular fibrilation
Propafenone is mainly useful in Supraventricular Arrhythmias.
ARRHYTHMIA
1. Class I agents sodium channel blockers:-
A. Intermediate channel binding and recovery:- Quinidine,
procainamide, Disopyramide
B. Rapid channel binding and recovery :- lidocaine, Mexiletine,
Tocainide
C. Slow channel binding and recovery:- Propafenone, flecainide
2. Class II beta blockers:- Propranolol, Esmolol, Acebutolol, sotalol
3. Class III potassium channel blockers:- Amiodarone, Bretylium,
Ibutilide, Dofetilide
4. Class IV calcium channel blockers:- verapamil , diltiazem
CLASSIFICATION
HPLC
Performance Liquid Chromatography (HPLC) is one of the most used
analytical techniques due to its simplicity, high specificity and wide range
of sensitivity.
Most of the drugs in multi component dosage forms can be analyzed by
HPLC method because of the several advantages like rapidity, specificity,
accuracy, precision and ease of automation in this method.
The separation of compounds is due to their relative differences in travel
through column on application of pressure exerted through mobile phase
for carrying liquid.
The compounds of the mixture travel with different rates due to their
relative affinities with the solvent and stationary phase. Compound with
higher affinity towards stationary phase of the column travels slowly and
vice-versa.
VALIDATION
Validation of analytical method is defined as the process by which it is
established, by laboratory studies, that the performance characteristics of
the method meet the requirements for the intended analytical application.
It is the documented evidence that provides high degree of assurance that
the given method , process or procedure will consistently produce the
product which will meet the pre- determined specification.
The objective of validation of an analytical procedure is to demonstrate
that it is suitable for its intended purpose.
VALIDATION PARAMETERS
 Accuracy
 Precision
 Specificity
 Linearity
 Range
 Robustness
 Limit of detection
 Limit of quantification
Stability Indicating Assay Method (SIAM)
ICH harmonized Tripartite Guideline described Stability Testing of New
Drug Substances and Products [ICH Q1AR2].
According to ICH Q1AR2, SIAM defined as “Method which is reliable,
meaningful and specific means the content of active ingredients, degradation
products and other contents of interest in a drug product can be accurately
measured without interference.”
According to US-FDA stability guideline of 1998, SIAM defined as,
“Validated quantitative analytical methods that can detect the changes with
time in the chemical, physical, or microbiological properties of the drug
substance and drug product, and that are specific so that the contents of
active ingredient, degradation products, and other components of interest
can be accurately measured without interference”
OBJECTIVES OF STABILITY TESTING
To provide evidence on how the quality of a drug substance or drug
product varies with time under the influence of a variety of condition.
To determine structural transformation of the drug substance and drug
product.
To determine lowest possible conc. of potential degradation products.
To establish the retest period for the drug substance.
To determine the shelf life of the drug product.
To propose the recommended storage conditions.
To provide assurance to the patients.
STRESS TESTING CONDITIONS
• Acid stress testing
• Base stress testing
• Peroxide stress testing
• Thermal stress testing
• Humidity stress testing
• Photo stability
DRUG PROFILE[40-43]
Name of drug Propafenone
Structure
Mol. formula C21H27NO3.HCL
Mol. Wt. 377.92
CAS No. 54063-53-5
IUPAC name 1-{2-[2-hydroxy-3(propylamino)-propoxy]phenyl}-3-
phenylpropan-1-one
Description Propafenone hydrochloride is a colourless crystals to white
fine crystalline powder with a bitter taste.
Solubility It is slightly soluble in alcohol and chloroform. It is very
slightly soluble in acetone. It is soluble in methanol and hot
water. It is insoluble in diethyl ether and toluene.
Melting point 173°C - 176oC
pKa 8.91
Dosage forms Tablet, Capsule, Injection and Suspension.
Dispensing and
Storage
Dispense in a tight light-resistant container.
Store at 20°–25°C (68°–77°F).
Mechanism of
action
Propafenone HCL is a sodium channel protein inhibitor.
Propafenone works by slowing the influx of sodium ions into
the cardiac muscle cells, causing a decrease in excitability of
the cells Propafenone differs from the prototypical class Ic
antiarrhythmic in that it has additional activity as a beta-
adrenergic blocker which can cause bradycardia and
bronchospasm . Mainly used for supraventricular
arrhythmias.
Pharmacokinetics Absorption: From G. I. Tract
Distribution: 97% drug bound to plasma protein.
Metabolism: Metabolized primarily in the liver where it is
rapidly and extensively metabolized to two active
metabolites, 5-hydroxypropafenone and N-
depropylpropafenone. These metabolites have
antiarrythmic activity comparable to propafenone but are
present in concentrations less than 25% of propafenone.
Excretion: Approximately 50% of propafenone metabolites
are excreted in the urine following administration of
immediate release tablets.
Volume of distribution : 252 Lit.
LITERATURE REVIEW[44-54]
Sr.
No.
Source Method Description Ref
No.
1 EP 2008 Assay by
potentiometric
titration
Dissolve 0.3 g in 2 ml of formic acid,
add 50 ml of acetic anhydride , titrate
with 0.1M perchloric acid
potentiometrically, perfom blank.
Each ml of 0.1M perchloric acid is
equivalent to 377.92 mg of
propafenone HCL.
44
2 EP 2008 Liquid
chromatography
M.P: Phosphate buffer pH 2.5:
ACN (65:35)
S.P: Octyl silyl silica gel column
Flowrate: 1ml/min
Detection: Uv detector at 222 nm
44
Official Methods for Propafenone
3 USP30
NF-25
Assay by
potentiometric
titration
Dissolve 0.250 g in 30 ml of
methanol, add 15 ml of mercuric
acetate, titrate with 0.1M
perchloric acid potentiometrically.
Each ml of 0.1M perchloric acid is
equivalent to 377.92 mg of
propafenone HCL
45
4 USP30
NF-25
Liquid
chromatography
S.P: Octyl silyl silica gel column
M.P: Ammonium sulphate buffer:
ACN (16:9)
Flowrate: 1ml/min
Detection: UV detector at 222 nm
45
5 USP30
NF-25
Gas
chromatography
Career gas: Helium
S.P: Silica coated with
polymethylsiloxane
Detection: Flame ionisation
detactor
45
6 BP
2012
Assay by
potentiometric
titration
Dissolve 0.3 g in 2 ml of formic acid,
add 50 ml of acetic anhydride, titrate
with 0.1M perchloric acid
potentiometrically, perfom blank.
Each ml of 0.1M perchloric acid is
equivalent to 377.92 mg of propafenone
HCL
46
7 BP
2012
Liquid
chromatography
M.P : Phosphate buffer PH 2.5:
ACN(65:35)
S.P : Octyl silyl silica gel column
Flowrate : 1ml/min.
Detection : Uv detector at 222 nm
46
Sr.
No.
Drug/ Dosage Form/
Matrix
Description Ref
No.
1 Propafenone and 5-
hydroxy Propafenone
in pharmaceutical
formulation
S.P : 25×0.4 cm 5 μm ODS column.
M.P: 0.1 M di potassium hydrogen
phosphate (K2HPO4) buffer (pH 2.5) and
acetonitrile (63:37)
Detection: UV detection at 249 nm.
Rt: Retention times of the internal
standard, propafenone, and 5-OH
propafenone are 4.3, 6.0 and 2.9 minutes
respectively.
47
2 Propafenone and 5-
hydroxypropafenone
enantiomers in
human plasma
S.P : Toluene : diethyl ether phase (9:1).
M.P : silica gel column using N-tert-Boc-
(L)-proline as the chiral additive to the
mobile phase.
Detection : UV detection at 249nm.
48
Reported methods for Propafenone
3 Propafenone HCL
in presence of its
Degradation
product in
Pharmaceutical
Dosage form
S.P: ODS (250 X 4.6 mm, 5μm) column
M.P: 0.01 M potassium dihydrogen phosphate
(pH 3.0) : ACN 65:35 (v/v)
Flowate: 1.0 mL/ min
Detection: UV detection at 249 nm.
Rt: 7.41 min
49
4 propafenone in
bulk drug and it’s
pharmaceutical
formulation.
Method A: Extractive Spectrophotometric
estimation , propafenone was estimated at 301 nm
using ethanol as a solvent & linearity was
observed in the conc. range of 20 - 200 μg /ml.
Method B: Hydrotropic method , propafenone
was estimated at 301 nm using diphenhydramine
citrate as a solvent & linearity was observed in
the conc. range of 15 - 150 μg /ml.
50
5 Propafenone
Hydrochloride in
tablet dosage form
S.P : Aluminum plate
10 × 10 & 20 × 10 cm) with 250 μm thickness.
M.P: Chloroform : methanol : ammonia (8 : 2 :
0.2 v/v).
Rf value: 0.49
51
6 Propafenone
HCL in tablet
dosage form.
HPTLC method
S.P: precoated aluminium backed TLC plate (10
cm x 10 cm).
M.P: methanol : ethyl acetate : triethylamine
(1.5 : 3.5 : 0.4 v/v/v)
Scaning time: 10 min.
Detecion: UV at 250 nm.
52
7 Propafenone
and Its Major
Metabolites in
Human Serum
S.P: C18 column (25 × 0.46 cm i.d., 5 µm)
M.P: ACN : phosphate buffer gradient at a flow
rate of 1.7 ml min-1.
Detection: UV at 210 nm.
53
8 propafenone in
biological
fluids
Gas-liquid chromatographic method.
S.P : 25 m × 0.31 mm cross linked , phenyl
methyl silicone coated fused-silica capillary
column was employed for all analyses.
Conc.range : 10-100 ng/ml
54
RATIONALE
• The review of literature reveals that Stability Indicating HPLC and
HPTLC method is developed for estimation of Propafenone HCL in bulk
and solid dosage form.
• Generally, majority of analysis in industries are done on HPLC.
• Propafenone HCL is available in the market with Brand name
RHYTHMOL.
• Propafenone mainly used for Supraventricular tachycardia.
• My goal is to developed more accurate, precise and efficient stability
indicating HPLC method than the available one.
• The Stability of Capsule formulation in acid/base, thermal/humidity,
oxidation, light, etc. is more important.
• So area of interest is to Develop and Validate Simple, Accurate, Precise
and Economic stability indicating RP-HPLC method for estimation of
propafenone in capsule formulations as per ICH guideline.
• To perform Forced degradation study as per ICH guidelines.
SUMMARY OF PSAR REPORT
Sr.
No.
Patent Application
number
Title of Patent
1 IB2009/007126 Propafenone extended release composition
2 11/146006 Sustained release propafenone
hydrochloride capsules
3 PCT/CA2005/000863 Propafenone hydrochloride capsules
containing microtablets
4 12/419790 Novel Antiarrhythmic Drug Formulations
5 07/189544 Long lasting composition of propafenone
and quinidine for treatment of cardiac
conditions
Novelty of Project: Looking at above 5 patents the dissertation
title is 50-75% novel.
•Propafenone HCL is available in the market with Brand name
RHYTHMOL & mainly used for Supraventricular tachycardia.
•The Stability of Capsule formulation in acid/base,
thermal/humidity, oxidation, light, etc. is more important.
•Stability Indicating HPLC and HPTLC method is developed for
estimation of Propafenone HCL in bulk and solid dosage form.
•So area of interest is to Develop and Validate better , different and
precise stability indicating method for estimation of propafenone
in capsule formulations as per ICH guideline.
AIM OF WORK
• Day to day numbers of newer drugs and their formulations either in single or
in combined dosage forms are marketed. Drug analysis plays a vital role in
drug product design, development, and manufacturing. This analysis
provides assurance that the product meets the established quality
requirement.
• Though Stability indicating HPLC and HPTLC methods are available for
estimation of Propafenone, my goal is to developed more accurate, precise
and efficient stability indicating HPLC method than the available one.
• To develop a simple and accurate HPLC method for the determination of
Propafenone HCL in Propafenone HCL Extended release capsules.
• Validation of the developed method.
• To carry out forced degradation study of Propafenone HCL according to
ICH guideline Q1A(R2).
EXPERIMENTAL WORK
Melting Point Standard Observed
Propafenone 173oC - 176oC 176.78oC
IDENTIFICATION OF SAMPLE BY MELTING POINT (44)
DSC of Propafenone
IDENTIFICATION OF SAMPLE BY IR SPECTRUM
Reference IR spectrum of propafenone
IR spectrum of sample
IDENTIFICATION OF SAMPLE BY IR SPECTRUM
PROCEDURE FOR RECORDING IR SPECTRUM
•Mix 3 mg of sample with 900 mg Kbr, grind the mixture and record IR
absorption spectrum between 3800 cm-1 to 650 cm-1 using air as a
reference.
•The IR absorption spectra of sample exhibit maxima, which are only at
the same wavelength in the spectrum of propafenone USP working
standard prepared in the same manner.
•So it is identified that the given sample is propafenone.
Functional Group IR Frequency (Cm-1)
C-C 1186
C=C 1651
C-H (S) 2939
C-H (B) 1328
CH2 (S) 1369
CH2 (B) 1485
CH3 (B) 1398
C-O 1100
C=O 1695
N-H 3417
O-H 3319
Aromatic Ring 910
Interpretation of IR Spectra
INSTRUMENTS
Sr. No Instrument Make Model
1. HPLC Waters 2862
2. ANALYTICAL BALANCE Mettler Toledo XR205SM-DR
3. PH METER Lab India 420 A+
4. MILLI Q WATWR SOURCE Thermofisher
scientific
Branstead D3750
5. INJECTOR Rhenodyne valve
with 20μl fixed
loop
-
6. PUMP Quaternary pump -
7. DETECTOR UV detector
PDA detector
-
8. HOT AIR OVEN Lab line Cintex-906
9. SONICATOR Roop telesonic Branson 2510
MATERIALS
No. Name Grade Source/Supplier
1 Water HPLC Nanopure Diamond
water Purification
2 Di potassium hydrogen
phosphate
AR Merck
3 Orthophosphoric acid HPLC Spectrochem
4 Acetonitrile HPLC Rankem
5 Hydrochloric acid AR Merck
6 Sodium hydroxide AR Merck
7 Hydrogen peroxide AR Merck
Buffer
preparation
• Dissolve 5.2 gm of K2HPO4 anhydrous in 2000 ml of Water,
and adjust the pH 2.5 with Orthophosphoric acid (OPA).
• Filter the solution through 0.45 μ nylon filter and degas
before use.
Mobile
phase
• Prepared a mixture of 600 ml of Buffer and 400 ml of
Acetonitrile.
• Adjust pH 2.5 with diluted Orthophosphoric acid (OPA).
Diluent
• Milli-Q water : Acetonitrile (60:40)
PREPARATION OF SOLUTIONS
Standard preparation: (100 μg/ml):
100 mg of Propafenone hydrochloride standard to
100 ml volumetric flask. Add 70ml of diluent and
sonicate to dissolve.
Dilute 5ml of this solution to 50ml with
diluent.
Make volume up to mark
with diluents and mix.
Equivalent to 500 mg of Propafenone
hydrochloride powder to 250 ml volumetric flask.
Add 150ml of diluent and sonicate to dissolve
for 30 min.
Dilute 5ml of this solution to 100ml with diluent.
Make volume up to mark
with diluents and mix.
Sample Preparation: (100 μg/ml):
HPLC METHOD DEVELOPEMENT
Selection of Detection Wavelength
UV spectra of Propafenone HCl
•The standard Propafenone solution in diluent (100 μg/ml) was analyzed in the
UV region of 200-400 nm and the spectrum was recorded. The detection
wavelength for propafenone HCl was found to be 249 nm.
TRIALS FOR MOBILE PHASE OPTIMIZATION
Trial
No.
Mobile Phase Retention
Time (min)
Remarks
1. Water : Methanol (60:40) 0.824 Early elution, Poor peak symmetry
2. Water : Methanol (70:30) 0.881 Early elution, Poor peak symmetry
3. Water : ACN (60:40) 1.250 Early elution
4. Water : ACN (70:30) 1.925 Early elution
5. Buffer (KH2PO4, pH 6.8) :
ACN (60:40)
10.625 Late elution
6. Buffer (KH2PO4, pH 4.5) :
ACN(60:40)
5.167 Good Rt, Proper peak symmetry
7. Buffer (KH2PO4, pH 2.5) :
ACN(60:40)
3.36 Effective Rt, Proper peak
symmetry
OPTIMIZED CHROMATOGRAPHIC CONDITION
PARAMETERS SPECIFICATION
Stationary Phase Inert ODS 3V C18 (250 X 4.6
mm), 5μ
Flow rate 1.5 ml/min
Wavelength 249 nm
Injection volume 10 μl
Coloumn oven temperature 45 °C
Mobile phase Buffer (KH2PO4, pH 2.5) : ACN (60:40)
Diluent Milli - Q water : ACN (60:40)
Retention time 3.368 min
Run time 10 min
Chromatogram Of Propafenone HCl Standard
FORCED DEGRDATION
Degradation Condition
Acid Hydrolysis 15 ml 5N HCL Water Bath 90 0C 1 Hr
Alkali Hydrolysis 15 ml 5N NAOH Water Bath 90 0C 1 Hr
Peroxide Oxidation 15 ml 30% H2O2 Water Bath 90 0C 30 min
Thermal Degradation 7 Days at 100 0C
Photolytic Degradation 7 Days under UV light
Humidity Degradation 7 Days at 40 0C / 75% RH
DEGRADATION CONDITION
Acid Degradation
Chromatogram of Acid Degradation (Placebo)
Chromatogram of Acid Degradation (Standard)
Chromatogram of Acid Degradation (Sample)
Base Degradation
Chromatogram of Base Degradation (Placebo)
Chromatogram of Base Degradation (Standard)
Chromatogram of Base Degradation (Sample)
Peroxide Degradation
Chromatogram of Peroxide Degradation (Placebo)
Chromatogram of Peroxide Degradation (Standard)
Chromatogram of Peroxide Degradation (Sample)
Thermal Degradation
Chromatogram of Thermal Degradation (Placebo)
Chromatogram of Thermal Degradation (Standard)
Chromatogram of Thermal Degradation (Sample)
Photolytic Degradation
Chromatogram of Photolytic Degradation (Standard)
Chromatogram of Photolytic Degradation (Sample)
Chromatogram of Photolytic Degradation (Placebo)
Humidity Degradation
Chromatogram of Humidity Degradation (Placebo)
Chromatogram of Humidity Degradation (Standard)
Chromatogram of Humidity Degradation (Sample)
DEGRADATION SUMMARY
Degradation
Condition
Peak Area % Degradation
Standard 796308 -
Sample as such 762441 -
Standard Sample Standard Sample
Acid Hydrolysis 677983 641219 14.8 15.9
Base Hydrolysis 693882 681100 12.8 10.7
Peroxide Oxidation 633524 614778 20.4 19.3
Thermal Degradation 793506 757998 0.35 0.58
Photolytic Degradation 794228 759526 0.27 0.38
Humidity Degradation 795974 760939 0.05 0.20
PEAK PURITY MATCH
Degradation Condition Peak purity factor
Acid Hydrolysis 999.953
Base Hydrolysis 999.925
Peroxide Oxidation 999.945
Thermal Degradation 999.916
Photolytic Degradation 999.958
Humidity Degradation 999.478
•Based on the results, obtained from the analysis of forced degraded
samples using described method, it shows that there was no other co-
eluting peaks of interference from recipients and degradation products
due to variable stress components with the main peaks and the method
was specific for the estimation of Propafenone HCl in presence of
various degradants.
•So previously described method can be used as stability indicating
method for Assay of Propafenone HCl from its ER Capsule dosage
forms.
DISCUSSION
METHOD VALIDATION
100 mg of Propafenone standard Dilute to 100 ml with diluent
(1000 μg/ml) (LSS)
Further dilute LSS up to
100 ml with diluent
25 μg/ml
2.5 ml
to 100
ml
50 μg/ml 75 μg/ml 100 μg/ml 125 μg/ml 150 μg/ml
5 ml to
100 ml
7.5 ml
to 100
ml
10 ml to
100 ml
12.5 ml
to 100
ml
15 ml
to 100
ml
Preparation of solutions for linearity study
Result of Linearity – Range study
SR.
NO
CONCENTRATION
(µg/ml)
AREA (VOLTS)
± SD
% RSD
1 25 189311 ± 750.798 0.39
2 50 396392 ± 2053.373 0.51
3 75 594183 ± 3739.276 0.62
4 100 787092 ± 5439.013 0.69
5 125 977668 ± 4363.375 0.44
6 150 1194025 ±8770.450 0.73
Concentration (µg/ml)
Area
(Volts)
Calibration curve of Propafenone HCl
PARAMETERS VALUE
Linearity range 25-150 µg/ml
Regression equation Y= 7954.6 x – 6252.2
Correlation Co-efficient (R2) 0.999
Slope of curve 7954.6
Overlain Chromatogram of Propafenone HCl (25 - 150 µg/ml)
Summary of linearity - range of Propafenone Hydrochloride
Limit of Detection (LOD) – Limit of Quantification (LOQ)
PARAMETERS VALUE
LOD 0.04 µg/ml
LOQ 0.12 µg/ml
Preparation of solutions for recovery study
Accuracy
Level
Weight
of API
(mg)
Weight
of
Placebo
(mg)
Dilute to
Volume
With
Diluent
(ml)
Accuracy
Stock
Solution
(ml)
Further
Dilute to
Volume
with
Diluent
(ml)
Final
Conc.
(μg/ml)
50% 250 20 250 5 100 50
100% 500 20 250 5 100 100
150% 750 20 250 5 100 150
Set No. Accuracy
level
(%)
Expected
amount of
Propafenone
(μg/ml)
Recovered
amount of
Propafenone
(μg/ml)
%
Recovery
Mean
± SD
%
RSD
Set – 1
50
50 50.27 100.54 50.57
±
0.31
0.61Set – 2 50 50.89 101.78
Set – 3 50 50.54 100.08
Set – 1
100
100 100.73 100.73 100.82
±
0.59
0.59Set – 2 100 101.28 101.28
Set – 3 100 101.46 101.46
Set – 1
150
150 148.28 99.85 148.92
±
0.79
0.53Set – 2 150 148.67 99.28
Set – 3 150 149.81 99.87
Result of Recovery study (n=3)
Sr.
No.
Concentration (µg/ml) Area (Volts)
1. 100 788016
2. 100 796675
3. 100 785323
4. 100 789448
5. 100 782619
6. 100 792897
Mean AUC (n=6) 789163
SD (n=6) 5086.045
% RSD 0.64
Result of repeatability study (n=6)
Sr. No. Concentration
(µg/ml)
Mean Area ± SD Area (Volts)
1 50 398136 ± 1837.267 0.46
2 100 789546 ± 4883.726 0.52
3 150 1197845 ± 8474.793 0.70
Result of Intra-day precision (n=3)
Sr. No. Concentration (µg/ml) Mean Area
± SD
Area (Volts)
1 50 395698 ± 2274.792 0.57
2 100 781392 ± 5363.155 0.68
3 150 1199025 ± 9364.180 0.78
Result of Inter-day precision (n=3)
Specificity
Chromatogram of blank (Diluent)
Chromatogram of Placebo
Chromatogram of Standard for Propafenone Hydrochloride
Chromatogram of Sample for Propafenone Hydrochloride
•In the specificity study, Blank, placebo and standard and sample were
injected into the system.
•The chromatograms of blank and placebo do not show any interferences
at the retention time of Propafenone Hydrochloride as it can be seen
from respective chromatograms.
•By computing peak purity of main peak using PDA detector, Standard
and sample solution was analyzed as per proposed method. Analysis was
replicated for six times. Peak purity factor was found to be 999.888 for
Propafenone Hydrochloride. Result of specificity study by peak purity is
depicted in table .
Sr.
No.
Concentration
(µg/ ml)
Peak Purity Mean Peak Purity
1. 100 999.888
999.888
2. 100 998.783
3. 100 999.574
4. 100 998.462
5. 100 998.812
6. 100 999.894
Result of specificity study
Robustness
Robustness of method was studies by small but deliberate change in
chromatographic condition as below:
i. Change in Flow rate : 1.4 ml/min, 1.6 ml/min
ii. Change in mobile phase composition : Acetonitrile : Phosphate
buffer (pH 2.5) (62:38, 58:42 %v/v)
iii. Change in pH : 2.3, 2.7
iv. Change in wavelength : 247 nm, 251 nm
v. Change in temperature : 40ºC, 50ºC
Result of Change in Flow Rate
Sr.
No.
Flow Rate: 1.4 ml/ min
Area (Volts)
Flow Rate: 1.6 ml/ min
Area (Volts)
1. 931558 701947
2. 938876 712698
3. 933569 704589
4. 933548 705489
5. 939958 708268
6. 934498 713589
Mean AUC
(n=6)
935334 707764
SD (n=6) 3322.325 4639.455
% RSD 0.35 0.65
Result of Change in Mobile Phase composition
Sr.
No.
Buffer (KH2PO4, pH 2.5) :
ACN (62 : 38 % v/v)
Area (Volts)
Buffer (KH2PO4, pH 2.5) : ACN
(58 : 42 % v/v)
Area (Volts)
1. 811161 800139
2. 815487 808698
3. 816984 813257
4. 814581 801936
5. 813259 807854
6. 819589 809359
Mean AUC
(n=6)
815178.166 806873.833
SD (n=6) 2931.887 4918.320
% RSD 0.35 0.61
Result of Change in pH
Sr.
No.
pH : 2.3
Area (Volts)
pH : 2.7
Area (Volts)
1. 812937 830698
2. 814589 838579
3. 813957 836987
4. 812698 843597
5. 817598 831458
6. 818589 842985
Mean AUC
(n=6)
815061.333 837384
SD (n=6) 2466.572 5502.331
% RSD 0.30 0.65
Result of Change in Wavelength
Sr.
No.
ƛmax: 247 nm
Area (Volts)
ƛmax: 251 nm
Area (Volts)
1. 775896 728589
2. 773698 726699
3. 774589 726486
4. 772689 726458
5. 771893 724589
6. 776983 711364
Mean AUC (n=6) 774291.666 724030.833
SD (n=6) 1928.259 4442.863
% RSD 0.25 0.61
Result of Change in Temperature
Sr.
No.
Temperature : 40 °C
Area (Volts)
Temperature : 50 °C
Area (Volts)
1. 774404 771226
2. 771268 776751
3. 772940 774638
4. 770291 780947
5. 774853 772120
6. 776944 783905
Mean AUC
(n=6)
773449.333 776598.833
SD (n=6) 2451.902 5001.638
% RSD 0.31 0.64
Hours Area (Volts)
4 817192
8 815665
12 814968
16 812879
20 809587
24 807998
Mean AUC (n=6) 803048.166
SD (n=6) 3611.576
% RSD 0.44
Solution stability study
Sr.
No.
Volume of
sample
discarded ( ml)
PVDF
(0.45 µm)
Nylon
(0.45 µm)
Area (Volts) Area (Volts)
1. Unfiltered 807689 818965
2. 1 805578 818457
3. 3 804547 806357
4. 5 803658 814798
5. 7 801946 812658
6. 10 800589 811457
Mean AUC (n=6) 804002 813782
SD (n=6) 2544.358 4723.367
% RSD 0.32 0.58
Filter compatibility study
Sr. no. Parameters Value Obtained Standard Value
1. Retention time (Rt) 3.36 -
2. % RSD of area of six
replicate injections
0.64 NMT 2.00
3. Mean Theoretical plates
(N) or Column efficiency
4256 NLT 2000
4. Mean Tailing factor (As)
or Symmetry factor
0.9 NMT 2.00
System suitability parameters
Label Claim (mg) % Assay
425
101.1
100.5
101.4
101.5
101.1
Mean ± SD 101.1 ± 3255.256
% RSD 0.48
Analysis of marketed formulation
Assay of Propafenone Hydrochloride (n=5)
Sr. No. Parameters Results
1 Linearity (μg/ml) 25-150
2 Correlation Coefficient 0.999
3 Accuracy (% Recovery) 99.28 – 101.78
4 LOD (μg/ml) 0.04
5 LOQ (μg/ml) 0.12
6 Repeatability (% RSD) 0.64
7 Intra-day Precision (%RSD) 0.46 – 0.70
8 Inter-day Precision (%RSD) 0.57 – 0.78
9 Specificity Specific: No co-elution
with main peak
10 Robustness
Complies with the acceptance
criteria
11 Solution Stability Study
12 Filter Compatibility Study
13 System Suitability study
Validation parameters summary
SUMMARY
•For the Propafenone hydrochloride, isocratic method was developed by
taking trials for the ratio of Water and methanol, water and acetonitrile,
and then the ratio of buffer and acetonitrle. The ratio of buffer and
acetonitrle were selected on the basis of good retention time and peak
symmetry, it was finalized as Mobile Phase in the ratio of 60:40%v/v.
•For the linearity and range, correlation coefficient value of the linearity
curve should not be less than 0.995. Correlation coefficient value for the
Propafenone hydrochloride was found to be 0.999, which is greater than
0.995. Hence, the method is linear within the range.
•Accuracy was determined over the range from lowest sample concentration
to highest concentration (i.e. from 50% - 150%). For each level, for the
drug, % R.S.D was found in the range of 0.53 – 0.61 %, which is well
within the acceptance criterion. Hence, the method is found to be accurate.
•In order to show the precision of the method, repeatability (System & Method
Precision), intra-day precision and inter-day precision were checked. For the
repeatability, % R.S.D of the six replicates of sample should not be more than
2%. The obtained % R.S.D was found to be 0.64 % for Propafenone
hydrochloride, which is well within the limit of acceptance criteria. While for
the intra-day precision and inter-day precision of the method, the % R.S.D was
found in the range of 0.46 – 0.70 % and 0.57 – 0.78 % respectively. Hence, the
method is found to be precise.
•In order to show the stability of the method, specificity was carried out. After
the specificity, it was observed that there was no interference of degradation
products, placebo, with the main peak. Peak purity index was found to be
greater than 990. All the results obtained were found within the acceptance
criteria. Hence, the method can be termed as specific.
•Robustness is performed to prove the efficiency of the method despite
deliberate changes in the normal method conditions i.e. column oven
temperature, flow rate, mobile phase pH, organic solvent composition,
wavelength etc. According to the acceptance criteria, the % R.S.D should not
be more than 2. The obtained % R.S.D was found to be in the range of 0.25 –
0.65 %. Therefore, it is within the acceptance criteria. Hence, the method can
be termed as robust.
•From the results obtained, it is obvious that the proposed method is applicable
for the determination of Propafenone hydrochloride without interference and
with good sensitivity. The results obtained indicate that the proposed method
for the estimation of Propafenone hydrochloride is specific, rapid, linear,
accurate, precise, and suitable for intended use. These merits suggest the use
of the proposed method in routine and quality control analysis without
interference from commonly encountered excipient.
REFERENCES
1. Tripathi KD. Essentials of medical pharmacology; 5th Edn, Jaypee
brothers medical publishers (p) Ltd, New Delhi: 2003; pp: 480.
2. Rang HP, Dale MN, Ritter JM. Rang & Dale’s Pharmacology; 6th Edn,
Churchill Livingston publication, 2007, pp. 447-470.
3. Harvey RA, Champe PC. Lippincott’s Illustrated Reviews:
Pharmacology; 4th Edn, Williams & Wilkins publishers, 2009; pp:
198-208.
4. Goodman and Gilman. The Pharmacological Basis of Therapeutics;
10th Edn, The McGraw Hill companies Inc, 2001, pp 843-845.
5. Mark RG. Clinical electrocardiography and arrhythmias,
Massachusetts institute of technology, 2004.
6. Bheem, “Theory of HPLC”, Feb 2010,
http://bheem.hubpages.com/hub/HPLC-theory-tutorial (accessed on
28/09/2013).
7. Hamilton RJ, Sevell PA. Introduction to HPLC; 2nd Edn, Chapman
and Hall London, 1982, pp.189
8. Shukla R.S.Text book of Pharmaceutical Analysis; 3rd Edn, Rx
Publications, Tirunelveil, 2006, pp: 18.3-18.6.
9. “Reversed Phase Chromatography, Principle and Methods”,
Amersham
Bioscience,http://teachline.ls.huji.ac.il/72682/Booklets/AmershamRP
CManual.pdf (accessed on 28/09/2013).
10. Sharma BK,. Instrumental methods of chemical analysis;19th Edn,
Goel Publishing House, Krishna Prakashan Ltd, 2002, pp 1- 4.
11. Gurdeep RC, Anand SK. Instrumental methods of chemical analysis;
5th Edn, Himalaya publishing house, 2002, pp 2.624 to 2.630.
12. Willard HH, Merritt LL, Dean JA. Instrumental method of analysis;
7th Edn, CBS publication and distributors, 1986, pp 586 to 607.
13. Pavia DL, Lampman GM, Kriz GS. Introduction to Spectroscopy; 3rd
Edn, Cengage publication, 2001, pp. 26 – 36.
14. Elena K, Roy E, Peter S, Neil M. Handbook of HPLC; CRC
Publication, 1998 pp.293.
15. Snyder LR, Kirkland JJ, Glajch LJ. Practical HPLC Method
Development; A Wiley Inter - Science publication, 1997, PP.266.
16. Michael WD. Morden HPLC for practicing scientists; John Wiley &
Sons, Inc. publication, pp. 3 – 11.
17. Shethi P.D. HPLC-Quantitative analysis of pharmaceutical
formulations; CBS publishers & distributors, 3rd edition, 1997, pp:
182-184.
18. Lough WJ, Wainer IW. HPLC fundamental Principles and
practices, Blackie Academic and professional, 1991, pp. 52-67
19. Jeffery G. H, Bassett J. Vogel’s Textbook of Quantitative Chemical
Analysis; 5th edition, john wiley and sons, 1991, pp. 217-235.
20. Modern High Performance Liquid Chromatography (HPLC),
http://www.chromatography–online.org/HPLC.html.
21. High Performance Liquid Chromatography for students, Faculty &
Staff at George Mason University,
http://www.gmu.edu/departments/SIRF/tutorials/hplc/hplc2.htm
22. Lindsay Sandy. HPLC by Open learning, John Wiley and Sons,
London, 1991, 30-45.
23. Meyer VK. Practical High-Performance Liquid Chromatography;
4th Edn, John Willey & sons, 2004, pp. 159-175.
24. Szepei G. HPLC in pharmaceutical analysis; 2nd Edn, 1990, pp.
101-173.
25. “ICH Guidelines Validation of Analytical Procedures; Q2B Methodology”,
International Conferences on Harmonization, Geneva, 1996.
26. “ICH Guidelines Validation of Analytical Procedures; Definitions and
Terminology”, Federal Register, 60, IFPMA, Switzerland, 1995, 1260.
27. Heyden YV, Nijhuis A, Verbeke JS, Massart DL, “Guidance for
Robustness/Ruggedness Tests in Method Validation”, University of
Brussels, Belgium, 1997, pp. 1 – 48.
28. Method Validation Guideline,
www.reagecon.com/techpapers/guidemethodvalidation.pdf
29. Jenke DR, “Chromatographic method validation: A review of current
practices and procedures II, Guidelines for primary validation parameters”,
J. Liq. Chromatogr., 1996, 19, 737-57.
30. ICH, Guidance for Industry, "Q1A Stability Testing of New Drug
Substances and Products", ICH-Q1A, 2001.
31. Kim HB. Handbook of Stability Testing in Pharmaceutical development,
March 1971, pp 98-103.
32. FDA, Guidance for Industry, "Analytical Procedures and Methods
Validation: Chemistry, Manufacturing, and Controls Documentation", Draft
Guidance, 2000.
33. ICH, Guidance for Industry, Q1B "Photo stability Testing of New Drug
Substances and Product", ICH-Q1B, 1996.
34. ICH, Guidance for Industry, Q6B. "Specifications: Test Procedures and
Acceptance Criteria for Bio-technological/Biological Products", ICH-
Q6B, 1999.
35. ICH, "Final Guidance on Stability Testing of
Biotechnological/Biological Products, Availability", Federal Register
61FR, 1996, pp. 36466-9.
36. Reynolds DW, Available guidance and best practices for conducting
forced degradation studies, Pharmaceutical Technology, 2002.
37. “ICH Harmonized Tripartite guideline, validation of analytical
procedures: text and methodology, Q2 (R1)”, 1994.
38. Carstensen JT, Rhodes CT, Drug stability principles and practices,
Marcel Dekker, Inc. 2008, 3, pp: 329-84.
39. Smela MJ, “Regulatory Considerations for Stability Indicating
Analytical Methods in Drug Substance and Drug Product Testing”,
America.
40. "propafenone- drug profile" May 14, 2013
http://www.drugs.com/mtm/propafenone.html
41. "Propafenone- drug profile" April 17, 2013
http://www.fda.gov/medwatch
42. "propafenone- drug profile" February 08, 2013
http://www.drugbank.ca/drugs/DB01182
43. "propafenone-drug profile" May 18, 2013
http//en.pubchem.org/pub/propafenone
44. European Pharmacopoeia, 7th edition, European directorate for quality
of medicine & healthcare, 2008 : 2103
45. United States Pharmacopoeia-30, National Formulary-25, Asian edition
the united state pharmacopoeia, convention Rockville, MD, 2007.
46. British Pharmacopoeia, The department of health, Social Service
&Public Safety, 2009.
47. Hoyer GL, “A HPLC method for the quantitation of propafenone and 5-
hydroxy propafenone.” Chromatographia, 1988, 25(12), 1034-1038.
48. Kern R, “Internally standardized simultaneous assay of propafenone
and 5-hydroxypropafenone enantiomers in human plasma by means of
high performance liquid chromatography” Methods Find Exp. Clin.
Pharmacol. 1994, 16(3), 203-10.
49. Sharma N, Walode S, Tambole R, ” Quantitation of Propafenone HCl
in presence of its Degradation product by RP-HPLC: Application to
Pharmaceutical Dosage form” J. Pharma. Res, 2013, 2(8),6-11
50. Dhandapani B, Keerthi J, Naik MB, “Spectrometric Estimation of
Propafenone in Bulk drug and its Pharmaceutical formulation” Int. J.
Pharma. Bio. Res. 2010,1(1),49-53
51. Sharma N, Walode S, “HPTLC method development and validation for
the estimation of Propafenone Hydrochloride in tablet dosage form.” J.
Pharma. Res. 2013, 2(8),12-16
52. Jadhav ML, “Implementation of QbD Approach to the Analytical
Method Development and Validation for the Estimation of Propafenone
Hydrochloride in Tablet Dosage Form” Chromatogr. Res. Int., 2013,
1-9
53. Afshar M, Rouini M, “A rapid HPLC assay for the simultaneous
determination of propafenone and its major metabolites in human
serum.” Anal. Sci. 2004, 20(9), 1307-1311.
54. Chan GL, Axelson JE, Abbott FS, “Determination of propafenone in
biological fluids by fused-silica capillary gas chromatography using
electron-capture detection.” J. Chromatogr., 1987, 417(2), 295-308.
VAIBHAV presentation final

VAIBHAV presentation final

  • 1.
    THESIS PRESENTED ON StabilityIndicating Method Development and Validation for Assay of Propafenone in Extended Release Capsule Dosage Form Presented by: Vaibhav S.Bhatt M. Pharm(Sem IV) Quality Assurance 122080904015 Industrial Guide: Mr. Hemang Parikh Group leader , ADL-US Zydus Cadila Guided by: Mr. Hiren kadikar M.pharm Asst. Professor (Q.A) ARIHANT SCHOOL OF PHARMACY & BRI Uvarsad Crossroad, S.G. Highway, Adalaj, Dist. Gandhinagar-382421, Gujarat
  • 2.
  • 3.
    Arrhythmia is anabnormality of rate, origin or conduction or spread of cardiac impulses. The rhythm of the heart is determined by the generation of an impulse by some pacemaker cell, and the conduction of that impulse to the rest of the heart. Disturbances in cardiac rhythm are a result of abnormalities in impulse initiation, or conduction, or both. Arrhythmias are of various types :- • Ventricular arrhythmia • Supraventricular arrhythmia • Paroxysmal tachycardia • Atrial flutter • Atrial fibrilation • Ventricular flutter • Ventricular fibrilation Propafenone is mainly useful in Supraventricular Arrhythmias. ARRHYTHMIA
  • 4.
    1. Class Iagents sodium channel blockers:- A. Intermediate channel binding and recovery:- Quinidine, procainamide, Disopyramide B. Rapid channel binding and recovery :- lidocaine, Mexiletine, Tocainide C. Slow channel binding and recovery:- Propafenone, flecainide 2. Class II beta blockers:- Propranolol, Esmolol, Acebutolol, sotalol 3. Class III potassium channel blockers:- Amiodarone, Bretylium, Ibutilide, Dofetilide 4. Class IV calcium channel blockers:- verapamil , diltiazem CLASSIFICATION
  • 5.
    HPLC Performance Liquid Chromatography(HPLC) is one of the most used analytical techniques due to its simplicity, high specificity and wide range of sensitivity. Most of the drugs in multi component dosage forms can be analyzed by HPLC method because of the several advantages like rapidity, specificity, accuracy, precision and ease of automation in this method. The separation of compounds is due to their relative differences in travel through column on application of pressure exerted through mobile phase for carrying liquid. The compounds of the mixture travel with different rates due to their relative affinities with the solvent and stationary phase. Compound with higher affinity towards stationary phase of the column travels slowly and vice-versa.
  • 6.
    VALIDATION Validation of analyticalmethod is defined as the process by which it is established, by laboratory studies, that the performance characteristics of the method meet the requirements for the intended analytical application. It is the documented evidence that provides high degree of assurance that the given method , process or procedure will consistently produce the product which will meet the pre- determined specification. The objective of validation of an analytical procedure is to demonstrate that it is suitable for its intended purpose.
  • 7.
    VALIDATION PARAMETERS  Accuracy Precision  Specificity  Linearity  Range  Robustness  Limit of detection  Limit of quantification
  • 9.
    Stability Indicating AssayMethod (SIAM) ICH harmonized Tripartite Guideline described Stability Testing of New Drug Substances and Products [ICH Q1AR2]. According to ICH Q1AR2, SIAM defined as “Method which is reliable, meaningful and specific means the content of active ingredients, degradation products and other contents of interest in a drug product can be accurately measured without interference.” According to US-FDA stability guideline of 1998, SIAM defined as, “Validated quantitative analytical methods that can detect the changes with time in the chemical, physical, or microbiological properties of the drug substance and drug product, and that are specific so that the contents of active ingredient, degradation products, and other components of interest can be accurately measured without interference”
  • 10.
    OBJECTIVES OF STABILITYTESTING To provide evidence on how the quality of a drug substance or drug product varies with time under the influence of a variety of condition. To determine structural transformation of the drug substance and drug product. To determine lowest possible conc. of potential degradation products. To establish the retest period for the drug substance. To determine the shelf life of the drug product. To propose the recommended storage conditions. To provide assurance to the patients.
  • 11.
    STRESS TESTING CONDITIONS •Acid stress testing • Base stress testing • Peroxide stress testing • Thermal stress testing • Humidity stress testing • Photo stability
  • 12.
  • 13.
    Name of drugPropafenone Structure Mol. formula C21H27NO3.HCL Mol. Wt. 377.92 CAS No. 54063-53-5 IUPAC name 1-{2-[2-hydroxy-3(propylamino)-propoxy]phenyl}-3- phenylpropan-1-one Description Propafenone hydrochloride is a colourless crystals to white fine crystalline powder with a bitter taste. Solubility It is slightly soluble in alcohol and chloroform. It is very slightly soluble in acetone. It is soluble in methanol and hot water. It is insoluble in diethyl ether and toluene.
  • 14.
    Melting point 173°C- 176oC pKa 8.91 Dosage forms Tablet, Capsule, Injection and Suspension. Dispensing and Storage Dispense in a tight light-resistant container. Store at 20°–25°C (68°–77°F). Mechanism of action Propafenone HCL is a sodium channel protein inhibitor. Propafenone works by slowing the influx of sodium ions into the cardiac muscle cells, causing a decrease in excitability of the cells Propafenone differs from the prototypical class Ic antiarrhythmic in that it has additional activity as a beta- adrenergic blocker which can cause bradycardia and bronchospasm . Mainly used for supraventricular arrhythmias.
  • 15.
    Pharmacokinetics Absorption: FromG. I. Tract Distribution: 97% drug bound to plasma protein. Metabolism: Metabolized primarily in the liver where it is rapidly and extensively metabolized to two active metabolites, 5-hydroxypropafenone and N- depropylpropafenone. These metabolites have antiarrythmic activity comparable to propafenone but are present in concentrations less than 25% of propafenone. Excretion: Approximately 50% of propafenone metabolites are excreted in the urine following administration of immediate release tablets. Volume of distribution : 252 Lit.
  • 16.
  • 17.
    Sr. No. Source Method DescriptionRef No. 1 EP 2008 Assay by potentiometric titration Dissolve 0.3 g in 2 ml of formic acid, add 50 ml of acetic anhydride , titrate with 0.1M perchloric acid potentiometrically, perfom blank. Each ml of 0.1M perchloric acid is equivalent to 377.92 mg of propafenone HCL. 44 2 EP 2008 Liquid chromatography M.P: Phosphate buffer pH 2.5: ACN (65:35) S.P: Octyl silyl silica gel column Flowrate: 1ml/min Detection: Uv detector at 222 nm 44 Official Methods for Propafenone
  • 18.
    3 USP30 NF-25 Assay by potentiometric titration Dissolve0.250 g in 30 ml of methanol, add 15 ml of mercuric acetate, titrate with 0.1M perchloric acid potentiometrically. Each ml of 0.1M perchloric acid is equivalent to 377.92 mg of propafenone HCL 45 4 USP30 NF-25 Liquid chromatography S.P: Octyl silyl silica gel column M.P: Ammonium sulphate buffer: ACN (16:9) Flowrate: 1ml/min Detection: UV detector at 222 nm 45 5 USP30 NF-25 Gas chromatography Career gas: Helium S.P: Silica coated with polymethylsiloxane Detection: Flame ionisation detactor 45
  • 19.
    6 BP 2012 Assay by potentiometric titration Dissolve0.3 g in 2 ml of formic acid, add 50 ml of acetic anhydride, titrate with 0.1M perchloric acid potentiometrically, perfom blank. Each ml of 0.1M perchloric acid is equivalent to 377.92 mg of propafenone HCL 46 7 BP 2012 Liquid chromatography M.P : Phosphate buffer PH 2.5: ACN(65:35) S.P : Octyl silyl silica gel column Flowrate : 1ml/min. Detection : Uv detector at 222 nm 46
  • 20.
    Sr. No. Drug/ Dosage Form/ Matrix DescriptionRef No. 1 Propafenone and 5- hydroxy Propafenone in pharmaceutical formulation S.P : 25×0.4 cm 5 μm ODS column. M.P: 0.1 M di potassium hydrogen phosphate (K2HPO4) buffer (pH 2.5) and acetonitrile (63:37) Detection: UV detection at 249 nm. Rt: Retention times of the internal standard, propafenone, and 5-OH propafenone are 4.3, 6.0 and 2.9 minutes respectively. 47 2 Propafenone and 5- hydroxypropafenone enantiomers in human plasma S.P : Toluene : diethyl ether phase (9:1). M.P : silica gel column using N-tert-Boc- (L)-proline as the chiral additive to the mobile phase. Detection : UV detection at 249nm. 48 Reported methods for Propafenone
  • 21.
    3 Propafenone HCL inpresence of its Degradation product in Pharmaceutical Dosage form S.P: ODS (250 X 4.6 mm, 5μm) column M.P: 0.01 M potassium dihydrogen phosphate (pH 3.0) : ACN 65:35 (v/v) Flowate: 1.0 mL/ min Detection: UV detection at 249 nm. Rt: 7.41 min 49 4 propafenone in bulk drug and it’s pharmaceutical formulation. Method A: Extractive Spectrophotometric estimation , propafenone was estimated at 301 nm using ethanol as a solvent & linearity was observed in the conc. range of 20 - 200 μg /ml. Method B: Hydrotropic method , propafenone was estimated at 301 nm using diphenhydramine citrate as a solvent & linearity was observed in the conc. range of 15 - 150 μg /ml. 50 5 Propafenone Hydrochloride in tablet dosage form S.P : Aluminum plate 10 × 10 & 20 × 10 cm) with 250 μm thickness. M.P: Chloroform : methanol : ammonia (8 : 2 : 0.2 v/v). Rf value: 0.49 51
  • 22.
    6 Propafenone HCL intablet dosage form. HPTLC method S.P: precoated aluminium backed TLC plate (10 cm x 10 cm). M.P: methanol : ethyl acetate : triethylamine (1.5 : 3.5 : 0.4 v/v/v) Scaning time: 10 min. Detecion: UV at 250 nm. 52 7 Propafenone and Its Major Metabolites in Human Serum S.P: C18 column (25 × 0.46 cm i.d., 5 µm) M.P: ACN : phosphate buffer gradient at a flow rate of 1.7 ml min-1. Detection: UV at 210 nm. 53 8 propafenone in biological fluids Gas-liquid chromatographic method. S.P : 25 m × 0.31 mm cross linked , phenyl methyl silicone coated fused-silica capillary column was employed for all analyses. Conc.range : 10-100 ng/ml 54
  • 23.
  • 24.
    • The reviewof literature reveals that Stability Indicating HPLC and HPTLC method is developed for estimation of Propafenone HCL in bulk and solid dosage form. • Generally, majority of analysis in industries are done on HPLC. • Propafenone HCL is available in the market with Brand name RHYTHMOL. • Propafenone mainly used for Supraventricular tachycardia. • My goal is to developed more accurate, precise and efficient stability indicating HPLC method than the available one. • The Stability of Capsule formulation in acid/base, thermal/humidity, oxidation, light, etc. is more important. • So area of interest is to Develop and Validate Simple, Accurate, Precise and Economic stability indicating RP-HPLC method for estimation of propafenone in capsule formulations as per ICH guideline. • To perform Forced degradation study as per ICH guidelines.
  • 25.
    SUMMARY OF PSARREPORT Sr. No. Patent Application number Title of Patent 1 IB2009/007126 Propafenone extended release composition 2 11/146006 Sustained release propafenone hydrochloride capsules 3 PCT/CA2005/000863 Propafenone hydrochloride capsules containing microtablets 4 12/419790 Novel Antiarrhythmic Drug Formulations 5 07/189544 Long lasting composition of propafenone and quinidine for treatment of cardiac conditions Novelty of Project: Looking at above 5 patents the dissertation title is 50-75% novel.
  • 26.
    •Propafenone HCL isavailable in the market with Brand name RHYTHMOL & mainly used for Supraventricular tachycardia. •The Stability of Capsule formulation in acid/base, thermal/humidity, oxidation, light, etc. is more important. •Stability Indicating HPLC and HPTLC method is developed for estimation of Propafenone HCL in bulk and solid dosage form. •So area of interest is to Develop and Validate better , different and precise stability indicating method for estimation of propafenone in capsule formulations as per ICH guideline.
  • 27.
  • 28.
    • Day today numbers of newer drugs and their formulations either in single or in combined dosage forms are marketed. Drug analysis plays a vital role in drug product design, development, and manufacturing. This analysis provides assurance that the product meets the established quality requirement. • Though Stability indicating HPLC and HPTLC methods are available for estimation of Propafenone, my goal is to developed more accurate, precise and efficient stability indicating HPLC method than the available one. • To develop a simple and accurate HPLC method for the determination of Propafenone HCL in Propafenone HCL Extended release capsules. • Validation of the developed method. • To carry out forced degradation study of Propafenone HCL according to ICH guideline Q1A(R2).
  • 29.
  • 30.
    Melting Point StandardObserved Propafenone 173oC - 176oC 176.78oC IDENTIFICATION OF SAMPLE BY MELTING POINT (44) DSC of Propafenone
  • 31.
    IDENTIFICATION OF SAMPLEBY IR SPECTRUM Reference IR spectrum of propafenone IR spectrum of sample IDENTIFICATION OF SAMPLE BY IR SPECTRUM
  • 32.
    PROCEDURE FOR RECORDINGIR SPECTRUM •Mix 3 mg of sample with 900 mg Kbr, grind the mixture and record IR absorption spectrum between 3800 cm-1 to 650 cm-1 using air as a reference. •The IR absorption spectra of sample exhibit maxima, which are only at the same wavelength in the spectrum of propafenone USP working standard prepared in the same manner. •So it is identified that the given sample is propafenone.
  • 33.
    Functional Group IRFrequency (Cm-1) C-C 1186 C=C 1651 C-H (S) 2939 C-H (B) 1328 CH2 (S) 1369 CH2 (B) 1485 CH3 (B) 1398 C-O 1100 C=O 1695 N-H 3417 O-H 3319 Aromatic Ring 910 Interpretation of IR Spectra
  • 34.
  • 35.
    Sr. No InstrumentMake Model 1. HPLC Waters 2862 2. ANALYTICAL BALANCE Mettler Toledo XR205SM-DR 3. PH METER Lab India 420 A+ 4. MILLI Q WATWR SOURCE Thermofisher scientific Branstead D3750 5. INJECTOR Rhenodyne valve with 20μl fixed loop - 6. PUMP Quaternary pump - 7. DETECTOR UV detector PDA detector - 8. HOT AIR OVEN Lab line Cintex-906 9. SONICATOR Roop telesonic Branson 2510
  • 36.
  • 37.
    No. Name GradeSource/Supplier 1 Water HPLC Nanopure Diamond water Purification 2 Di potassium hydrogen phosphate AR Merck 3 Orthophosphoric acid HPLC Spectrochem 4 Acetonitrile HPLC Rankem 5 Hydrochloric acid AR Merck 6 Sodium hydroxide AR Merck 7 Hydrogen peroxide AR Merck
  • 38.
    Buffer preparation • Dissolve 5.2gm of K2HPO4 anhydrous in 2000 ml of Water, and adjust the pH 2.5 with Orthophosphoric acid (OPA). • Filter the solution through 0.45 μ nylon filter and degas before use. Mobile phase • Prepared a mixture of 600 ml of Buffer and 400 ml of Acetonitrile. • Adjust pH 2.5 with diluted Orthophosphoric acid (OPA). Diluent • Milli-Q water : Acetonitrile (60:40) PREPARATION OF SOLUTIONS
  • 39.
    Standard preparation: (100μg/ml): 100 mg of Propafenone hydrochloride standard to 100 ml volumetric flask. Add 70ml of diluent and sonicate to dissolve. Dilute 5ml of this solution to 50ml with diluent. Make volume up to mark with diluents and mix. Equivalent to 500 mg of Propafenone hydrochloride powder to 250 ml volumetric flask. Add 150ml of diluent and sonicate to dissolve for 30 min. Dilute 5ml of this solution to 100ml with diluent. Make volume up to mark with diluents and mix. Sample Preparation: (100 μg/ml):
  • 40.
  • 41.
    Selection of DetectionWavelength UV spectra of Propafenone HCl •The standard Propafenone solution in diluent (100 μg/ml) was analyzed in the UV region of 200-400 nm and the spectrum was recorded. The detection wavelength for propafenone HCl was found to be 249 nm.
  • 42.
    TRIALS FOR MOBILEPHASE OPTIMIZATION
  • 43.
    Trial No. Mobile Phase Retention Time(min) Remarks 1. Water : Methanol (60:40) 0.824 Early elution, Poor peak symmetry 2. Water : Methanol (70:30) 0.881 Early elution, Poor peak symmetry 3. Water : ACN (60:40) 1.250 Early elution 4. Water : ACN (70:30) 1.925 Early elution 5. Buffer (KH2PO4, pH 6.8) : ACN (60:40) 10.625 Late elution 6. Buffer (KH2PO4, pH 4.5) : ACN(60:40) 5.167 Good Rt, Proper peak symmetry 7. Buffer (KH2PO4, pH 2.5) : ACN(60:40) 3.36 Effective Rt, Proper peak symmetry
  • 44.
    OPTIMIZED CHROMATOGRAPHIC CONDITION PARAMETERSSPECIFICATION Stationary Phase Inert ODS 3V C18 (250 X 4.6 mm), 5μ Flow rate 1.5 ml/min Wavelength 249 nm Injection volume 10 μl Coloumn oven temperature 45 °C Mobile phase Buffer (KH2PO4, pH 2.5) : ACN (60:40) Diluent Milli - Q water : ACN (60:40) Retention time 3.368 min Run time 10 min
  • 45.
  • 46.
  • 47.
    Degradation Condition Acid Hydrolysis15 ml 5N HCL Water Bath 90 0C 1 Hr Alkali Hydrolysis 15 ml 5N NAOH Water Bath 90 0C 1 Hr Peroxide Oxidation 15 ml 30% H2O2 Water Bath 90 0C 30 min Thermal Degradation 7 Days at 100 0C Photolytic Degradation 7 Days under UV light Humidity Degradation 7 Days at 40 0C / 75% RH DEGRADATION CONDITION
  • 48.
    Acid Degradation Chromatogram ofAcid Degradation (Placebo) Chromatogram of Acid Degradation (Standard) Chromatogram of Acid Degradation (Sample)
  • 49.
    Base Degradation Chromatogram ofBase Degradation (Placebo) Chromatogram of Base Degradation (Standard) Chromatogram of Base Degradation (Sample)
  • 50.
    Peroxide Degradation Chromatogram ofPeroxide Degradation (Placebo) Chromatogram of Peroxide Degradation (Standard) Chromatogram of Peroxide Degradation (Sample)
  • 51.
    Thermal Degradation Chromatogram ofThermal Degradation (Placebo) Chromatogram of Thermal Degradation (Standard) Chromatogram of Thermal Degradation (Sample)
  • 52.
    Photolytic Degradation Chromatogram ofPhotolytic Degradation (Standard) Chromatogram of Photolytic Degradation (Sample) Chromatogram of Photolytic Degradation (Placebo)
  • 53.
    Humidity Degradation Chromatogram ofHumidity Degradation (Placebo) Chromatogram of Humidity Degradation (Standard) Chromatogram of Humidity Degradation (Sample)
  • 54.
    DEGRADATION SUMMARY Degradation Condition Peak Area% Degradation Standard 796308 - Sample as such 762441 - Standard Sample Standard Sample Acid Hydrolysis 677983 641219 14.8 15.9 Base Hydrolysis 693882 681100 12.8 10.7 Peroxide Oxidation 633524 614778 20.4 19.3 Thermal Degradation 793506 757998 0.35 0.58 Photolytic Degradation 794228 759526 0.27 0.38 Humidity Degradation 795974 760939 0.05 0.20
  • 55.
    PEAK PURITY MATCH DegradationCondition Peak purity factor Acid Hydrolysis 999.953 Base Hydrolysis 999.925 Peroxide Oxidation 999.945 Thermal Degradation 999.916 Photolytic Degradation 999.958 Humidity Degradation 999.478
  • 56.
    •Based on theresults, obtained from the analysis of forced degraded samples using described method, it shows that there was no other co- eluting peaks of interference from recipients and degradation products due to variable stress components with the main peaks and the method was specific for the estimation of Propafenone HCl in presence of various degradants. •So previously described method can be used as stability indicating method for Assay of Propafenone HCl from its ER Capsule dosage forms. DISCUSSION
  • 57.
  • 58.
    100 mg ofPropafenone standard Dilute to 100 ml with diluent (1000 μg/ml) (LSS) Further dilute LSS up to 100 ml with diluent 25 μg/ml 2.5 ml to 100 ml 50 μg/ml 75 μg/ml 100 μg/ml 125 μg/ml 150 μg/ml 5 ml to 100 ml 7.5 ml to 100 ml 10 ml to 100 ml 12.5 ml to 100 ml 15 ml to 100 ml Preparation of solutions for linearity study
  • 59.
    Result of Linearity– Range study SR. NO CONCENTRATION (µg/ml) AREA (VOLTS) ± SD % RSD 1 25 189311 ± 750.798 0.39 2 50 396392 ± 2053.373 0.51 3 75 594183 ± 3739.276 0.62 4 100 787092 ± 5439.013 0.69 5 125 977668 ± 4363.375 0.44 6 150 1194025 ±8770.450 0.73
  • 60.
  • 61.
    PARAMETERS VALUE Linearity range25-150 µg/ml Regression equation Y= 7954.6 x – 6252.2 Correlation Co-efficient (R2) 0.999 Slope of curve 7954.6 Overlain Chromatogram of Propafenone HCl (25 - 150 µg/ml) Summary of linearity - range of Propafenone Hydrochloride
  • 62.
    Limit of Detection(LOD) – Limit of Quantification (LOQ) PARAMETERS VALUE LOD 0.04 µg/ml LOQ 0.12 µg/ml
  • 63.
    Preparation of solutionsfor recovery study Accuracy Level Weight of API (mg) Weight of Placebo (mg) Dilute to Volume With Diluent (ml) Accuracy Stock Solution (ml) Further Dilute to Volume with Diluent (ml) Final Conc. (μg/ml) 50% 250 20 250 5 100 50 100% 500 20 250 5 100 100 150% 750 20 250 5 100 150
  • 64.
    Set No. Accuracy level (%) Expected amountof Propafenone (μg/ml) Recovered amount of Propafenone (μg/ml) % Recovery Mean ± SD % RSD Set – 1 50 50 50.27 100.54 50.57 ± 0.31 0.61Set – 2 50 50.89 101.78 Set – 3 50 50.54 100.08 Set – 1 100 100 100.73 100.73 100.82 ± 0.59 0.59Set – 2 100 101.28 101.28 Set – 3 100 101.46 101.46 Set – 1 150 150 148.28 99.85 148.92 ± 0.79 0.53Set – 2 150 148.67 99.28 Set – 3 150 149.81 99.87 Result of Recovery study (n=3)
  • 65.
    Sr. No. Concentration (µg/ml) Area(Volts) 1. 100 788016 2. 100 796675 3. 100 785323 4. 100 789448 5. 100 782619 6. 100 792897 Mean AUC (n=6) 789163 SD (n=6) 5086.045 % RSD 0.64 Result of repeatability study (n=6)
  • 66.
    Sr. No. Concentration (µg/ml) MeanArea ± SD Area (Volts) 1 50 398136 ± 1837.267 0.46 2 100 789546 ± 4883.726 0.52 3 150 1197845 ± 8474.793 0.70 Result of Intra-day precision (n=3)
  • 67.
    Sr. No. Concentration(µg/ml) Mean Area ± SD Area (Volts) 1 50 395698 ± 2274.792 0.57 2 100 781392 ± 5363.155 0.68 3 150 1199025 ± 9364.180 0.78 Result of Inter-day precision (n=3)
  • 68.
    Specificity Chromatogram of blank(Diluent) Chromatogram of Placebo
  • 69.
    Chromatogram of Standardfor Propafenone Hydrochloride Chromatogram of Sample for Propafenone Hydrochloride
  • 70.
    •In the specificitystudy, Blank, placebo and standard and sample were injected into the system. •The chromatograms of blank and placebo do not show any interferences at the retention time of Propafenone Hydrochloride as it can be seen from respective chromatograms. •By computing peak purity of main peak using PDA detector, Standard and sample solution was analyzed as per proposed method. Analysis was replicated for six times. Peak purity factor was found to be 999.888 for Propafenone Hydrochloride. Result of specificity study by peak purity is depicted in table .
  • 71.
    Sr. No. Concentration (µg/ ml) Peak PurityMean Peak Purity 1. 100 999.888 999.888 2. 100 998.783 3. 100 999.574 4. 100 998.462 5. 100 998.812 6. 100 999.894 Result of specificity study
  • 72.
    Robustness Robustness of methodwas studies by small but deliberate change in chromatographic condition as below: i. Change in Flow rate : 1.4 ml/min, 1.6 ml/min ii. Change in mobile phase composition : Acetonitrile : Phosphate buffer (pH 2.5) (62:38, 58:42 %v/v) iii. Change in pH : 2.3, 2.7 iv. Change in wavelength : 247 nm, 251 nm v. Change in temperature : 40ºC, 50ºC
  • 73.
    Result of Changein Flow Rate Sr. No. Flow Rate: 1.4 ml/ min Area (Volts) Flow Rate: 1.6 ml/ min Area (Volts) 1. 931558 701947 2. 938876 712698 3. 933569 704589 4. 933548 705489 5. 939958 708268 6. 934498 713589 Mean AUC (n=6) 935334 707764 SD (n=6) 3322.325 4639.455 % RSD 0.35 0.65
  • 74.
    Result of Changein Mobile Phase composition Sr. No. Buffer (KH2PO4, pH 2.5) : ACN (62 : 38 % v/v) Area (Volts) Buffer (KH2PO4, pH 2.5) : ACN (58 : 42 % v/v) Area (Volts) 1. 811161 800139 2. 815487 808698 3. 816984 813257 4. 814581 801936 5. 813259 807854 6. 819589 809359 Mean AUC (n=6) 815178.166 806873.833 SD (n=6) 2931.887 4918.320 % RSD 0.35 0.61
  • 75.
    Result of Changein pH Sr. No. pH : 2.3 Area (Volts) pH : 2.7 Area (Volts) 1. 812937 830698 2. 814589 838579 3. 813957 836987 4. 812698 843597 5. 817598 831458 6. 818589 842985 Mean AUC (n=6) 815061.333 837384 SD (n=6) 2466.572 5502.331 % RSD 0.30 0.65
  • 76.
    Result of Changein Wavelength Sr. No. ƛmax: 247 nm Area (Volts) ƛmax: 251 nm Area (Volts) 1. 775896 728589 2. 773698 726699 3. 774589 726486 4. 772689 726458 5. 771893 724589 6. 776983 711364 Mean AUC (n=6) 774291.666 724030.833 SD (n=6) 1928.259 4442.863 % RSD 0.25 0.61
  • 77.
    Result of Changein Temperature Sr. No. Temperature : 40 °C Area (Volts) Temperature : 50 °C Area (Volts) 1. 774404 771226 2. 771268 776751 3. 772940 774638 4. 770291 780947 5. 774853 772120 6. 776944 783905 Mean AUC (n=6) 773449.333 776598.833 SD (n=6) 2451.902 5001.638 % RSD 0.31 0.64
  • 78.
    Hours Area (Volts) 4817192 8 815665 12 814968 16 812879 20 809587 24 807998 Mean AUC (n=6) 803048.166 SD (n=6) 3611.576 % RSD 0.44 Solution stability study
  • 79.
    Sr. No. Volume of sample discarded (ml) PVDF (0.45 µm) Nylon (0.45 µm) Area (Volts) Area (Volts) 1. Unfiltered 807689 818965 2. 1 805578 818457 3. 3 804547 806357 4. 5 803658 814798 5. 7 801946 812658 6. 10 800589 811457 Mean AUC (n=6) 804002 813782 SD (n=6) 2544.358 4723.367 % RSD 0.32 0.58 Filter compatibility study
  • 80.
    Sr. no. ParametersValue Obtained Standard Value 1. Retention time (Rt) 3.36 - 2. % RSD of area of six replicate injections 0.64 NMT 2.00 3. Mean Theoretical plates (N) or Column efficiency 4256 NLT 2000 4. Mean Tailing factor (As) or Symmetry factor 0.9 NMT 2.00 System suitability parameters
  • 81.
    Label Claim (mg)% Assay 425 101.1 100.5 101.4 101.5 101.1 Mean ± SD 101.1 ± 3255.256 % RSD 0.48 Analysis of marketed formulation Assay of Propafenone Hydrochloride (n=5)
  • 82.
    Sr. No. ParametersResults 1 Linearity (μg/ml) 25-150 2 Correlation Coefficient 0.999 3 Accuracy (% Recovery) 99.28 – 101.78 4 LOD (μg/ml) 0.04 5 LOQ (μg/ml) 0.12 6 Repeatability (% RSD) 0.64 7 Intra-day Precision (%RSD) 0.46 – 0.70 8 Inter-day Precision (%RSD) 0.57 – 0.78 9 Specificity Specific: No co-elution with main peak 10 Robustness Complies with the acceptance criteria 11 Solution Stability Study 12 Filter Compatibility Study 13 System Suitability study Validation parameters summary
  • 83.
    SUMMARY •For the Propafenonehydrochloride, isocratic method was developed by taking trials for the ratio of Water and methanol, water and acetonitrile, and then the ratio of buffer and acetonitrle. The ratio of buffer and acetonitrle were selected on the basis of good retention time and peak symmetry, it was finalized as Mobile Phase in the ratio of 60:40%v/v. •For the linearity and range, correlation coefficient value of the linearity curve should not be less than 0.995. Correlation coefficient value for the Propafenone hydrochloride was found to be 0.999, which is greater than 0.995. Hence, the method is linear within the range. •Accuracy was determined over the range from lowest sample concentration to highest concentration (i.e. from 50% - 150%). For each level, for the drug, % R.S.D was found in the range of 0.53 – 0.61 %, which is well within the acceptance criterion. Hence, the method is found to be accurate.
  • 84.
    •In order toshow the precision of the method, repeatability (System & Method Precision), intra-day precision and inter-day precision were checked. For the repeatability, % R.S.D of the six replicates of sample should not be more than 2%. The obtained % R.S.D was found to be 0.64 % for Propafenone hydrochloride, which is well within the limit of acceptance criteria. While for the intra-day precision and inter-day precision of the method, the % R.S.D was found in the range of 0.46 – 0.70 % and 0.57 – 0.78 % respectively. Hence, the method is found to be precise. •In order to show the stability of the method, specificity was carried out. After the specificity, it was observed that there was no interference of degradation products, placebo, with the main peak. Peak purity index was found to be greater than 990. All the results obtained were found within the acceptance criteria. Hence, the method can be termed as specific.
  • 85.
    •Robustness is performedto prove the efficiency of the method despite deliberate changes in the normal method conditions i.e. column oven temperature, flow rate, mobile phase pH, organic solvent composition, wavelength etc. According to the acceptance criteria, the % R.S.D should not be more than 2. The obtained % R.S.D was found to be in the range of 0.25 – 0.65 %. Therefore, it is within the acceptance criteria. Hence, the method can be termed as robust. •From the results obtained, it is obvious that the proposed method is applicable for the determination of Propafenone hydrochloride without interference and with good sensitivity. The results obtained indicate that the proposed method for the estimation of Propafenone hydrochloride is specific, rapid, linear, accurate, precise, and suitable for intended use. These merits suggest the use of the proposed method in routine and quality control analysis without interference from commonly encountered excipient.
  • 86.
  • 87.
    1. Tripathi KD.Essentials of medical pharmacology; 5th Edn, Jaypee brothers medical publishers (p) Ltd, New Delhi: 2003; pp: 480. 2. Rang HP, Dale MN, Ritter JM. Rang & Dale’s Pharmacology; 6th Edn, Churchill Livingston publication, 2007, pp. 447-470. 3. Harvey RA, Champe PC. Lippincott’s Illustrated Reviews: Pharmacology; 4th Edn, Williams & Wilkins publishers, 2009; pp: 198-208. 4. Goodman and Gilman. The Pharmacological Basis of Therapeutics; 10th Edn, The McGraw Hill companies Inc, 2001, pp 843-845. 5. Mark RG. Clinical electrocardiography and arrhythmias, Massachusetts institute of technology, 2004. 6. Bheem, “Theory of HPLC”, Feb 2010, http://bheem.hubpages.com/hub/HPLC-theory-tutorial (accessed on 28/09/2013). 7. Hamilton RJ, Sevell PA. Introduction to HPLC; 2nd Edn, Chapman and Hall London, 1982, pp.189 8. Shukla R.S.Text book of Pharmaceutical Analysis; 3rd Edn, Rx Publications, Tirunelveil, 2006, pp: 18.3-18.6.
  • 88.
    9. “Reversed PhaseChromatography, Principle and Methods”, Amersham Bioscience,http://teachline.ls.huji.ac.il/72682/Booklets/AmershamRP CManual.pdf (accessed on 28/09/2013). 10. Sharma BK,. Instrumental methods of chemical analysis;19th Edn, Goel Publishing House, Krishna Prakashan Ltd, 2002, pp 1- 4. 11. Gurdeep RC, Anand SK. Instrumental methods of chemical analysis; 5th Edn, Himalaya publishing house, 2002, pp 2.624 to 2.630. 12. Willard HH, Merritt LL, Dean JA. Instrumental method of analysis; 7th Edn, CBS publication and distributors, 1986, pp 586 to 607. 13. Pavia DL, Lampman GM, Kriz GS. Introduction to Spectroscopy; 3rd Edn, Cengage publication, 2001, pp. 26 – 36. 14. Elena K, Roy E, Peter S, Neil M. Handbook of HPLC; CRC Publication, 1998 pp.293. 15. Snyder LR, Kirkland JJ, Glajch LJ. Practical HPLC Method Development; A Wiley Inter - Science publication, 1997, PP.266. 16. Michael WD. Morden HPLC for practicing scientists; John Wiley & Sons, Inc. publication, pp. 3 – 11.
  • 89.
    17. Shethi P.D.HPLC-Quantitative analysis of pharmaceutical formulations; CBS publishers & distributors, 3rd edition, 1997, pp: 182-184. 18. Lough WJ, Wainer IW. HPLC fundamental Principles and practices, Blackie Academic and professional, 1991, pp. 52-67 19. Jeffery G. H, Bassett J. Vogel’s Textbook of Quantitative Chemical Analysis; 5th edition, john wiley and sons, 1991, pp. 217-235. 20. Modern High Performance Liquid Chromatography (HPLC), http://www.chromatography–online.org/HPLC.html. 21. High Performance Liquid Chromatography for students, Faculty & Staff at George Mason University, http://www.gmu.edu/departments/SIRF/tutorials/hplc/hplc2.htm 22. Lindsay Sandy. HPLC by Open learning, John Wiley and Sons, London, 1991, 30-45. 23. Meyer VK. Practical High-Performance Liquid Chromatography; 4th Edn, John Willey & sons, 2004, pp. 159-175. 24. Szepei G. HPLC in pharmaceutical analysis; 2nd Edn, 1990, pp. 101-173.
  • 90.
    25. “ICH GuidelinesValidation of Analytical Procedures; Q2B Methodology”, International Conferences on Harmonization, Geneva, 1996. 26. “ICH Guidelines Validation of Analytical Procedures; Definitions and Terminology”, Federal Register, 60, IFPMA, Switzerland, 1995, 1260. 27. Heyden YV, Nijhuis A, Verbeke JS, Massart DL, “Guidance for Robustness/Ruggedness Tests in Method Validation”, University of Brussels, Belgium, 1997, pp. 1 – 48. 28. Method Validation Guideline, www.reagecon.com/techpapers/guidemethodvalidation.pdf 29. Jenke DR, “Chromatographic method validation: A review of current practices and procedures II, Guidelines for primary validation parameters”, J. Liq. Chromatogr., 1996, 19, 737-57. 30. ICH, Guidance for Industry, "Q1A Stability Testing of New Drug Substances and Products", ICH-Q1A, 2001. 31. Kim HB. Handbook of Stability Testing in Pharmaceutical development, March 1971, pp 98-103. 32. FDA, Guidance for Industry, "Analytical Procedures and Methods Validation: Chemistry, Manufacturing, and Controls Documentation", Draft Guidance, 2000.
  • 91.
    33. ICH, Guidancefor Industry, Q1B "Photo stability Testing of New Drug Substances and Product", ICH-Q1B, 1996. 34. ICH, Guidance for Industry, Q6B. "Specifications: Test Procedures and Acceptance Criteria for Bio-technological/Biological Products", ICH- Q6B, 1999. 35. ICH, "Final Guidance on Stability Testing of Biotechnological/Biological Products, Availability", Federal Register 61FR, 1996, pp. 36466-9. 36. Reynolds DW, Available guidance and best practices for conducting forced degradation studies, Pharmaceutical Technology, 2002. 37. “ICH Harmonized Tripartite guideline, validation of analytical procedures: text and methodology, Q2 (R1)”, 1994. 38. Carstensen JT, Rhodes CT, Drug stability principles and practices, Marcel Dekker, Inc. 2008, 3, pp: 329-84. 39. Smela MJ, “Regulatory Considerations for Stability Indicating Analytical Methods in Drug Substance and Drug Product Testing”, America. 40. "propafenone- drug profile" May 14, 2013 http://www.drugs.com/mtm/propafenone.html
  • 92.
    41. "Propafenone- drugprofile" April 17, 2013 http://www.fda.gov/medwatch 42. "propafenone- drug profile" February 08, 2013 http://www.drugbank.ca/drugs/DB01182 43. "propafenone-drug profile" May 18, 2013 http//en.pubchem.org/pub/propafenone 44. European Pharmacopoeia, 7th edition, European directorate for quality of medicine & healthcare, 2008 : 2103 45. United States Pharmacopoeia-30, National Formulary-25, Asian edition the united state pharmacopoeia, convention Rockville, MD, 2007. 46. British Pharmacopoeia, The department of health, Social Service &Public Safety, 2009. 47. Hoyer GL, “A HPLC method for the quantitation of propafenone and 5- hydroxy propafenone.” Chromatographia, 1988, 25(12), 1034-1038. 48. Kern R, “Internally standardized simultaneous assay of propafenone and 5-hydroxypropafenone enantiomers in human plasma by means of high performance liquid chromatography” Methods Find Exp. Clin. Pharmacol. 1994, 16(3), 203-10.
  • 93.
    49. Sharma N,Walode S, Tambole R, ” Quantitation of Propafenone HCl in presence of its Degradation product by RP-HPLC: Application to Pharmaceutical Dosage form” J. Pharma. Res, 2013, 2(8),6-11 50. Dhandapani B, Keerthi J, Naik MB, “Spectrometric Estimation of Propafenone in Bulk drug and its Pharmaceutical formulation” Int. J. Pharma. Bio. Res. 2010,1(1),49-53 51. Sharma N, Walode S, “HPTLC method development and validation for the estimation of Propafenone Hydrochloride in tablet dosage form.” J. Pharma. Res. 2013, 2(8),12-16 52. Jadhav ML, “Implementation of QbD Approach to the Analytical Method Development and Validation for the Estimation of Propafenone Hydrochloride in Tablet Dosage Form” Chromatogr. Res. Int., 2013, 1-9 53. Afshar M, Rouini M, “A rapid HPLC assay for the simultaneous determination of propafenone and its major metabolites in human serum.” Anal. Sci. 2004, 20(9), 1307-1311. 54. Chan GL, Axelson JE, Abbott FS, “Determination of propafenone in biological fluids by fused-silica capillary gas chromatography using electron-capture detection.” J. Chromatogr., 1987, 417(2), 295-308.