Download as PDF, PPTX
![7. Settlement Prediction
Predicting the settlement of shallow foundations
(particularly for Sands) is one of the best
applications of DMT.
Calculated by means of expression:
S = [ Δσv/MDMT ] ΔZ
Totani, Marchetti, Monaco &
Calabrese (2001)](https://image.slidesharecdn.com/dmtingeotech-170207060554/75/Use-of-DMT-in-Geotechnical-Design-with-Emphasis-on-Liquefaction-Assessment-19-2048.jpg)
![Cyclic Stress Ratio (CSR)
Youd et al. (2001)
rd = [1.0 – 0.00765z] (z ≤ 9.2m)
rd = [1.174 – 0.0267z] (9.2 < z ≤ 23m)
rd = [0.744 – 0.008z] (23 < z ≤ 30m)
rd = 0.5 (z > 9.2m)](https://image.slidesharecdn.com/dmtingeotech-170207060554/75/Use-of-DMT-in-Geotechnical-Design-with-Emphasis-on-Liquefaction-Assessment-29-2048.jpg)


![References
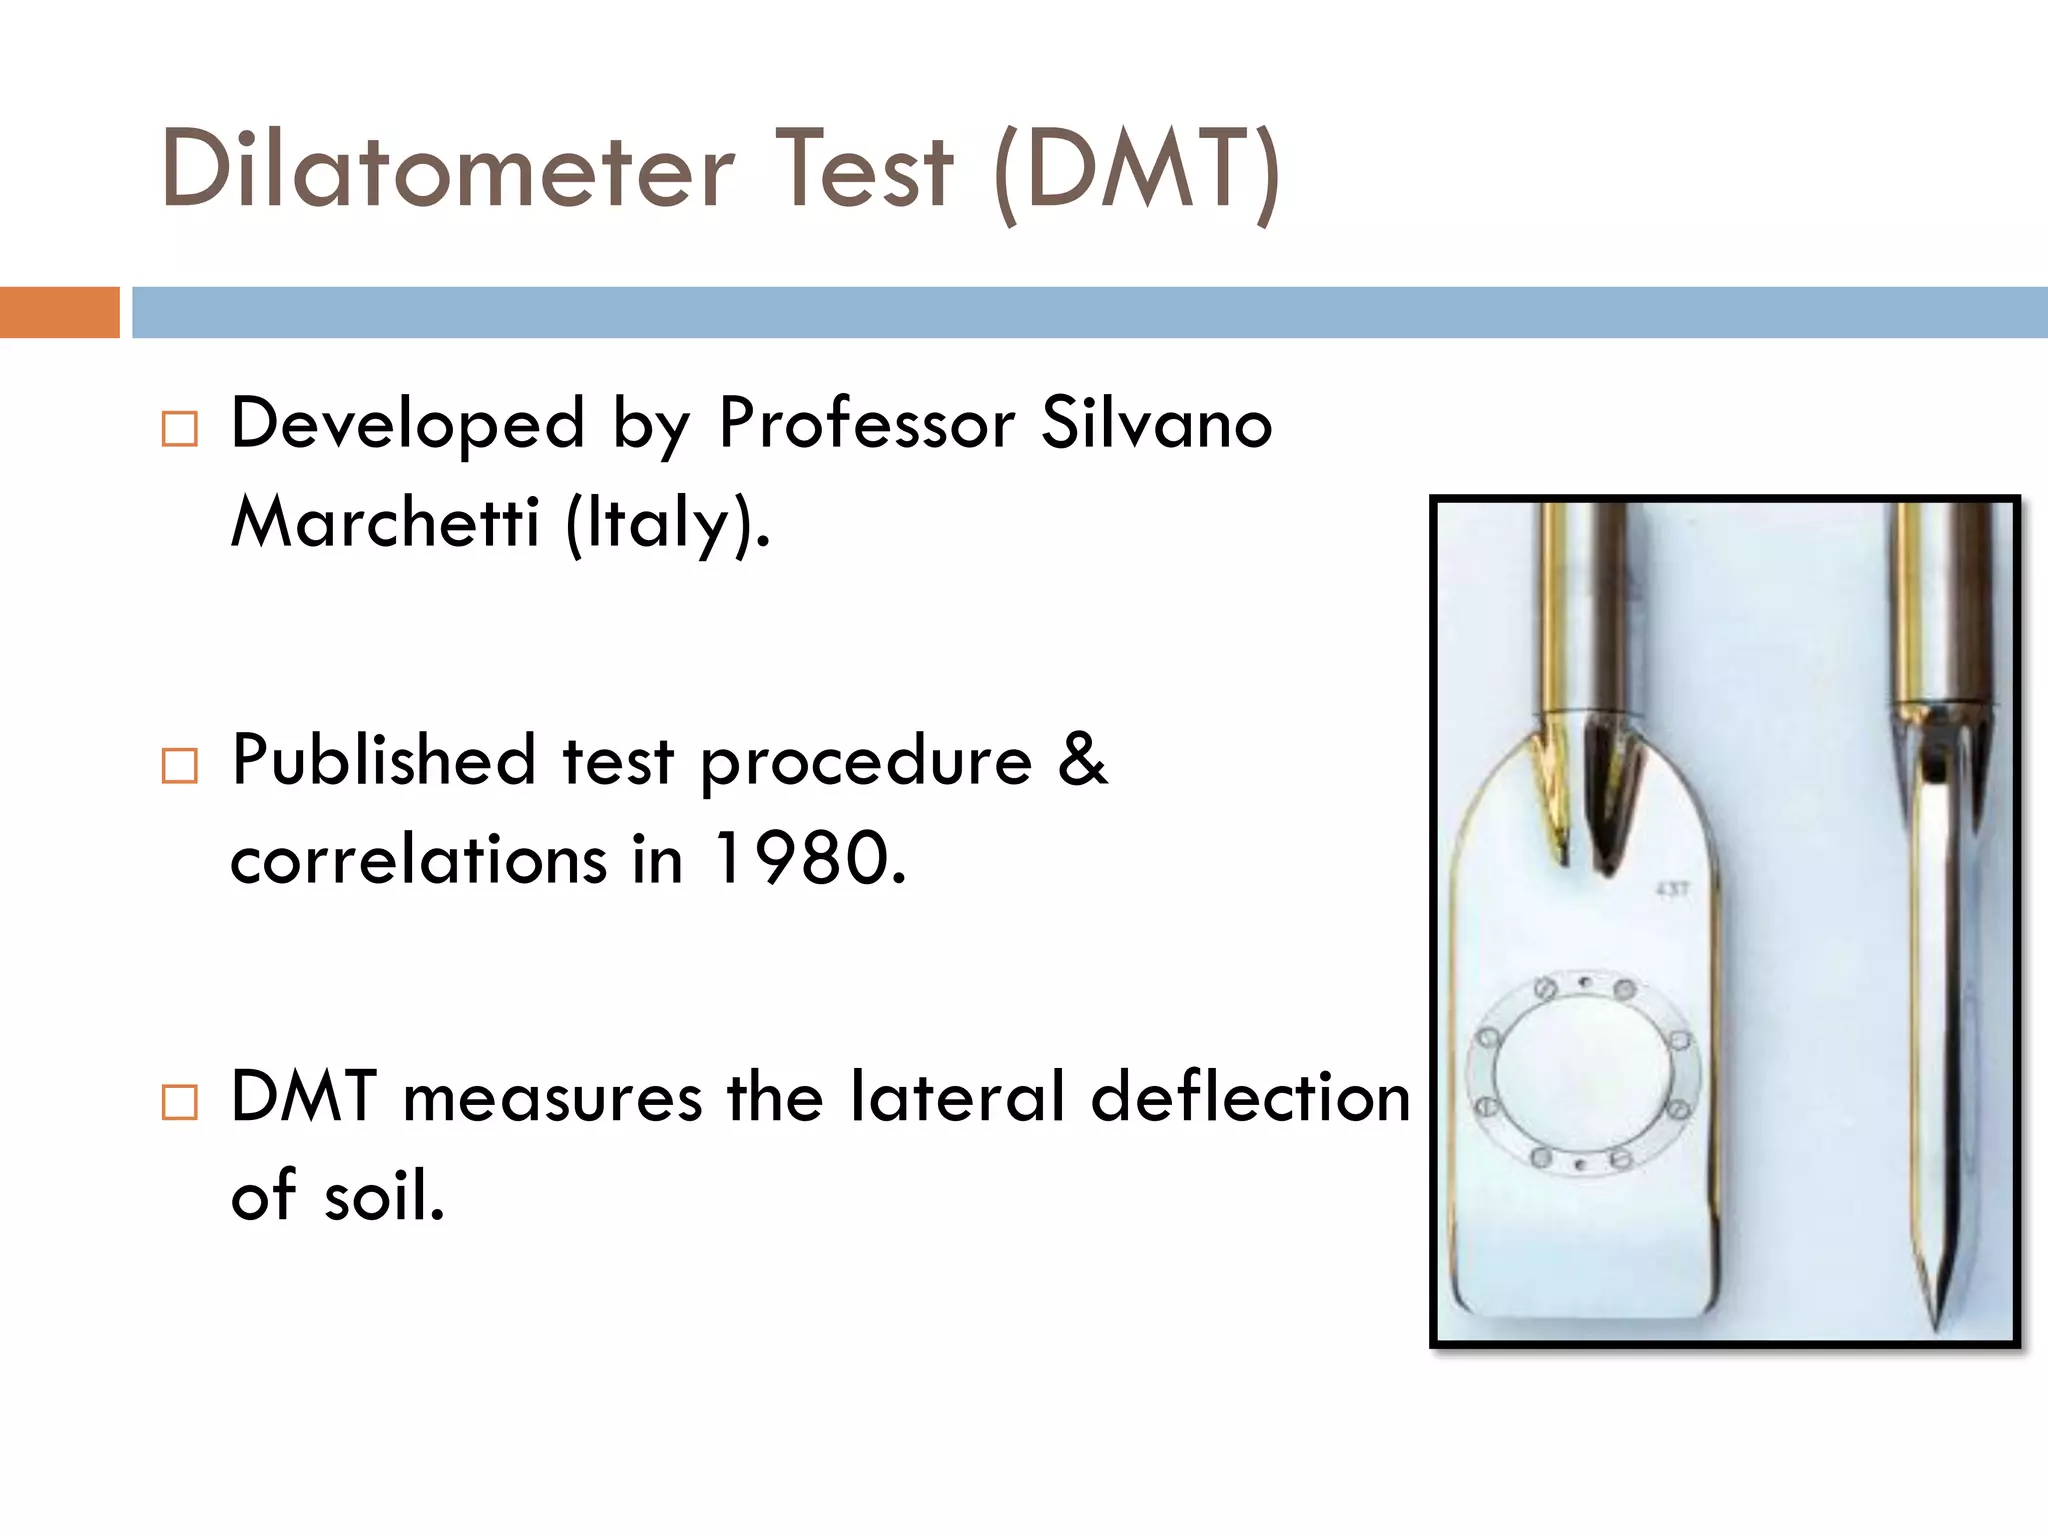
Marchetti, S. (1980). "In SituTests by Flat Dilatometer." J. Geotech. Engrg. Div.,
ASCE, 106, No.GT3, 299- 321.
G.Totani, S. Marchetti, P. Monaco & M. Calabrese. Use of Flat DilatometerTest
in Geotechnical Design, Intl. Conf. on In-situ Measurement of Soil Properties
(2001)
Monaco, P., Marchetti, S., Totani, G. and Calabrese, M. (2005). “Sand
liquefiability assessment by Flat DilatometerTest (DMT).” Proc. XVI ICSMGE,
Osaka, 4, 2693-2697
Robertson, P.K., and R.G. Campanella, [1986]. “Estimating liquefaction potential
of sands using the flat plate dilatometer. Geotech.Testing J.,Vol. 9, No. 1, pp. 38–
40.
Tsai,Tung and Lee (2001) . Performance of DMT based liquefaction evaluation
method on case history of Chi-Chi Earthquake
Bambang Setiawan,(2011) “Assessing Liquefaction Potential of Soils Utilizing In-
situTesting” M.ScThesis](https://image.slidesharecdn.com/dmtingeotech-170207060554/75/Use-of-DMT-in-Geotechnical-Design-with-Emphasis-on-Liquefaction-Assessment-49-2048.jpg)


The document discusses the use of the Dilatometer Test (DMT) in geotechnical design, particularly focusing on liquefaction analysis. It covers the key parameters of the DMT, data interpretation, correlations with soil behavior, and the assessment of liquefaction, including a case study of the Chi-Chi earthquake in Taiwan. The conclusions highlight the effectiveness of DMT for estimating soil parameters and its advantages in liquefaction assessment compared to traditional methods.
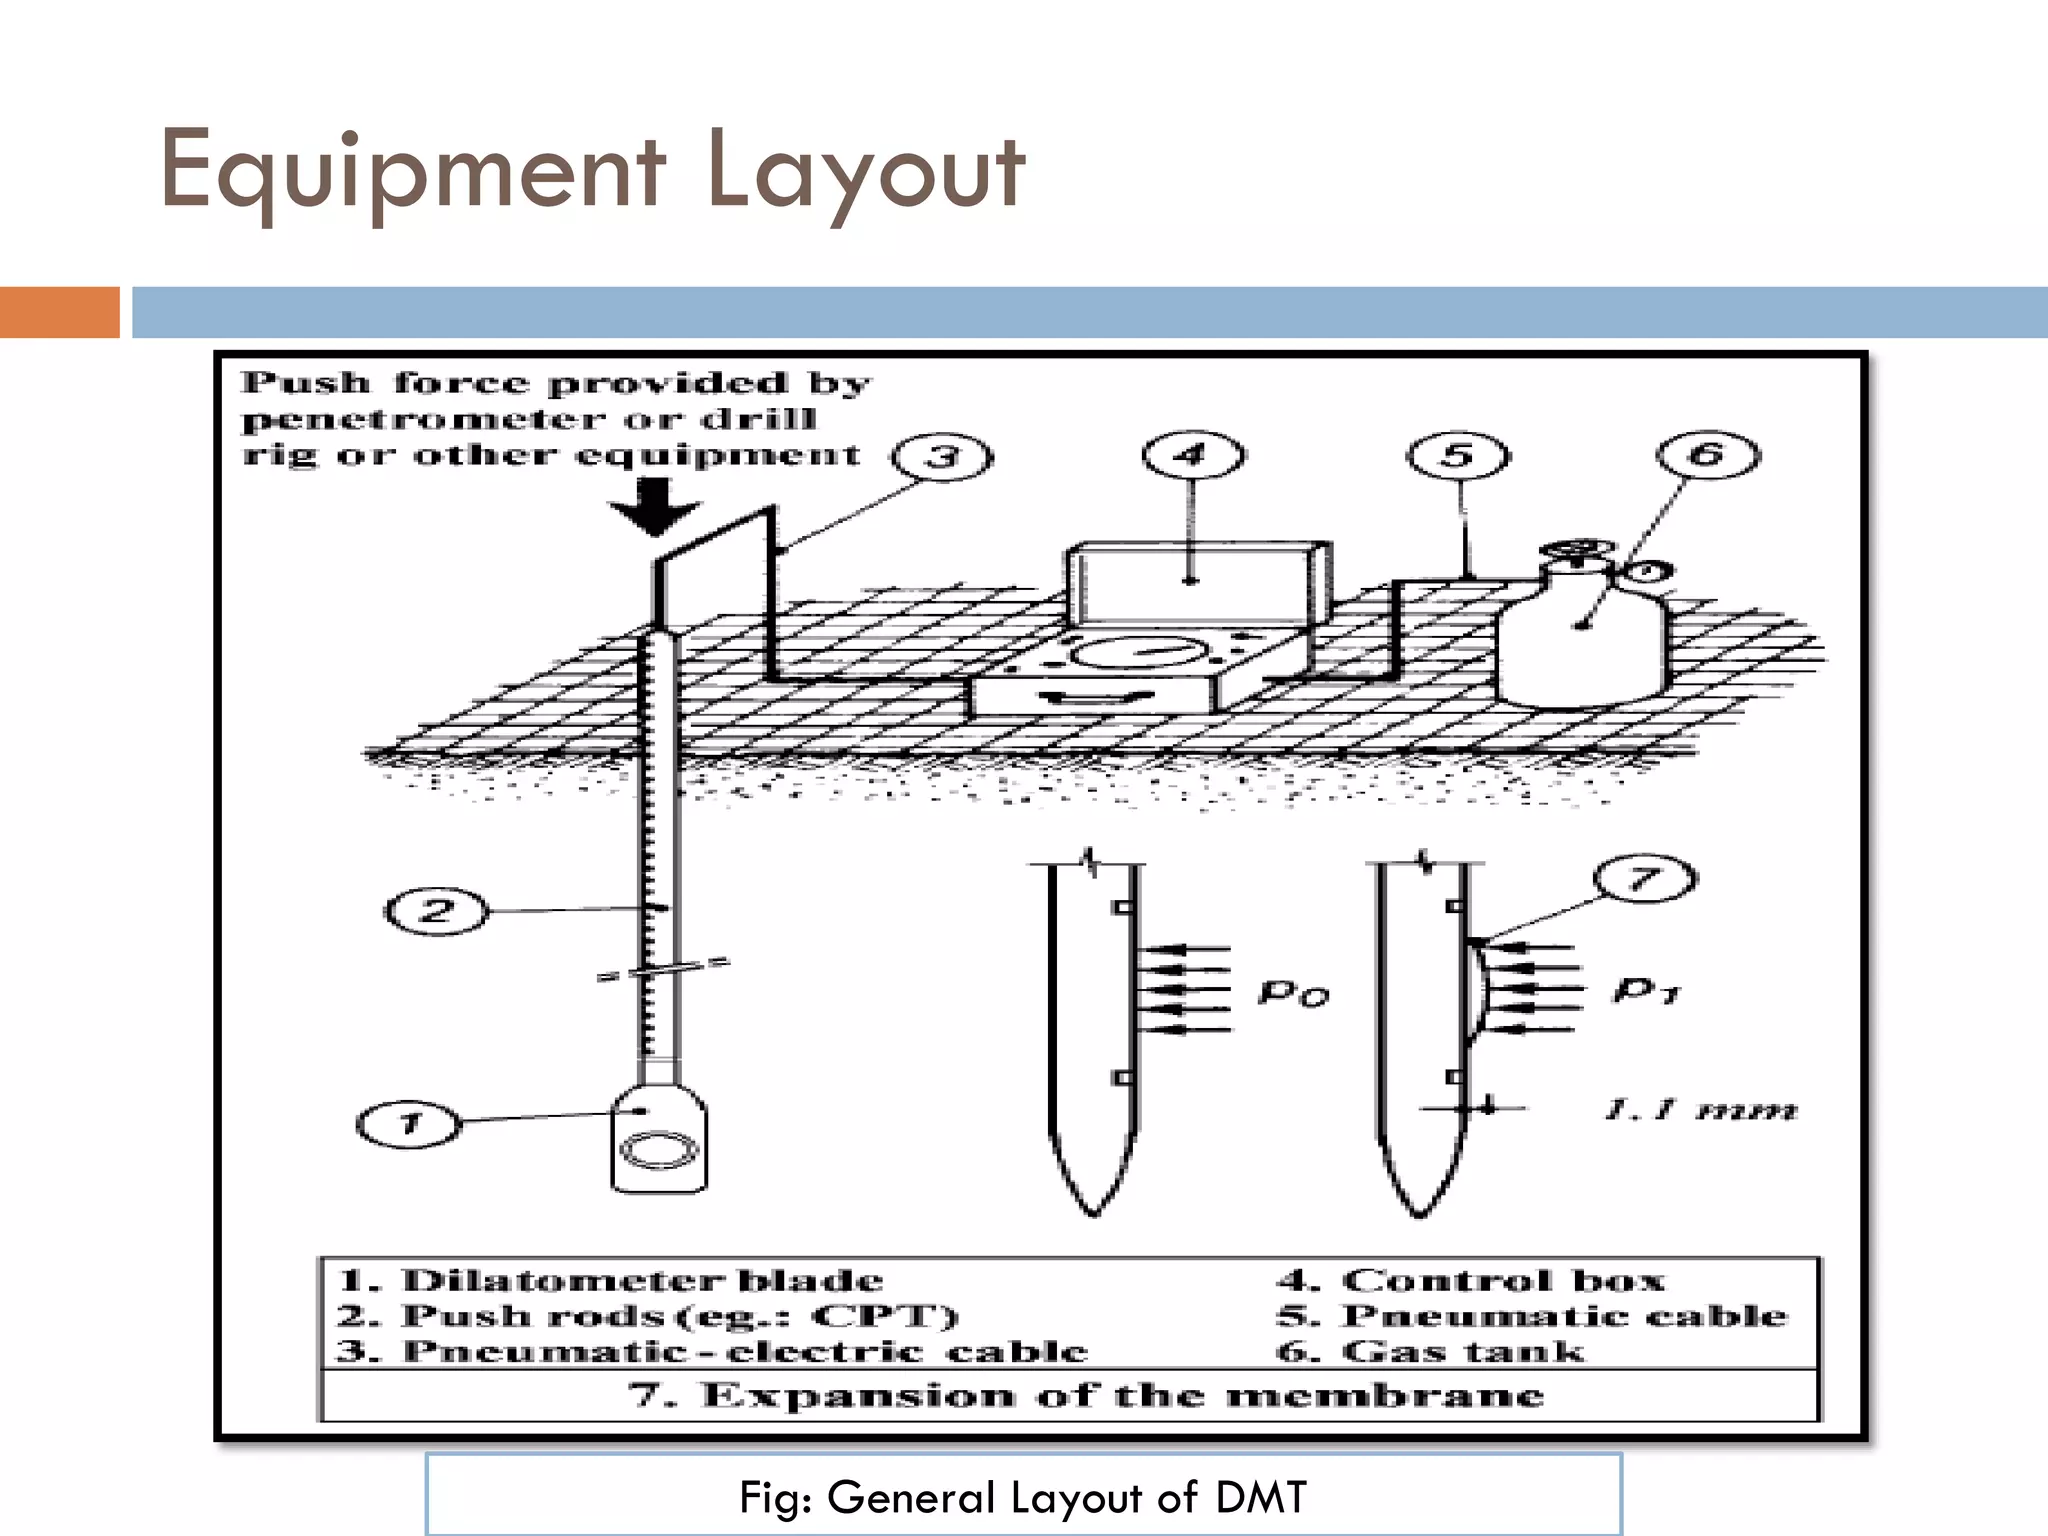
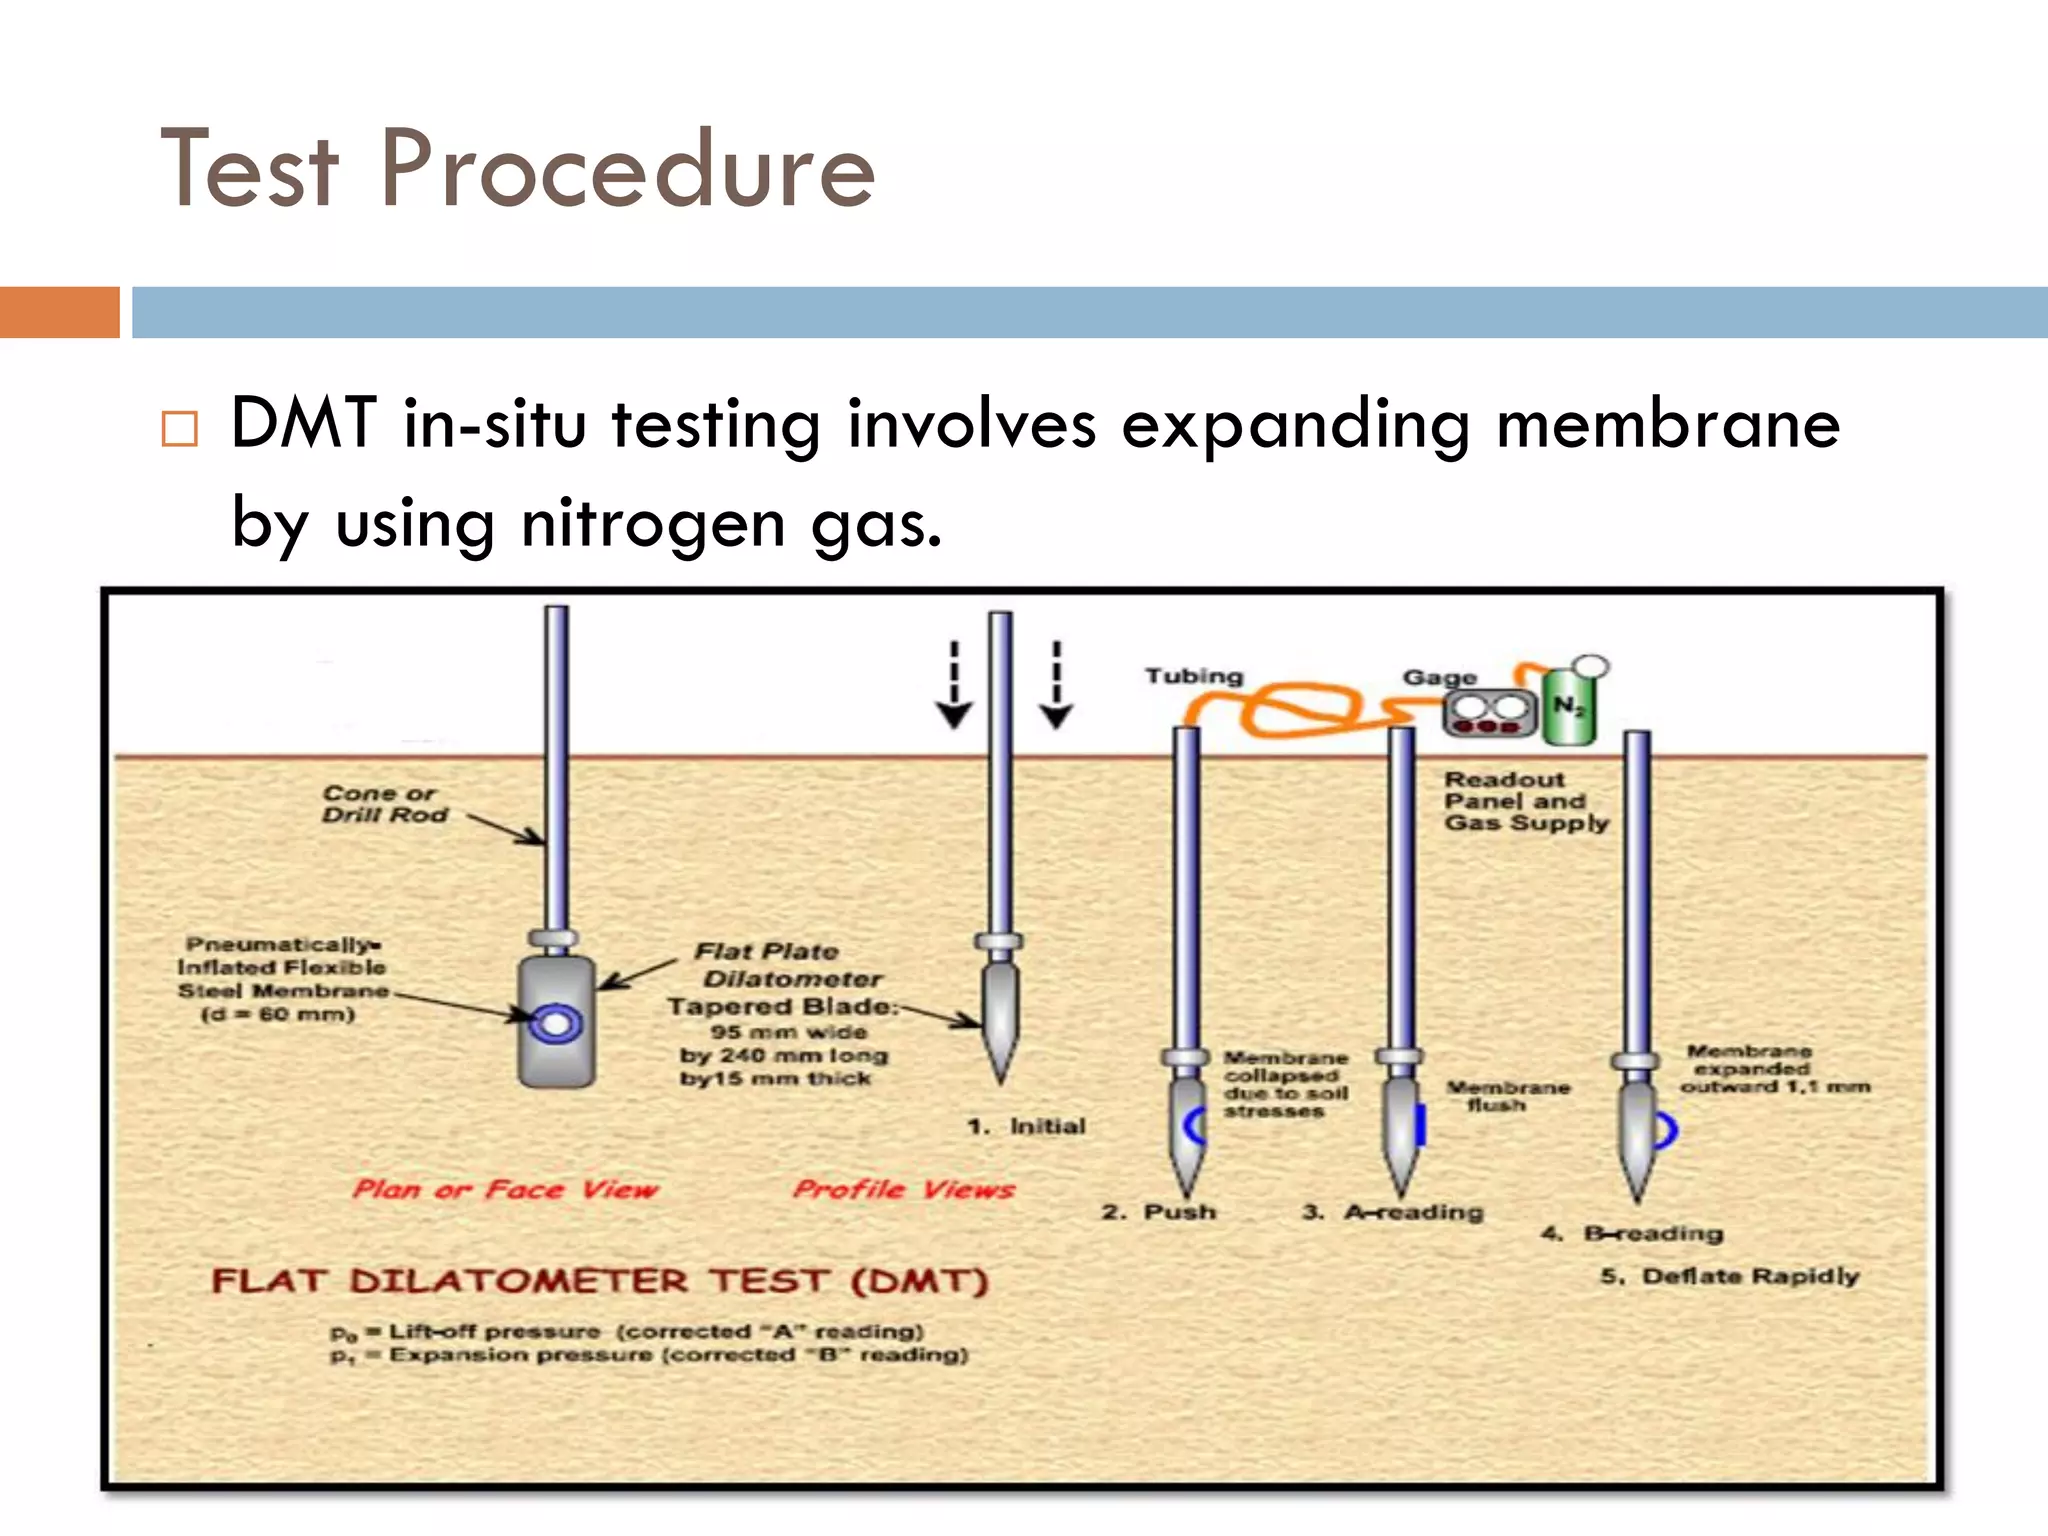
Introduction to DMT, its purpose in geotechnical design, and testing procedure.
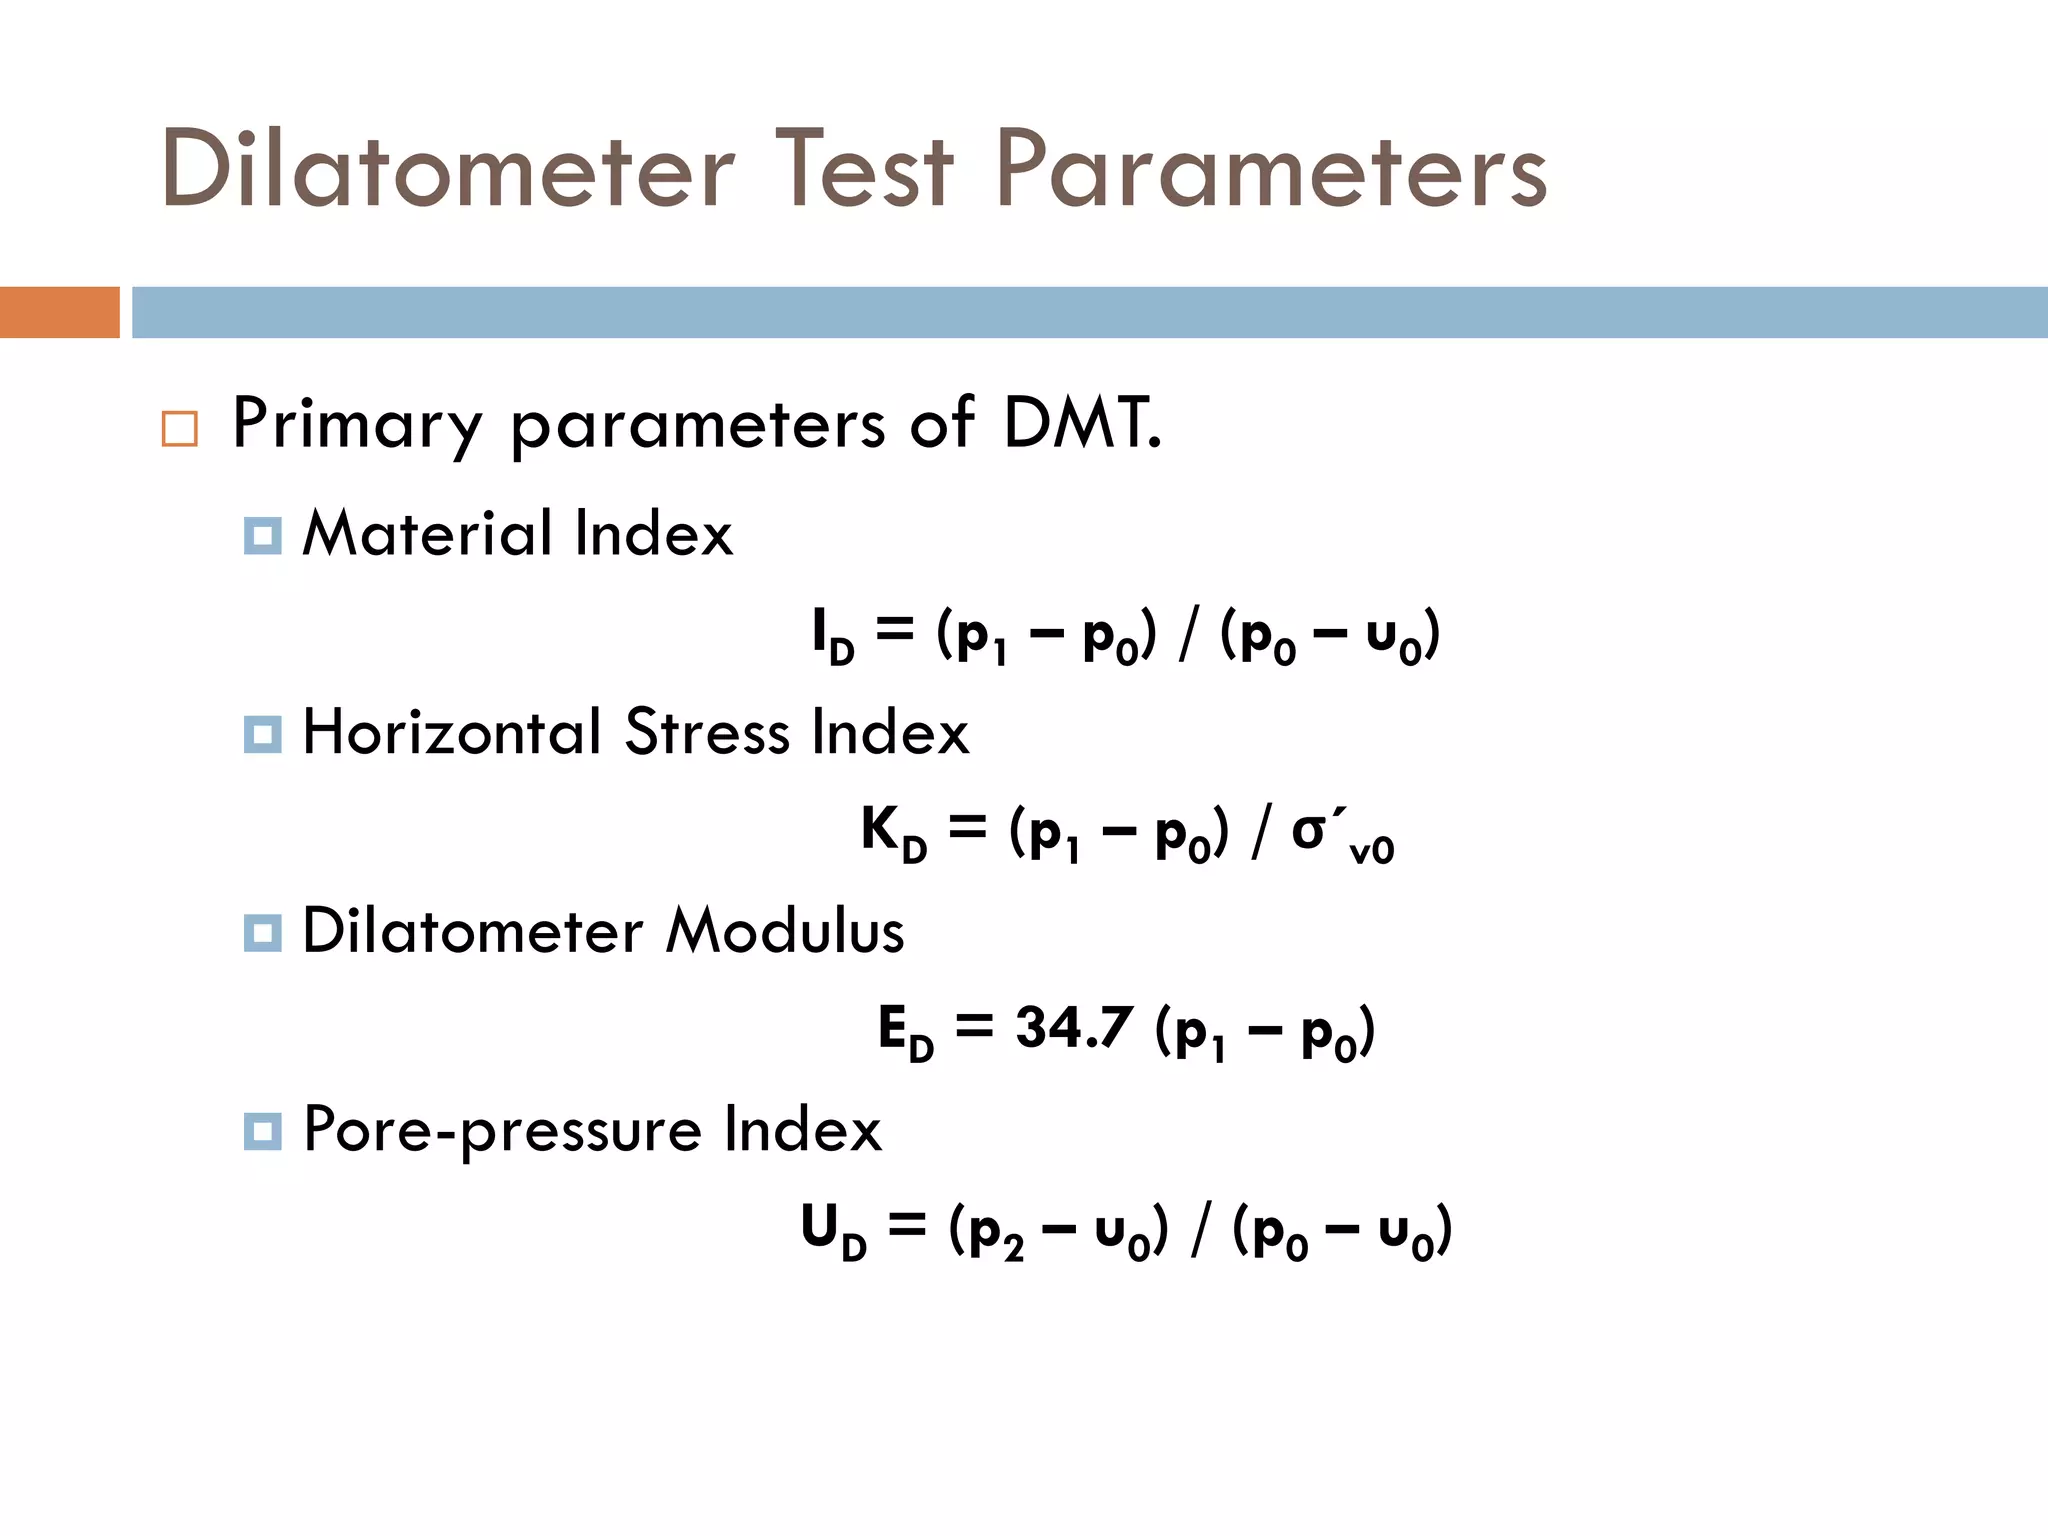
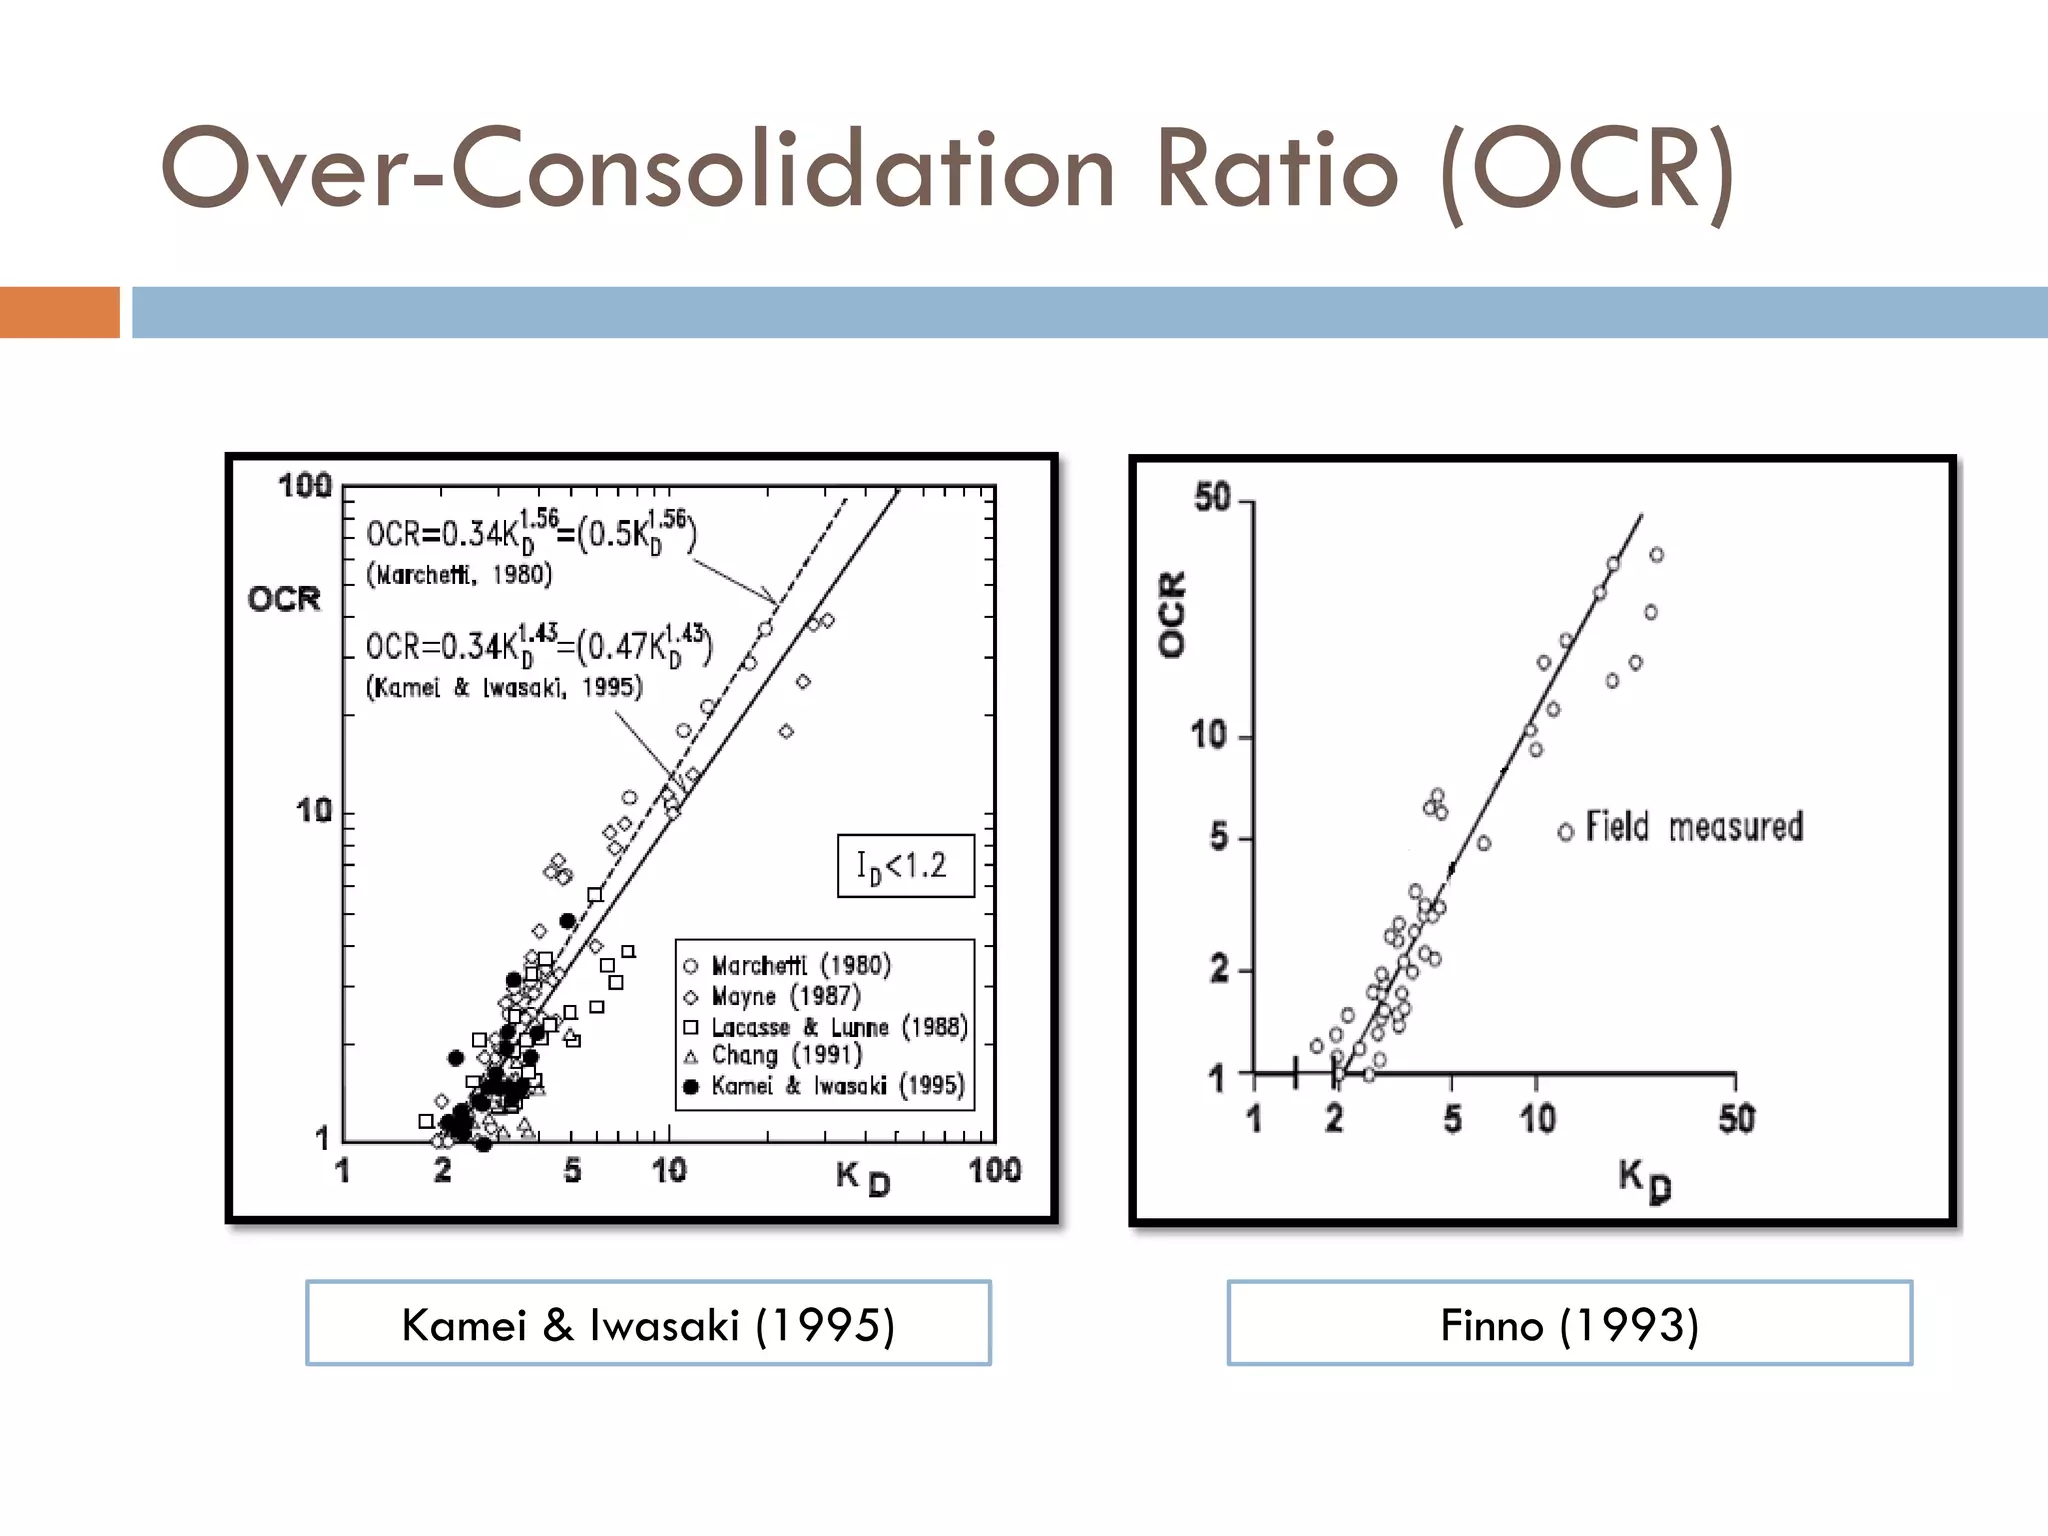
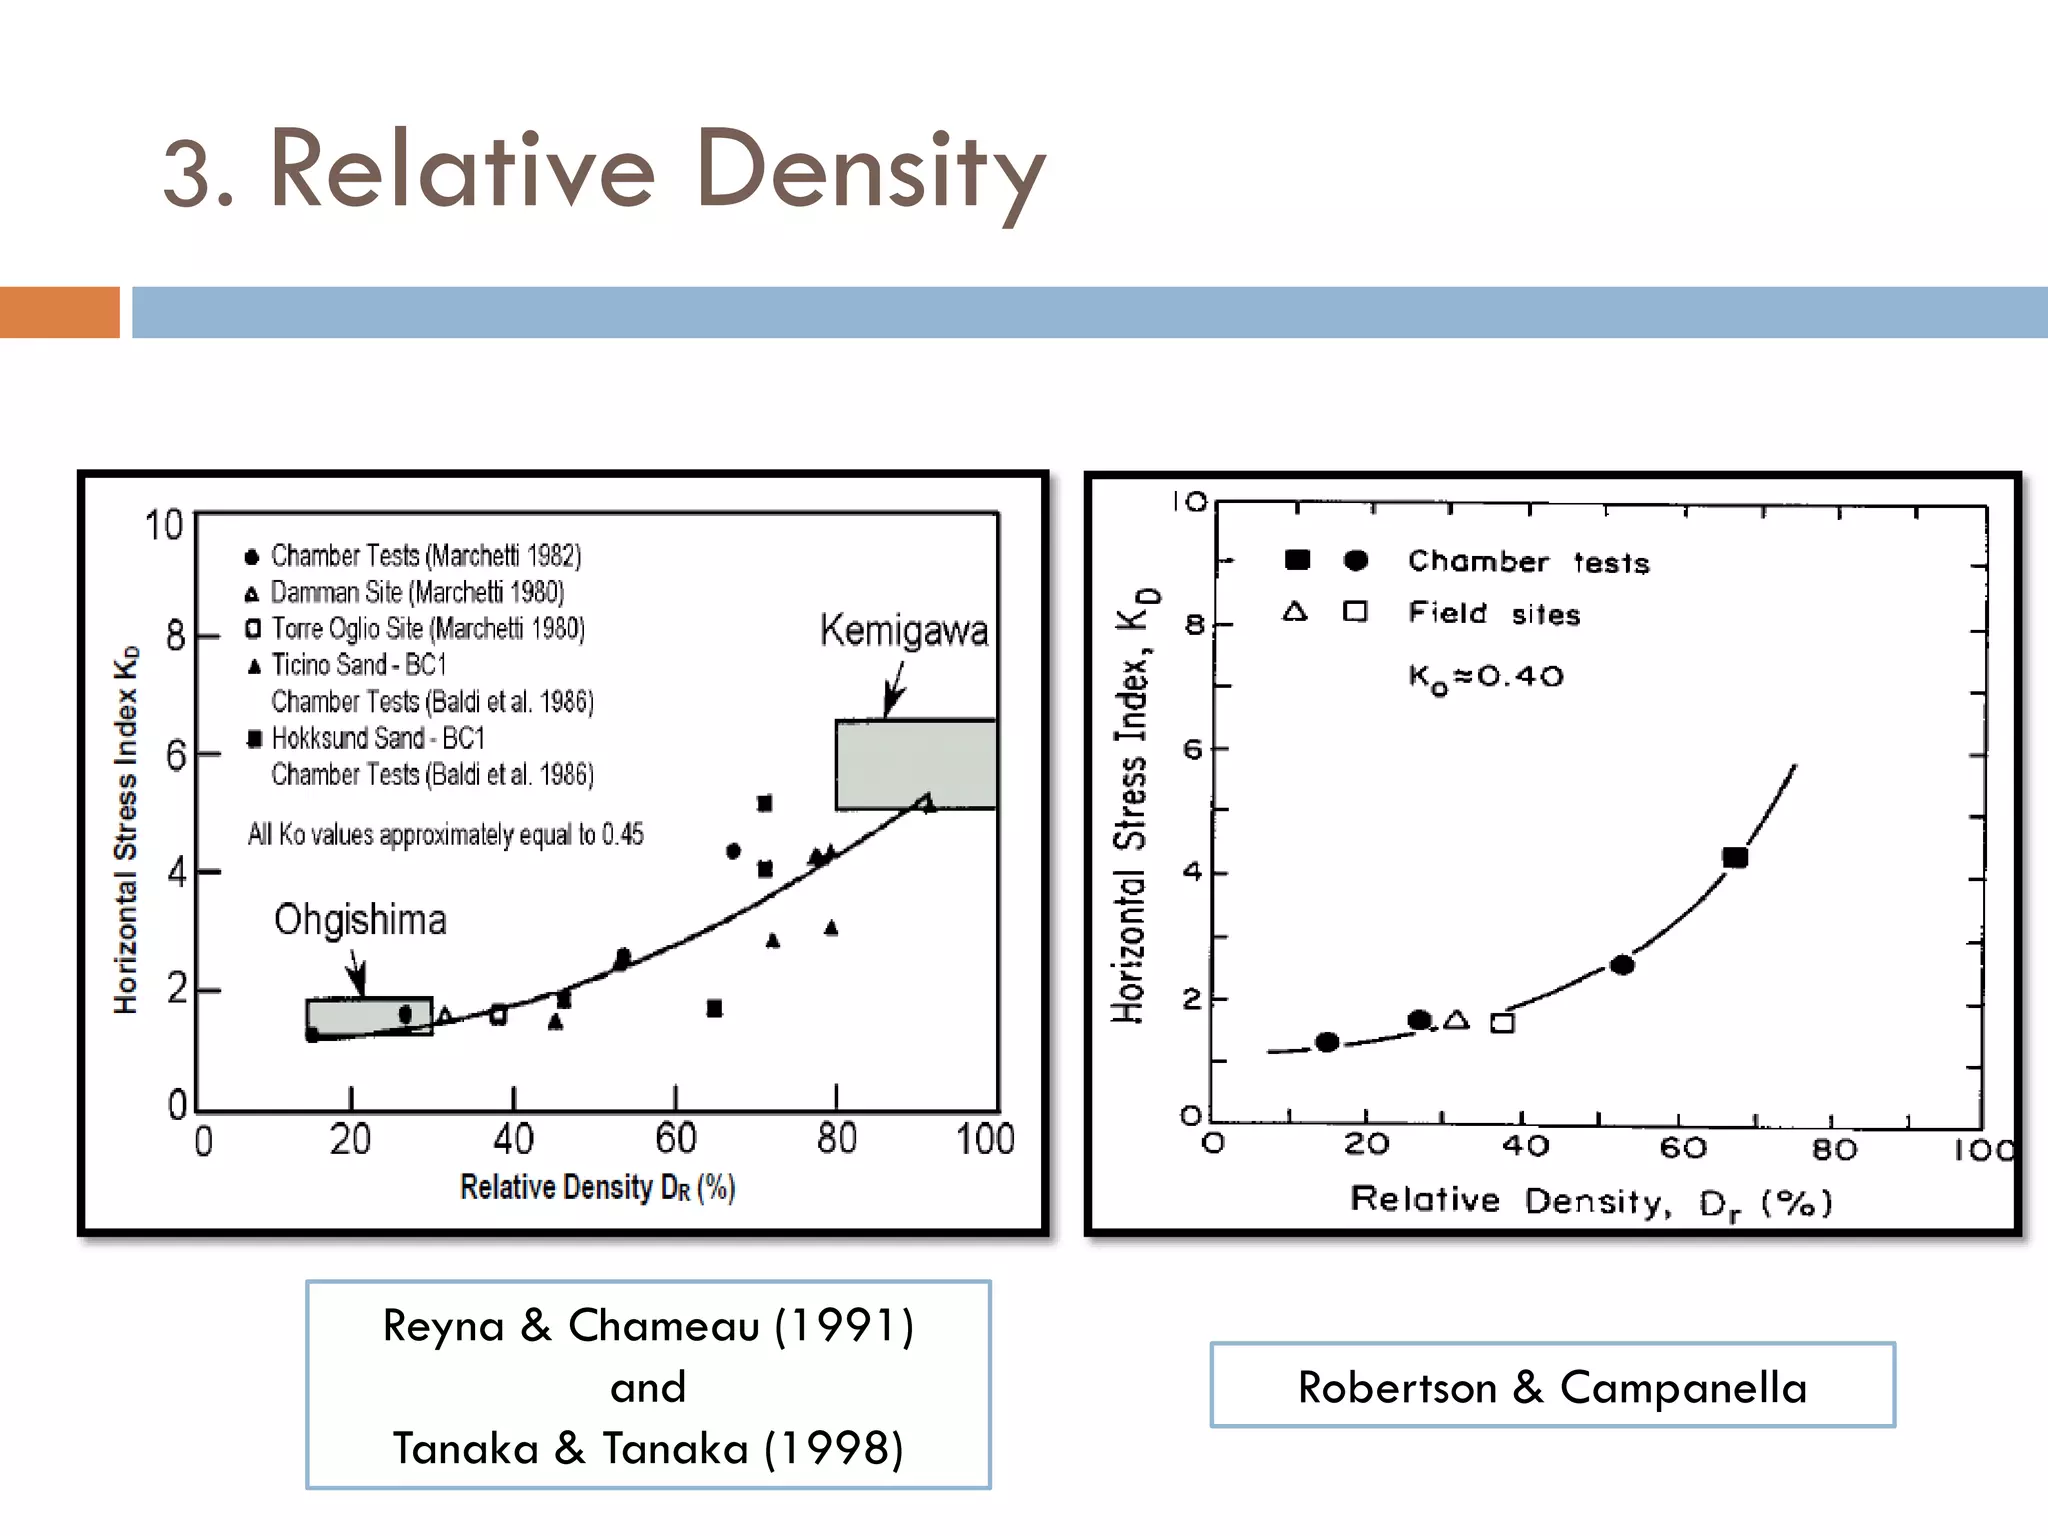
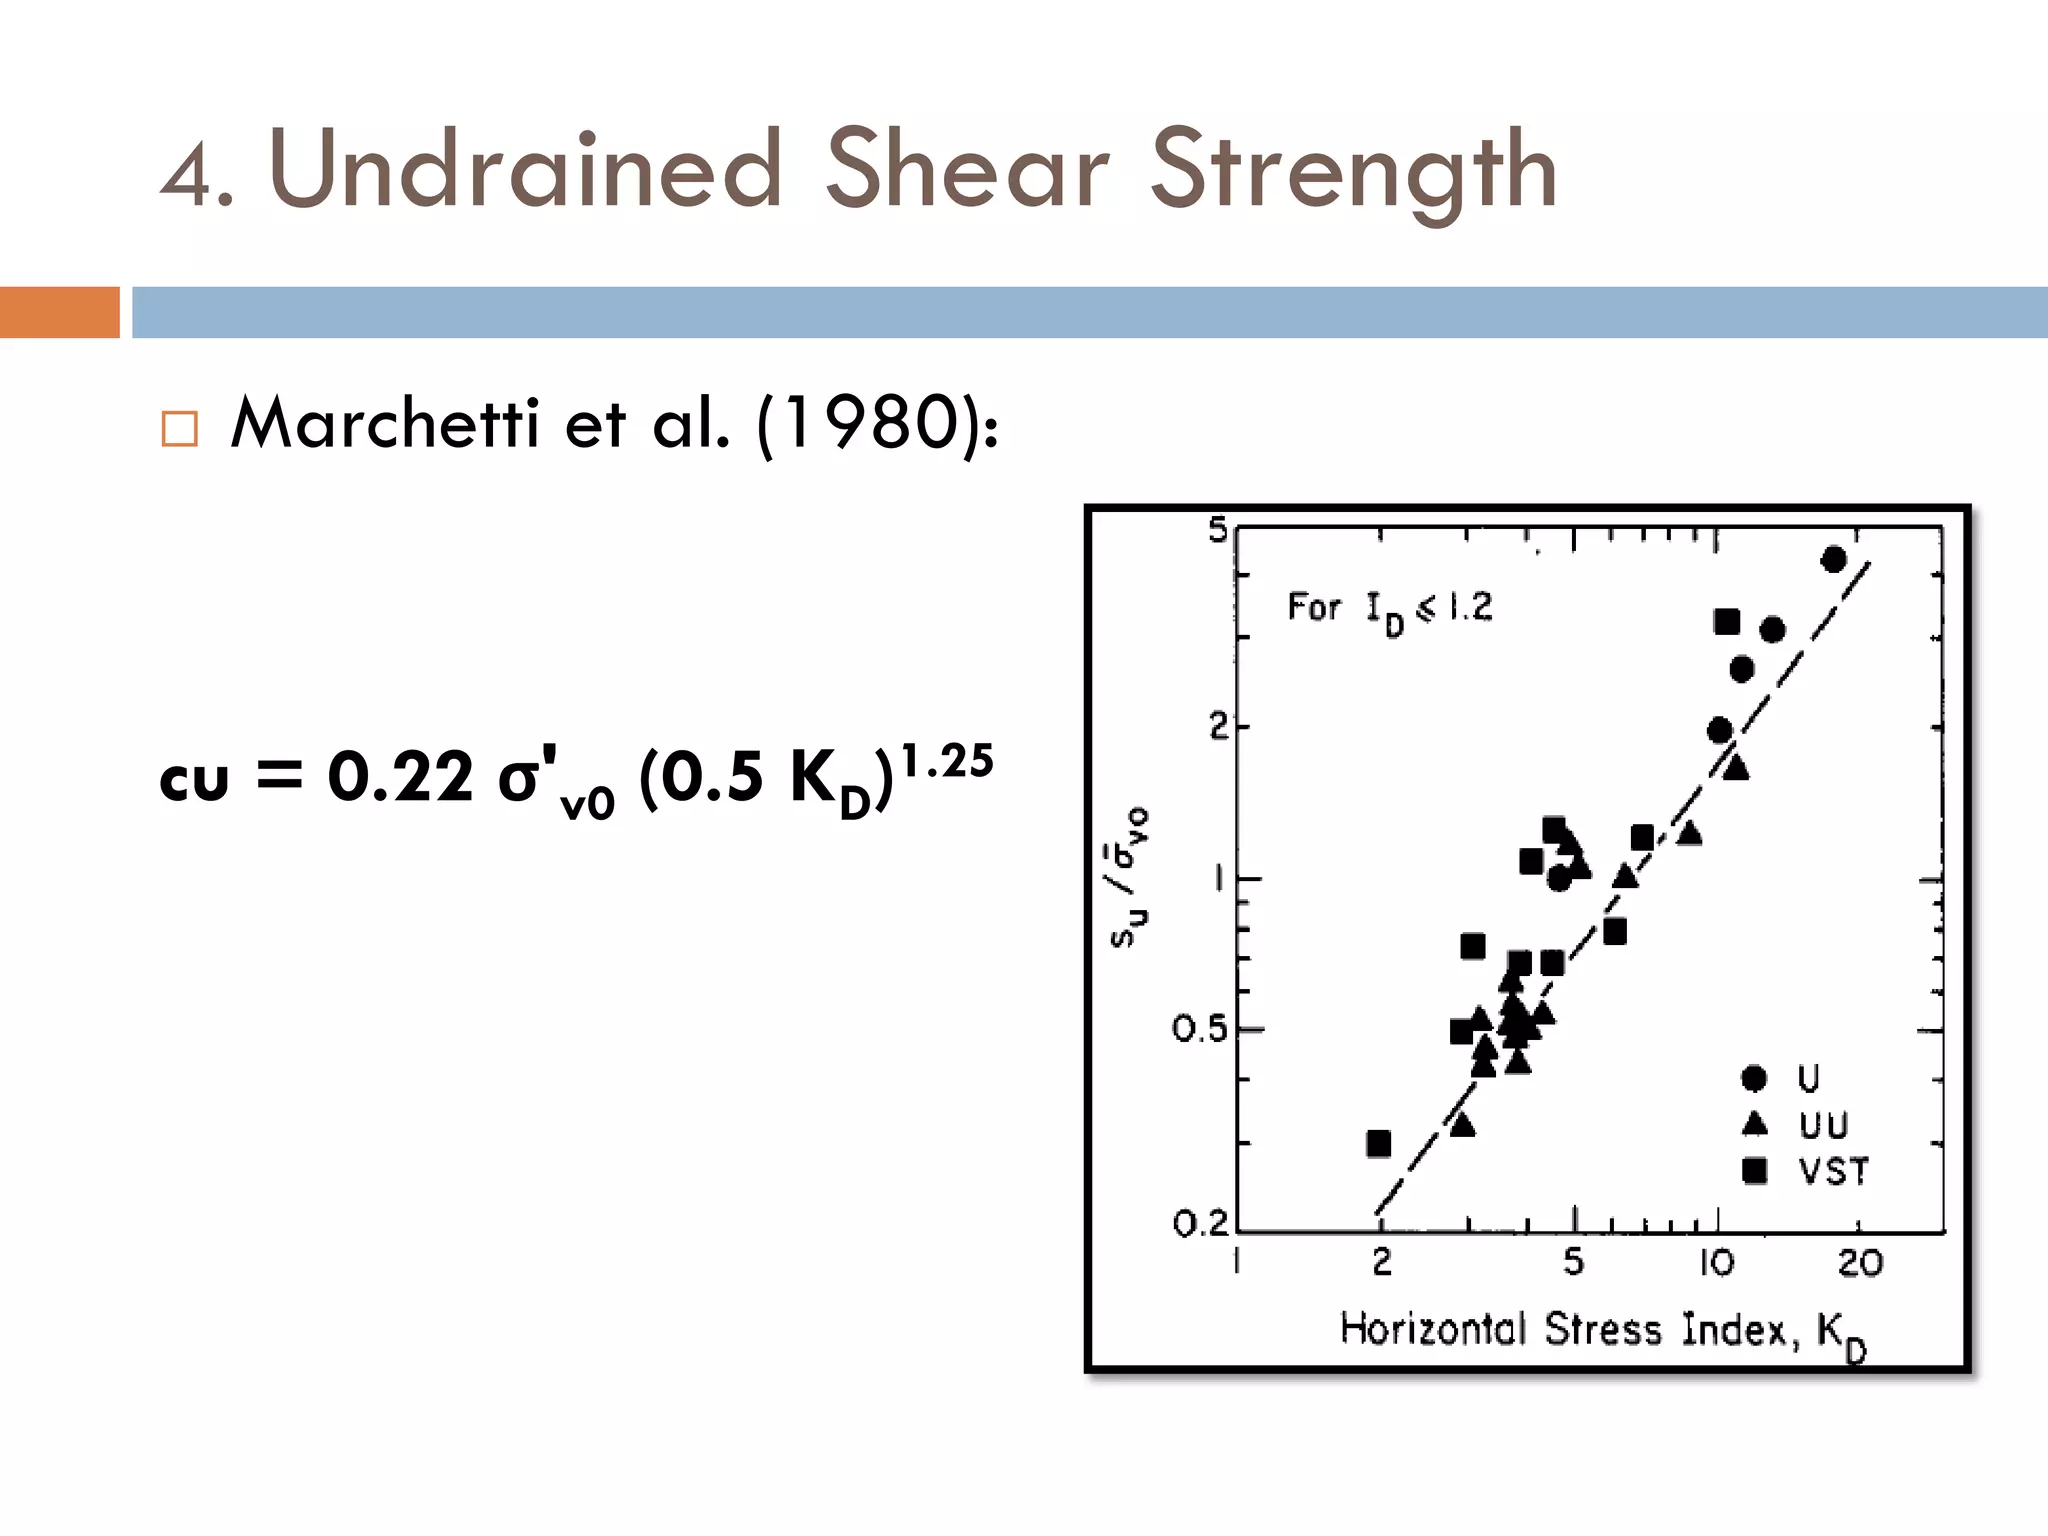
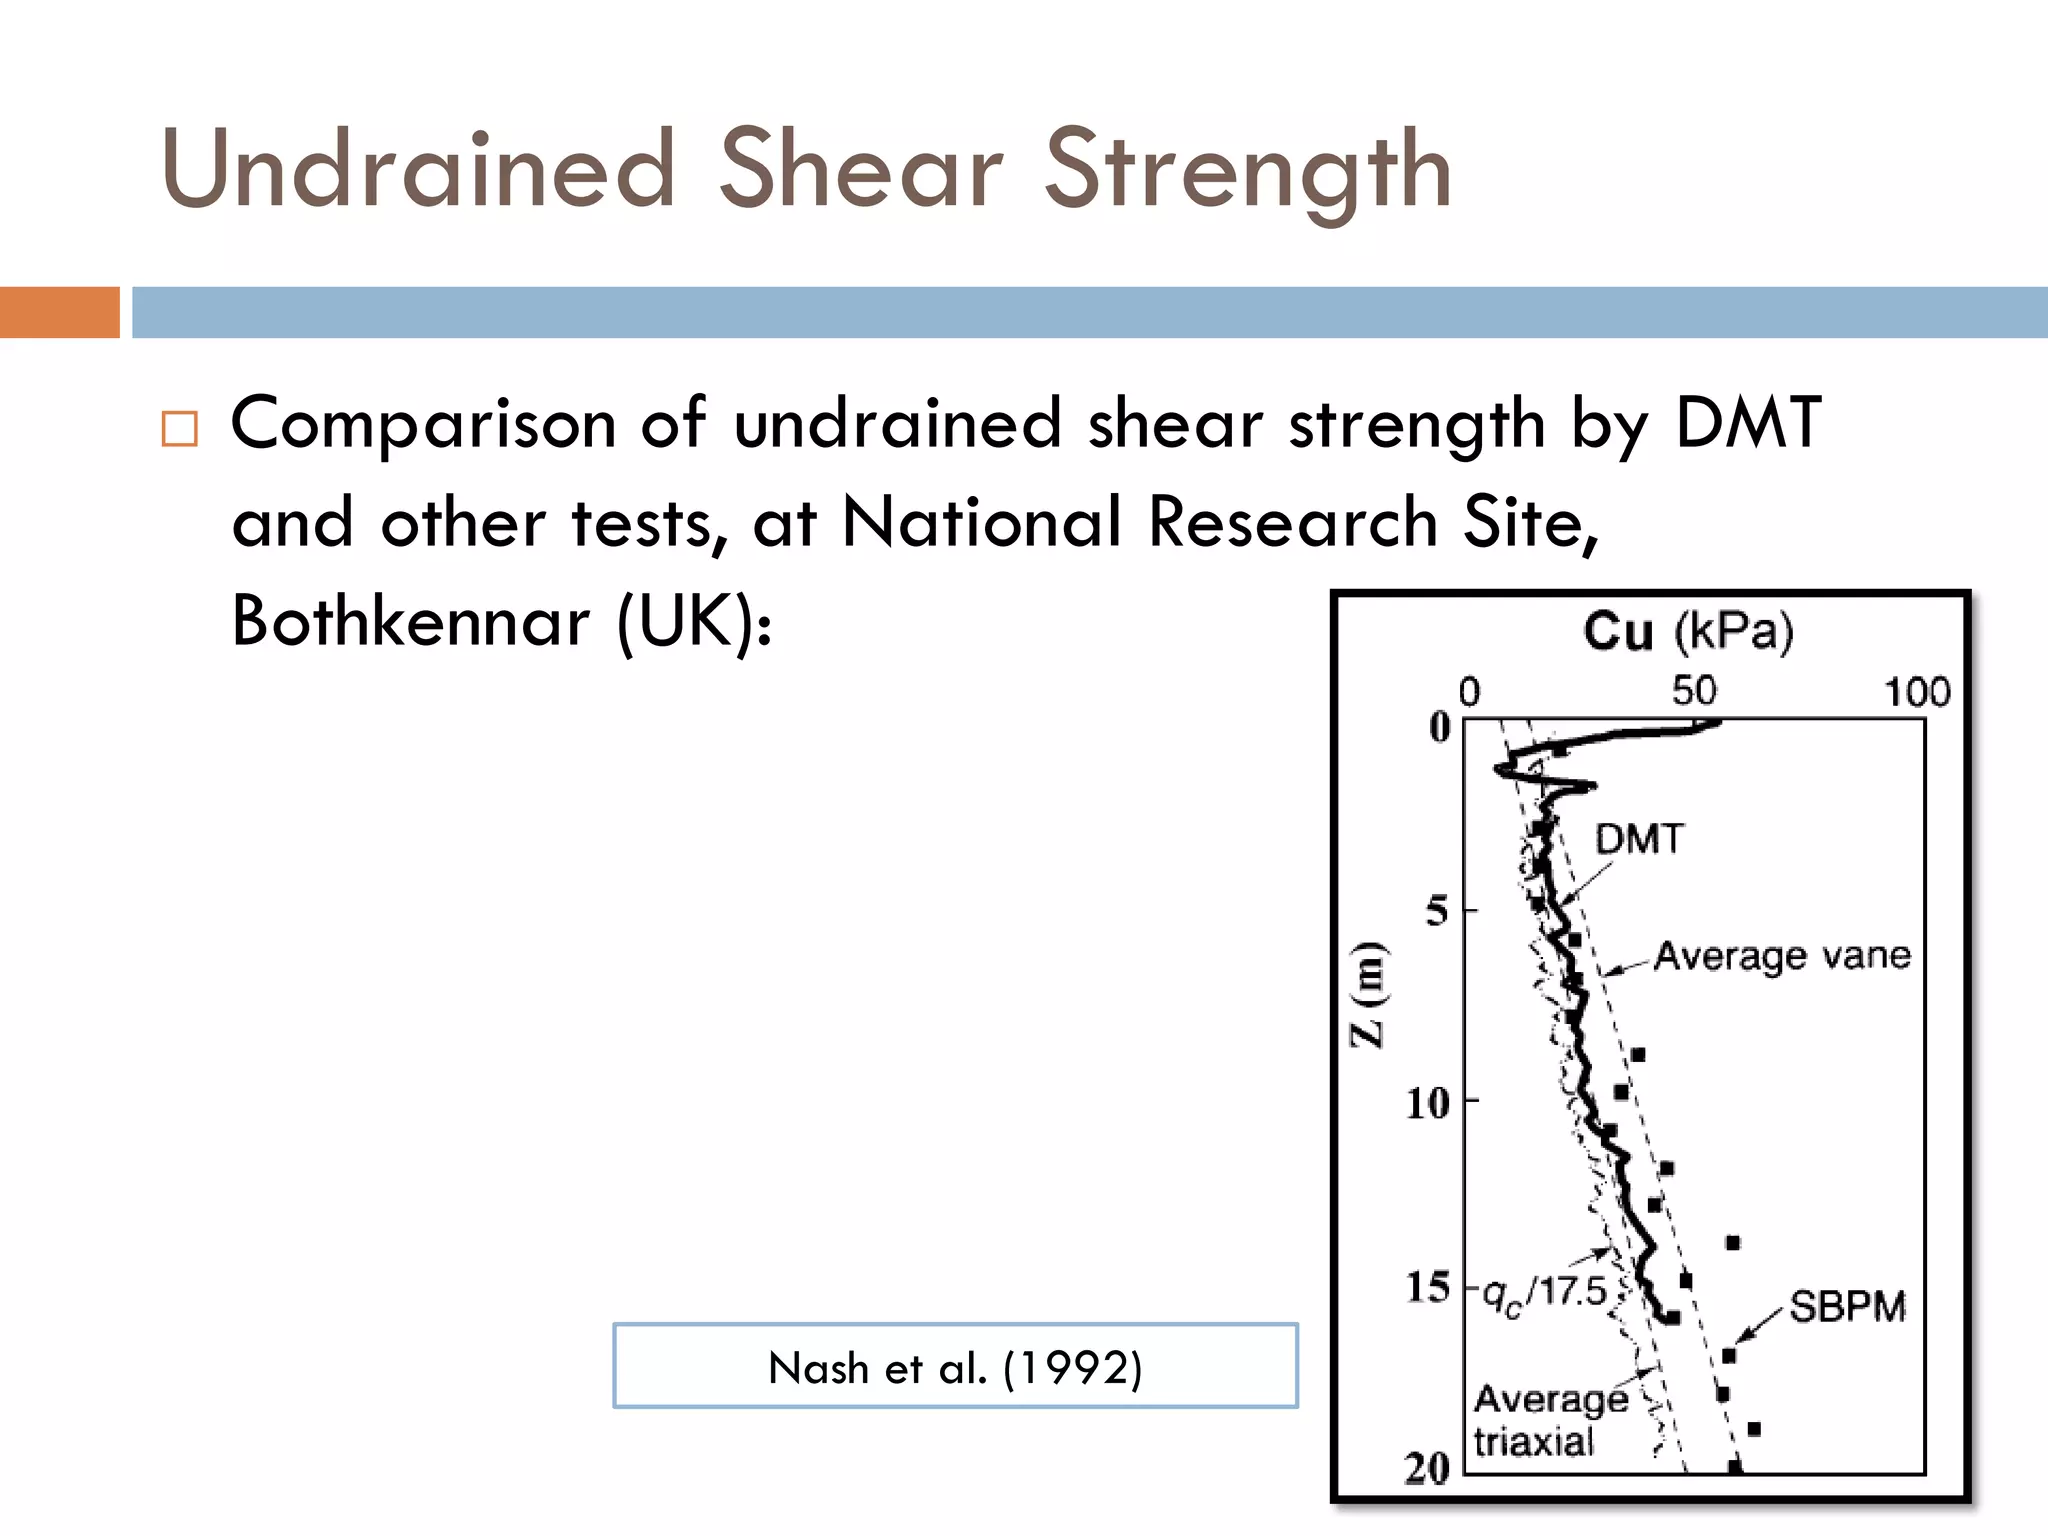
Discussion on DMT interpretation including primary parameters: Material Index, Horizontal Stress, and Dilatometer Modulus.
Correlations of DMT parameters with soil behavior, Over-Consolidation Ratio, and settlement prediction for foundation design.
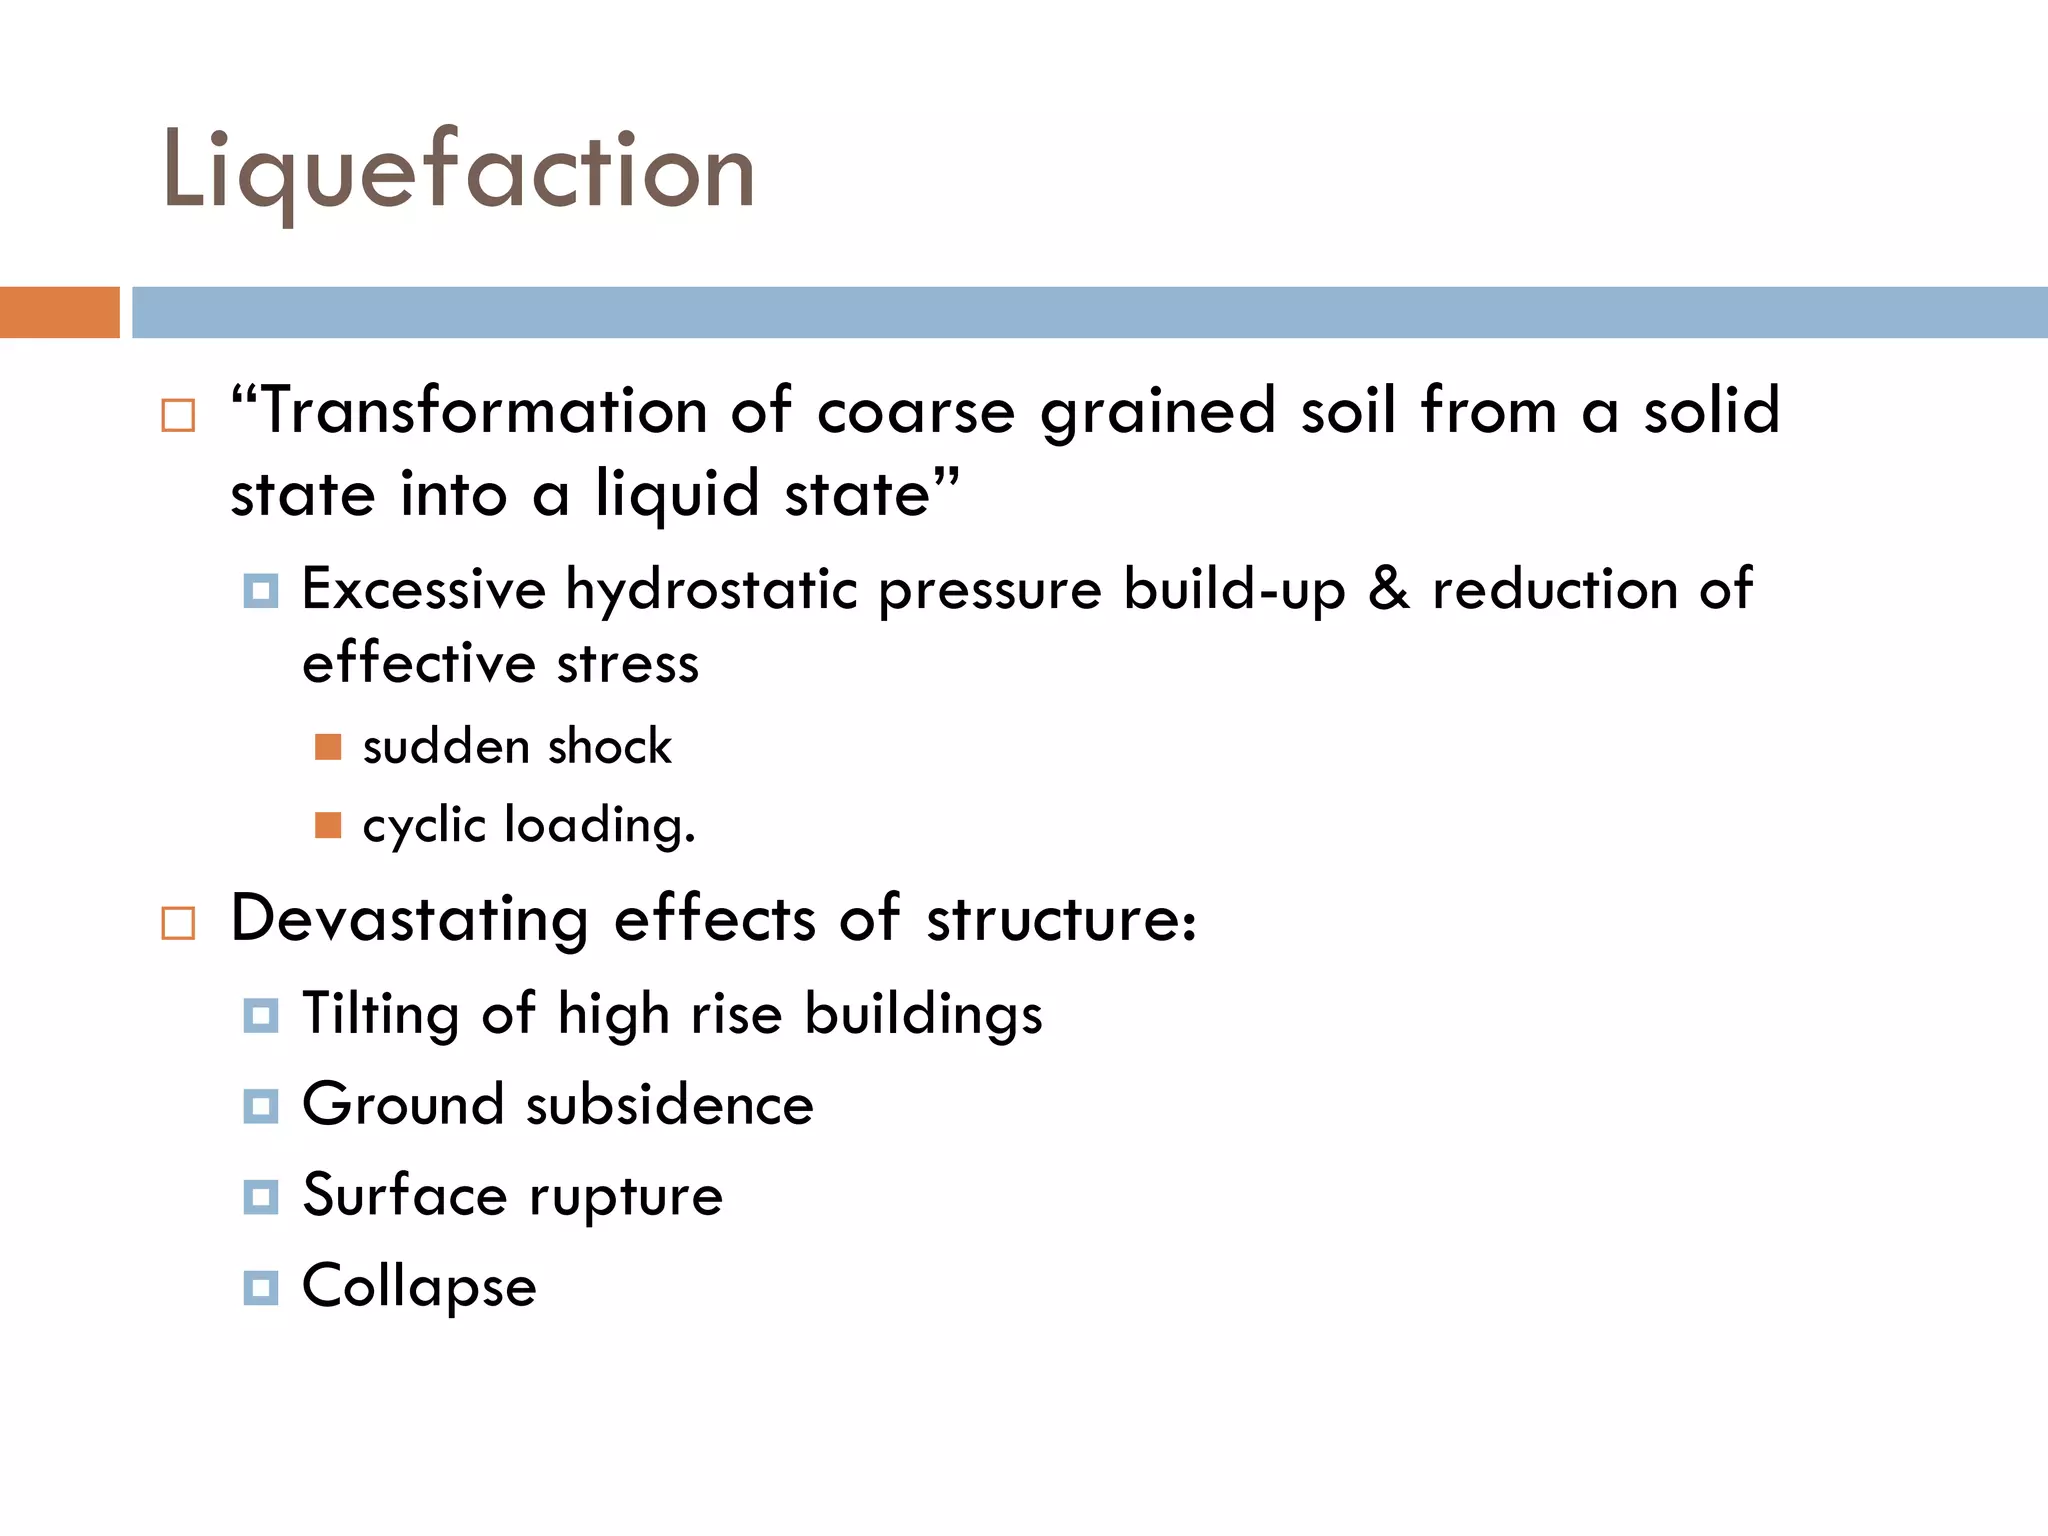
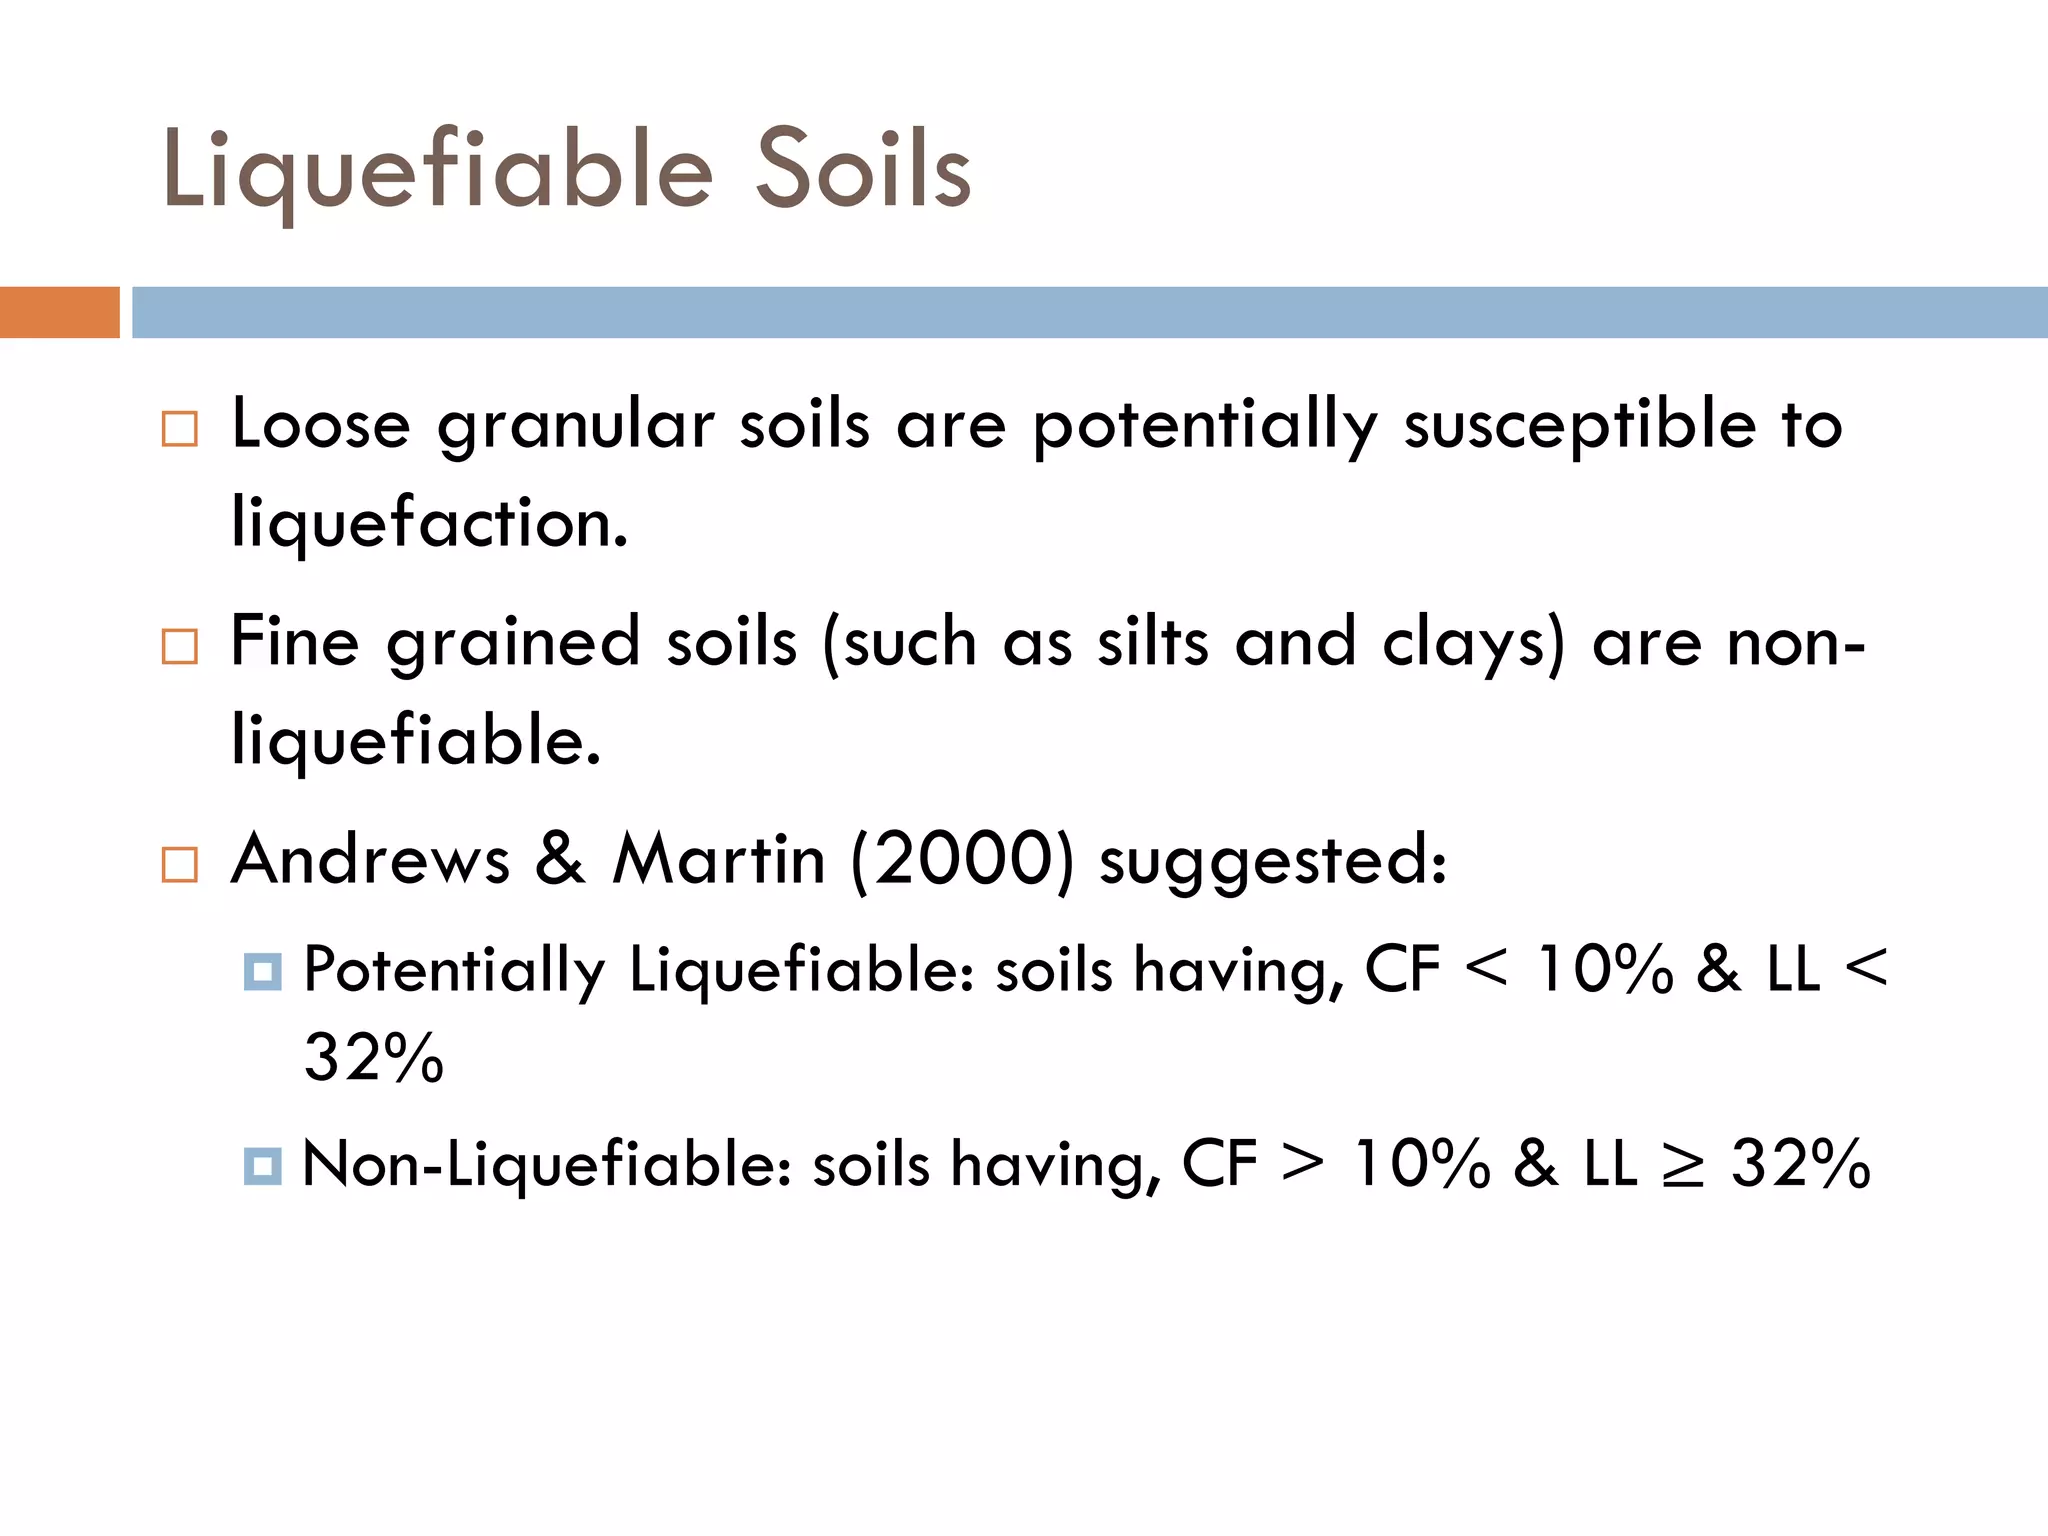
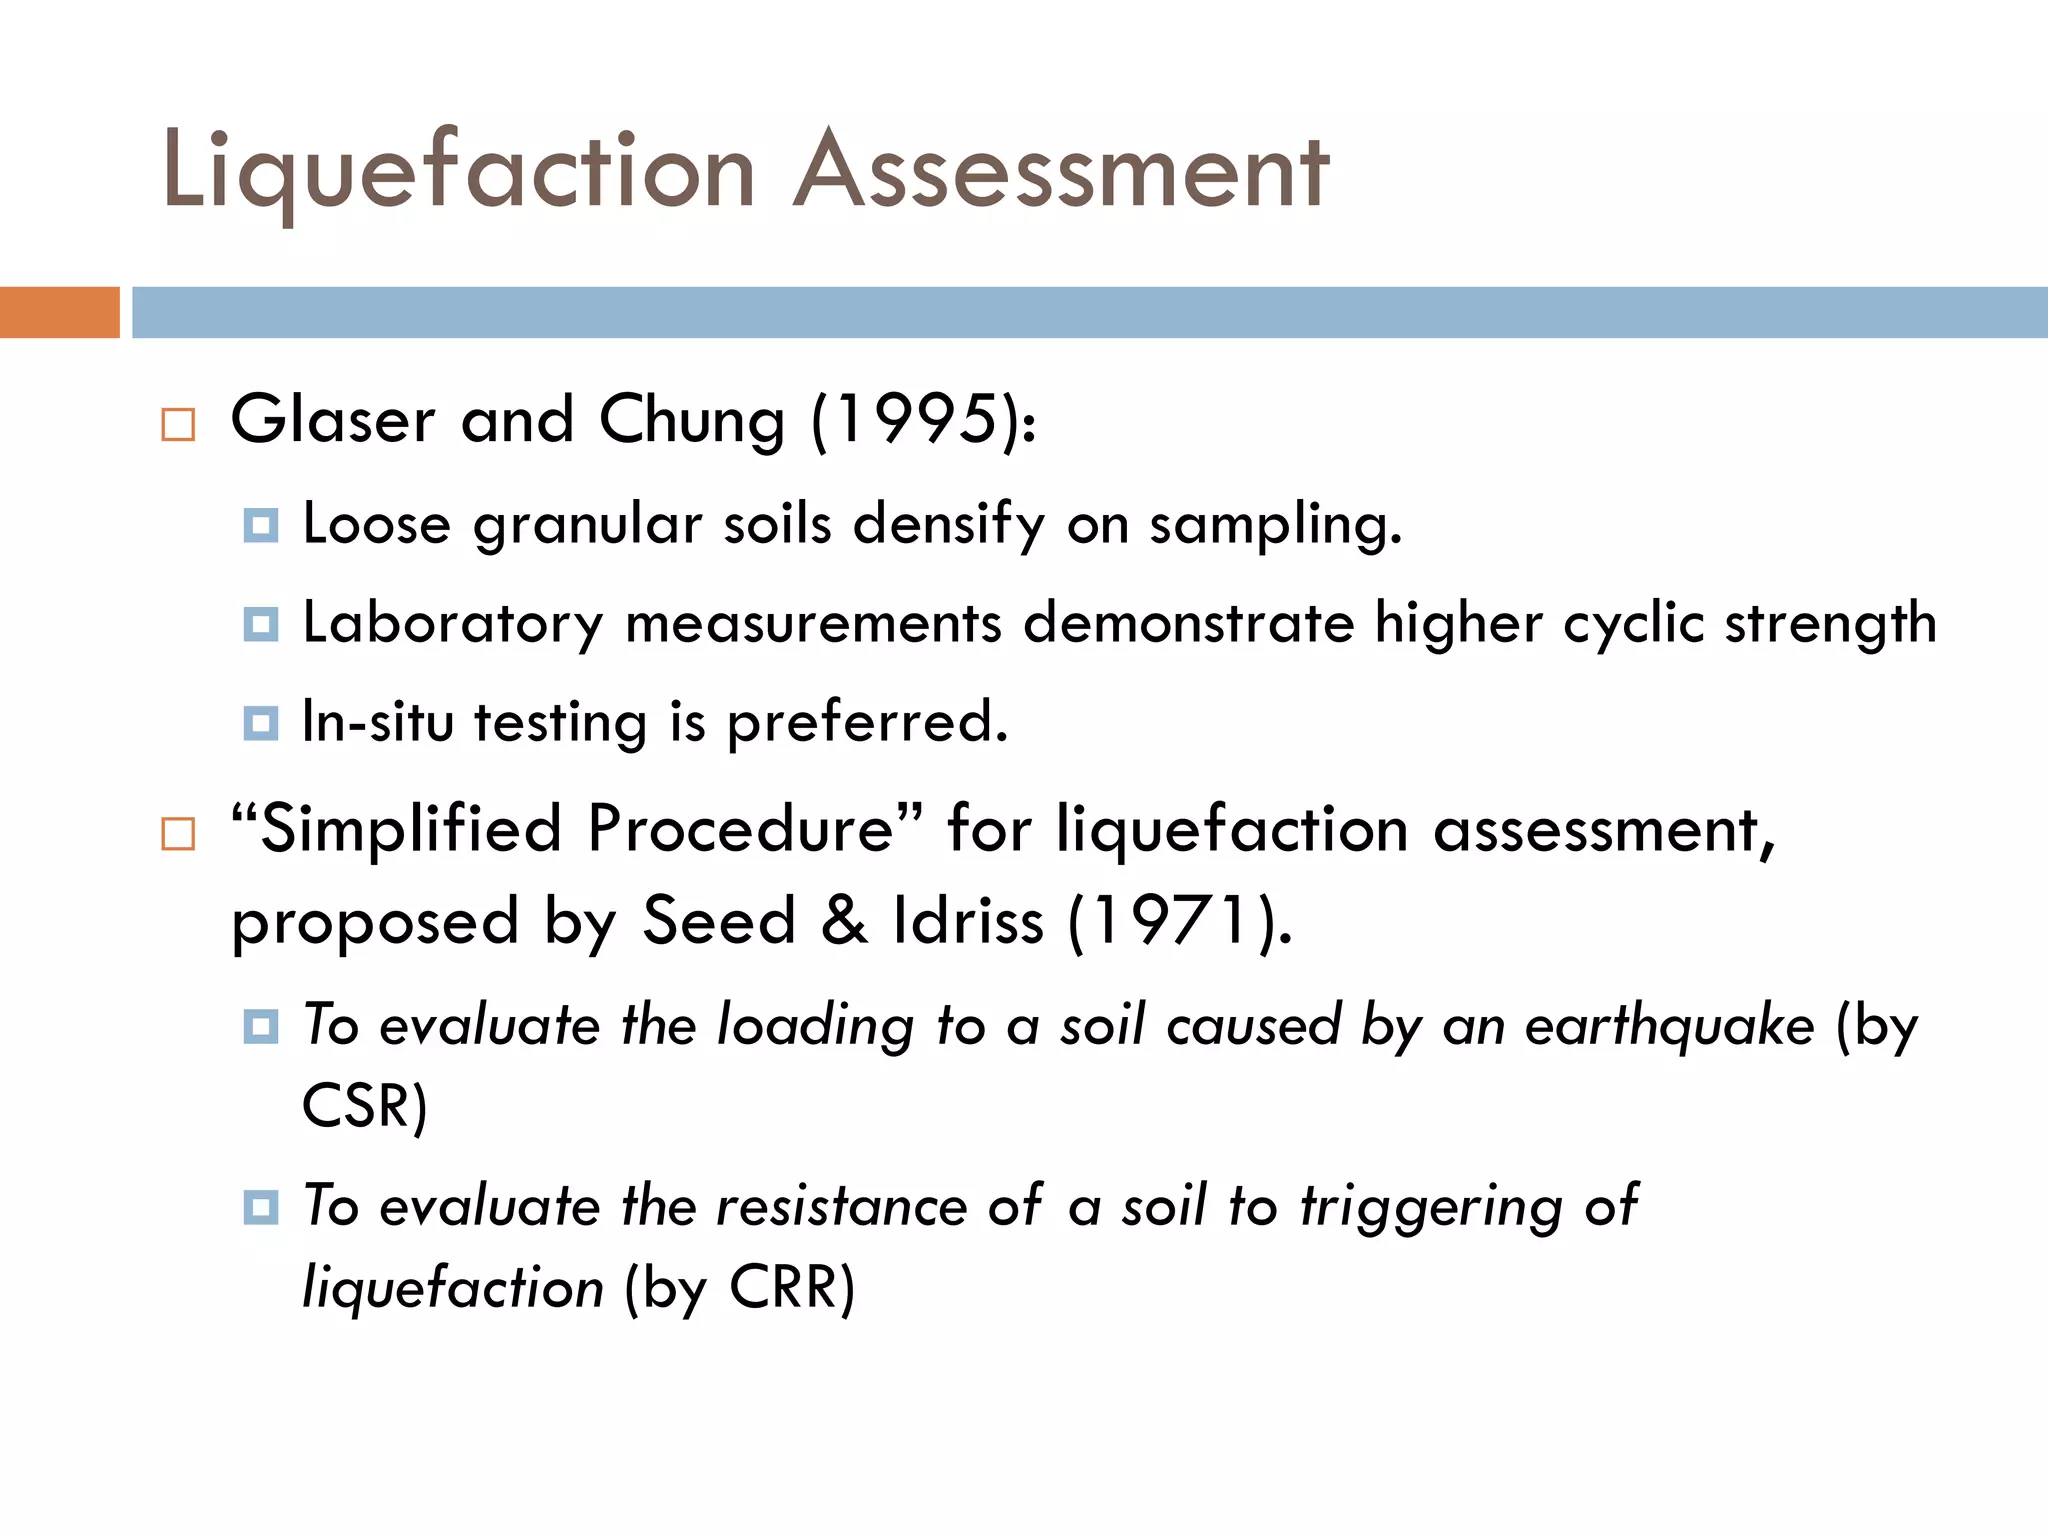
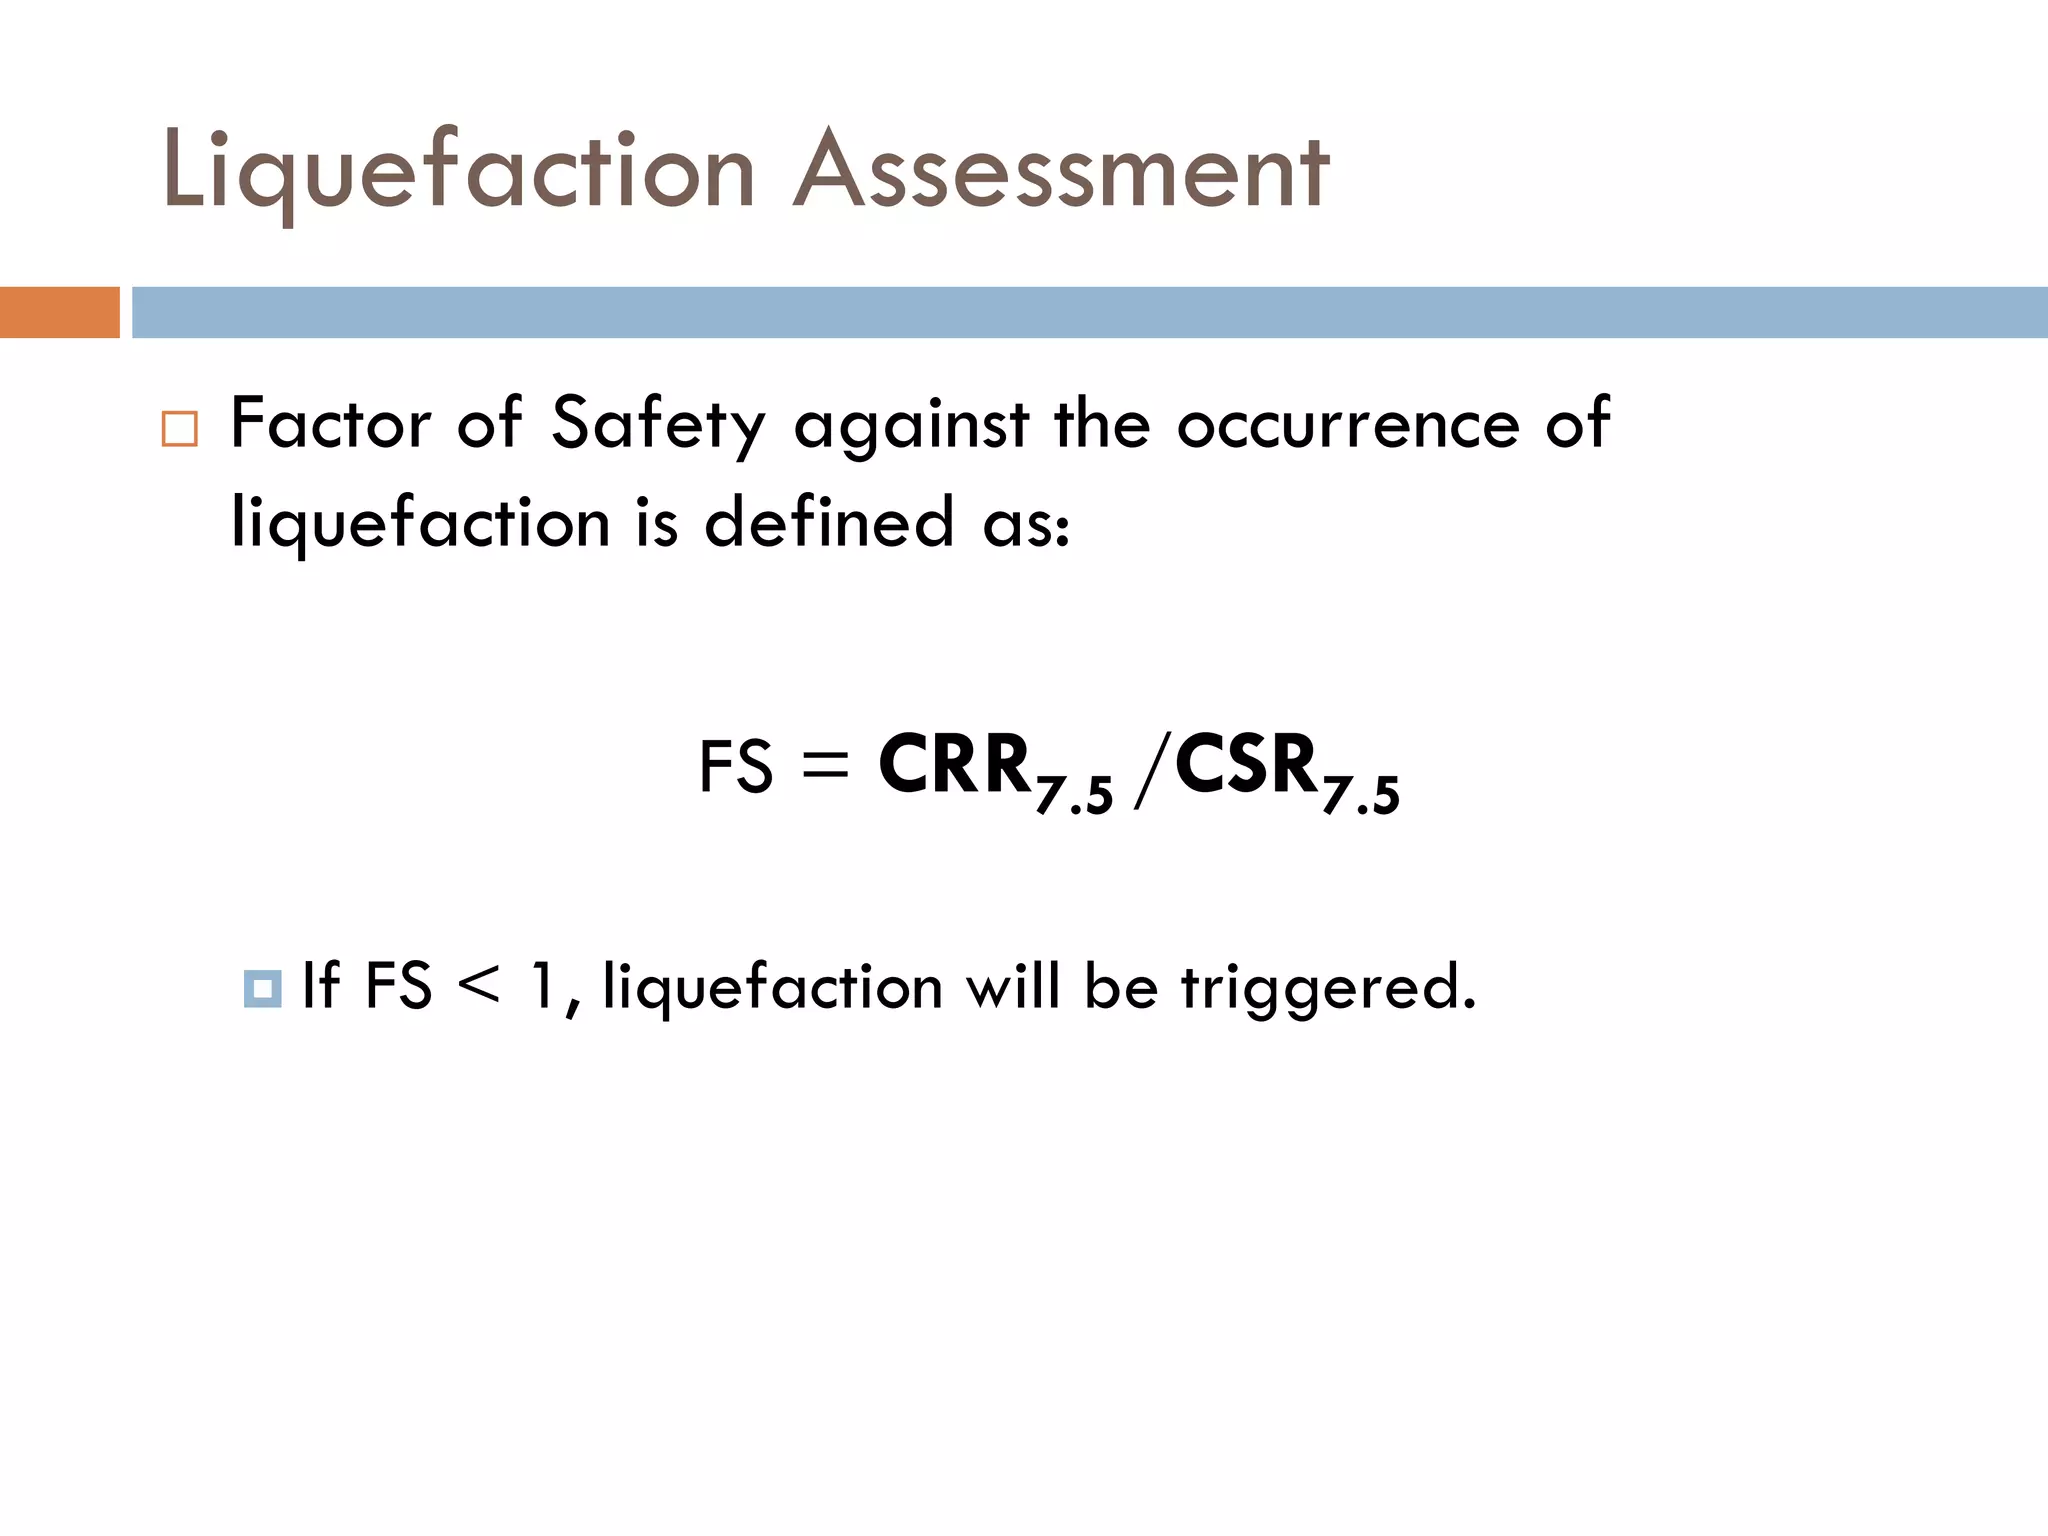
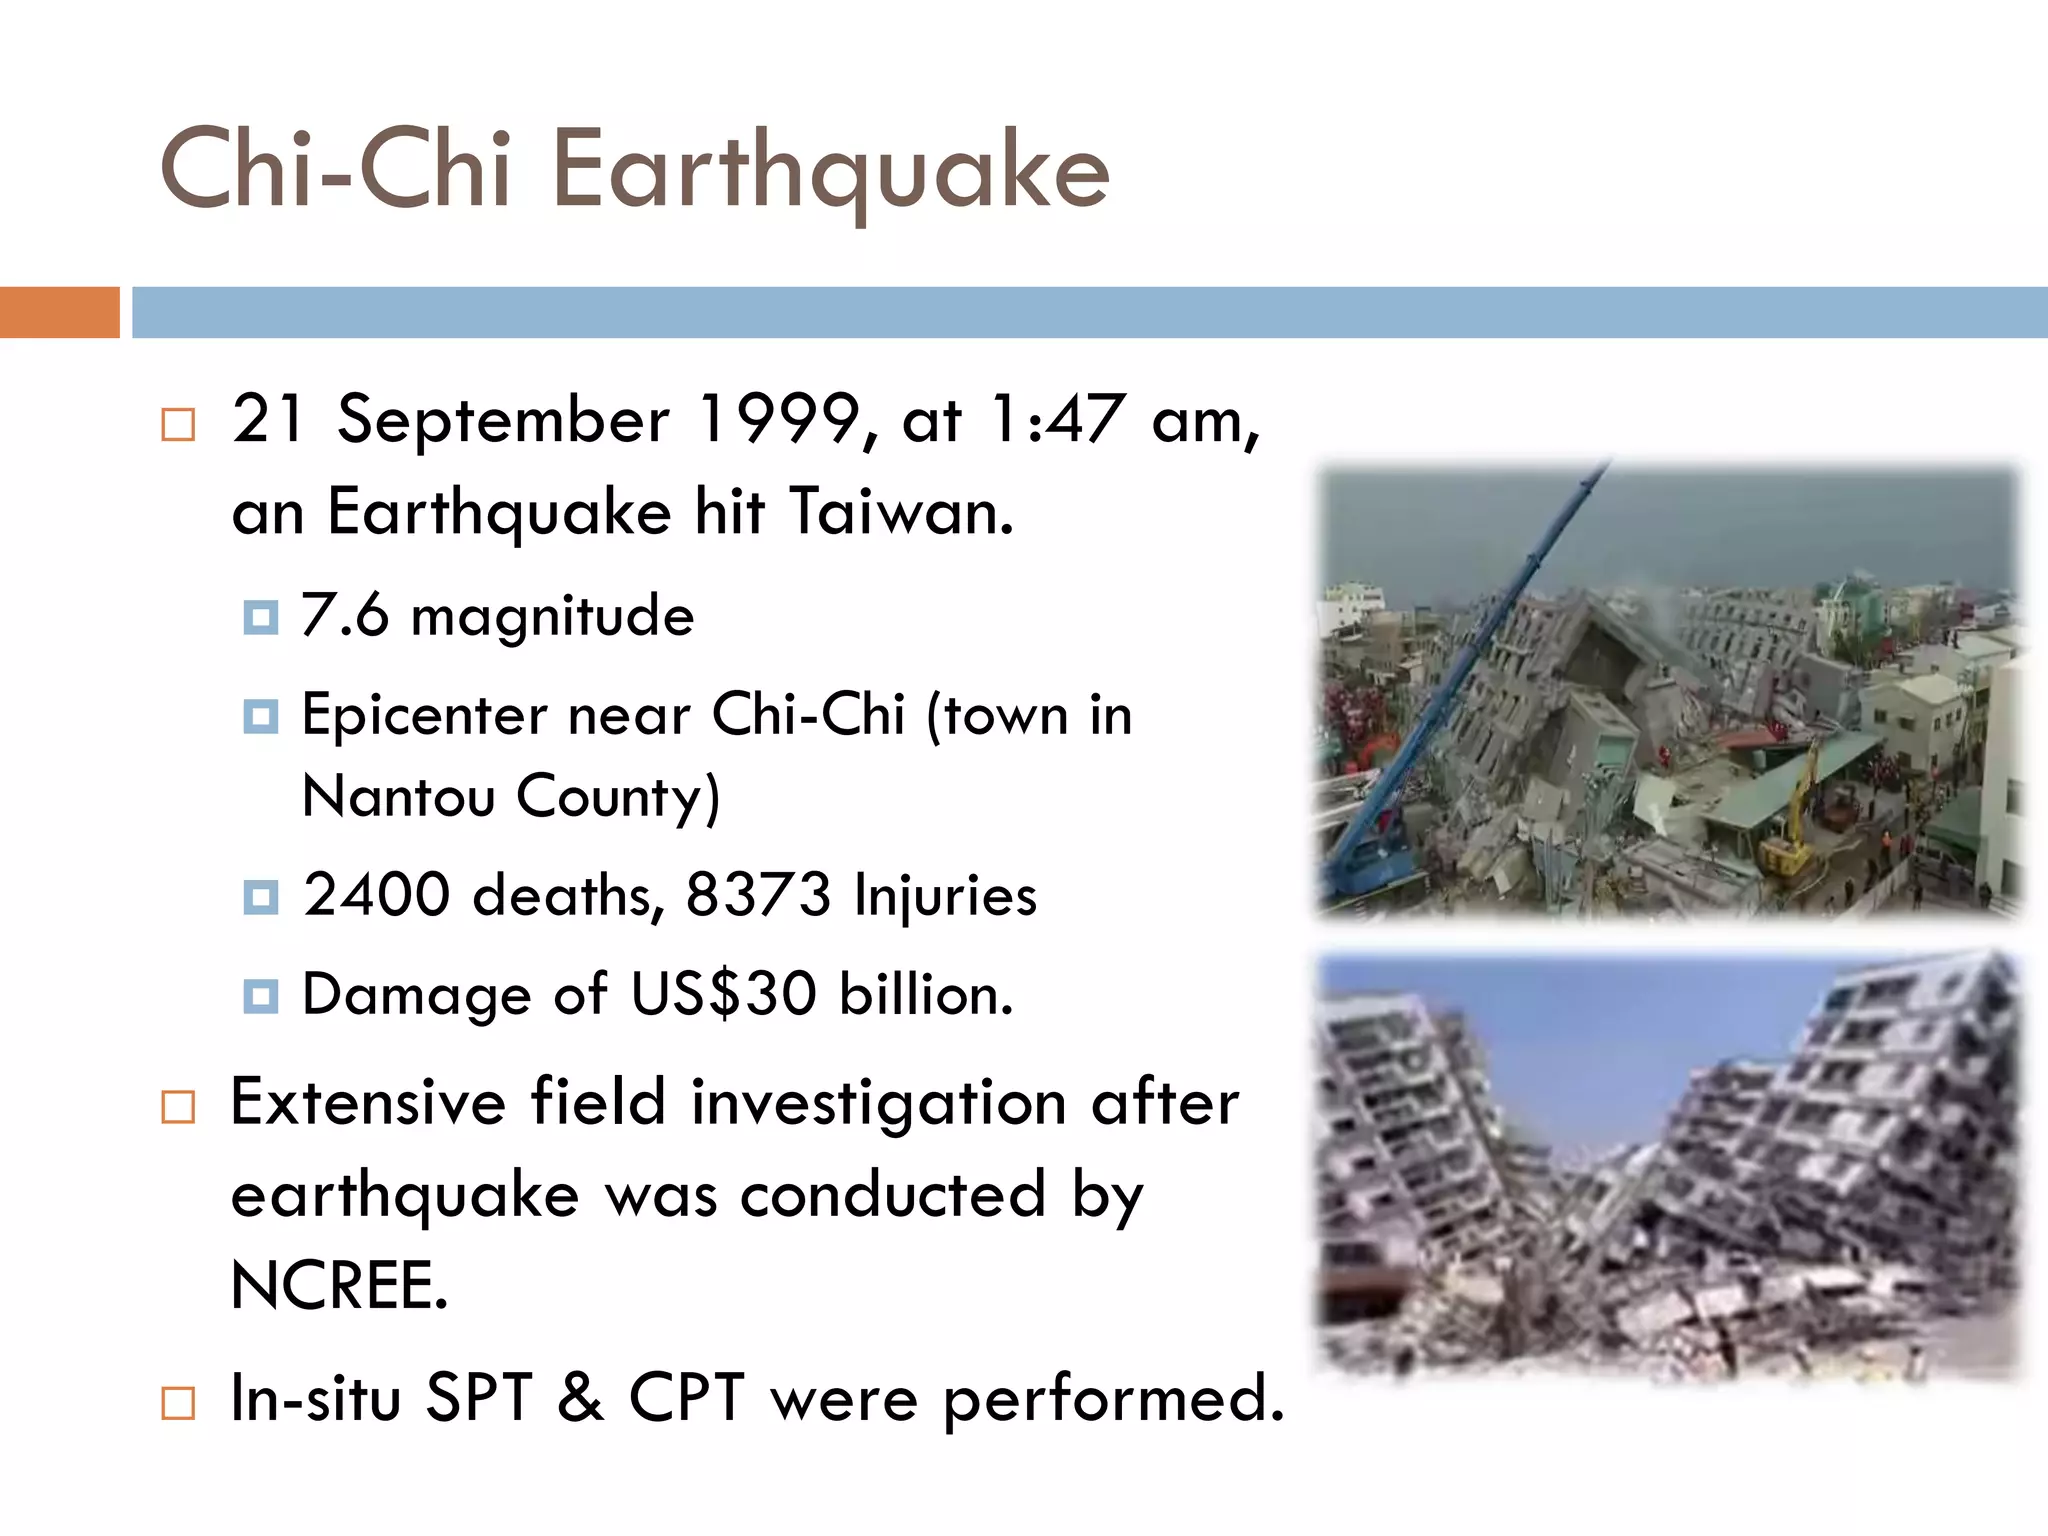
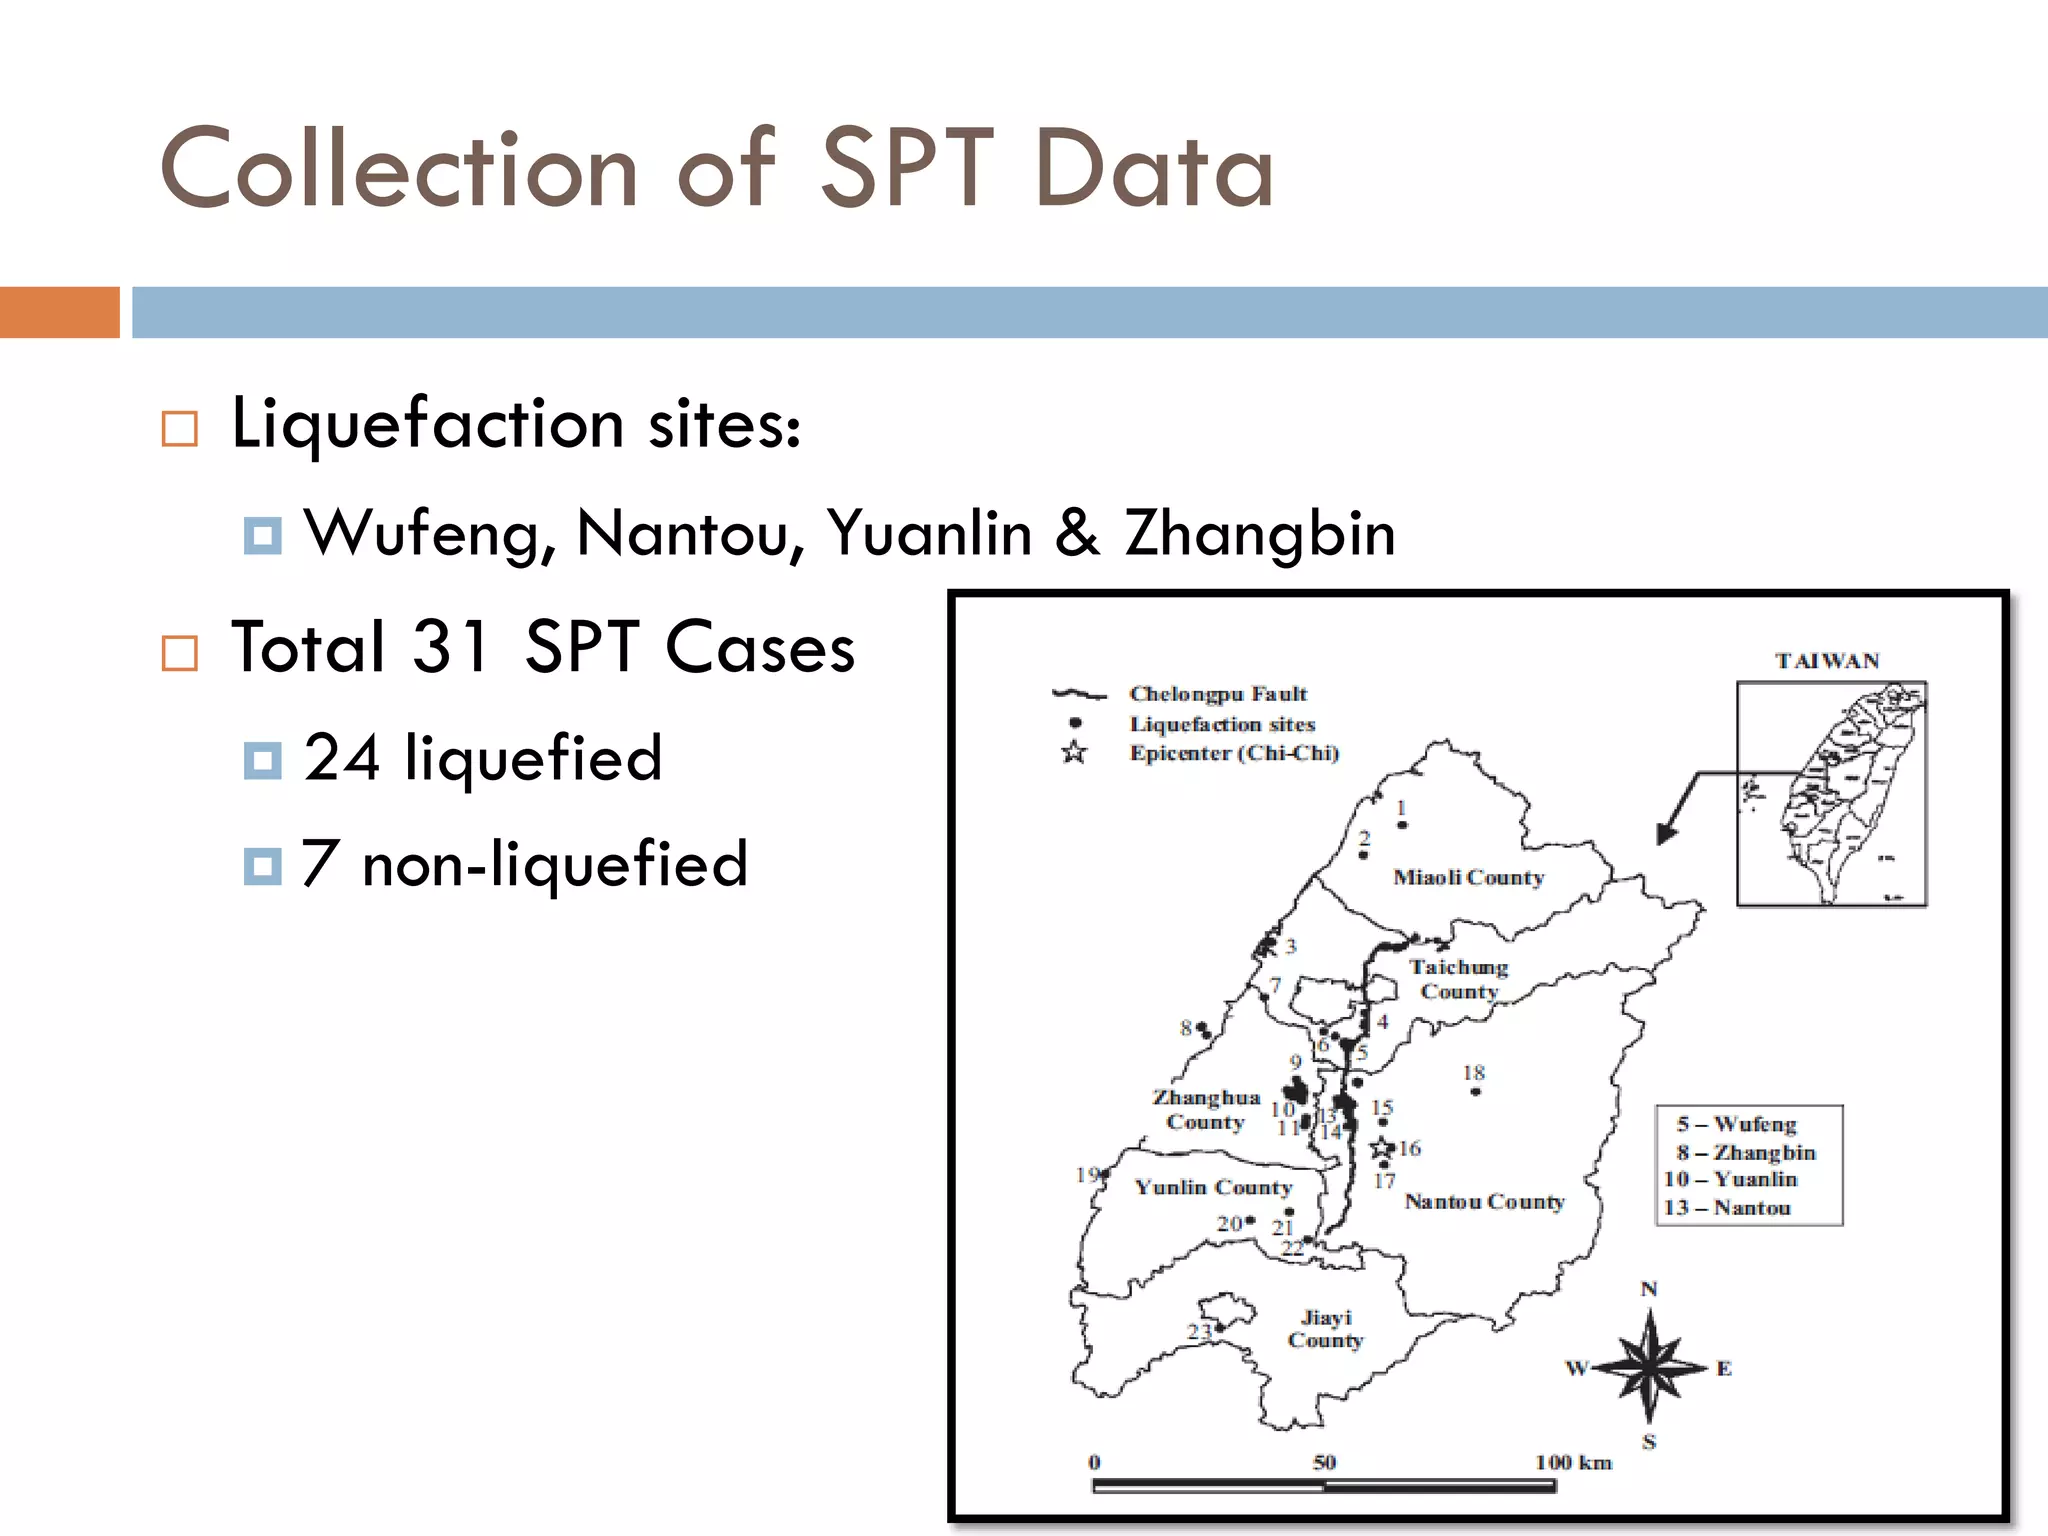
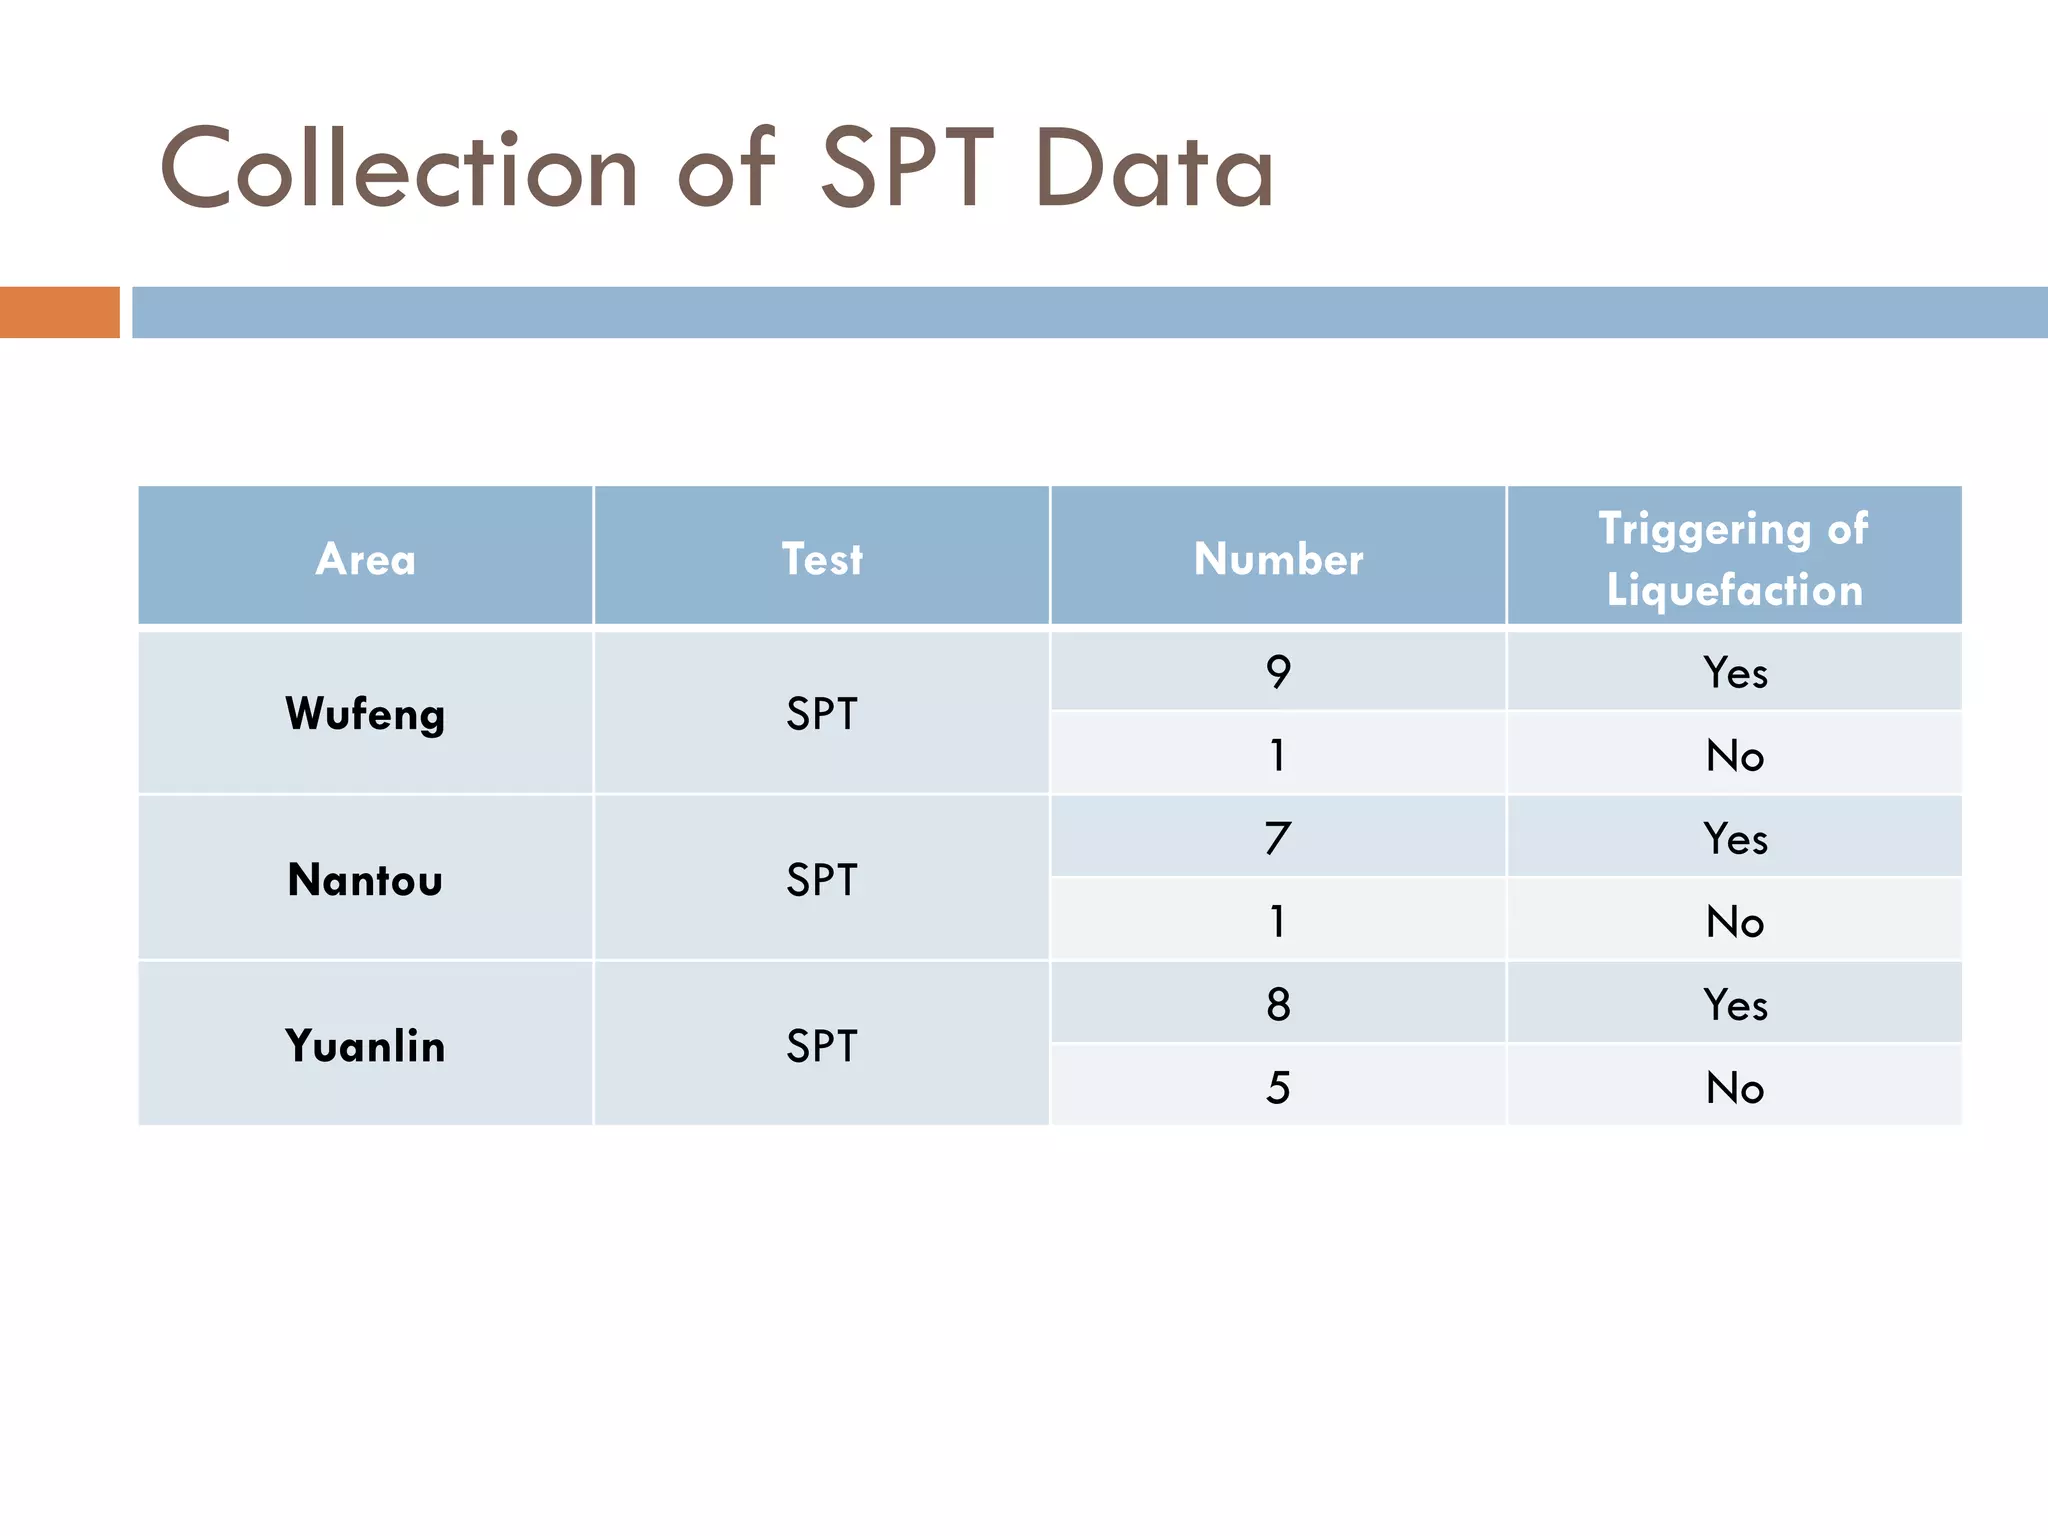
Definition and effects of liquefaction, identifying liquefiable soils, and assessment methods including Factor of Safety.
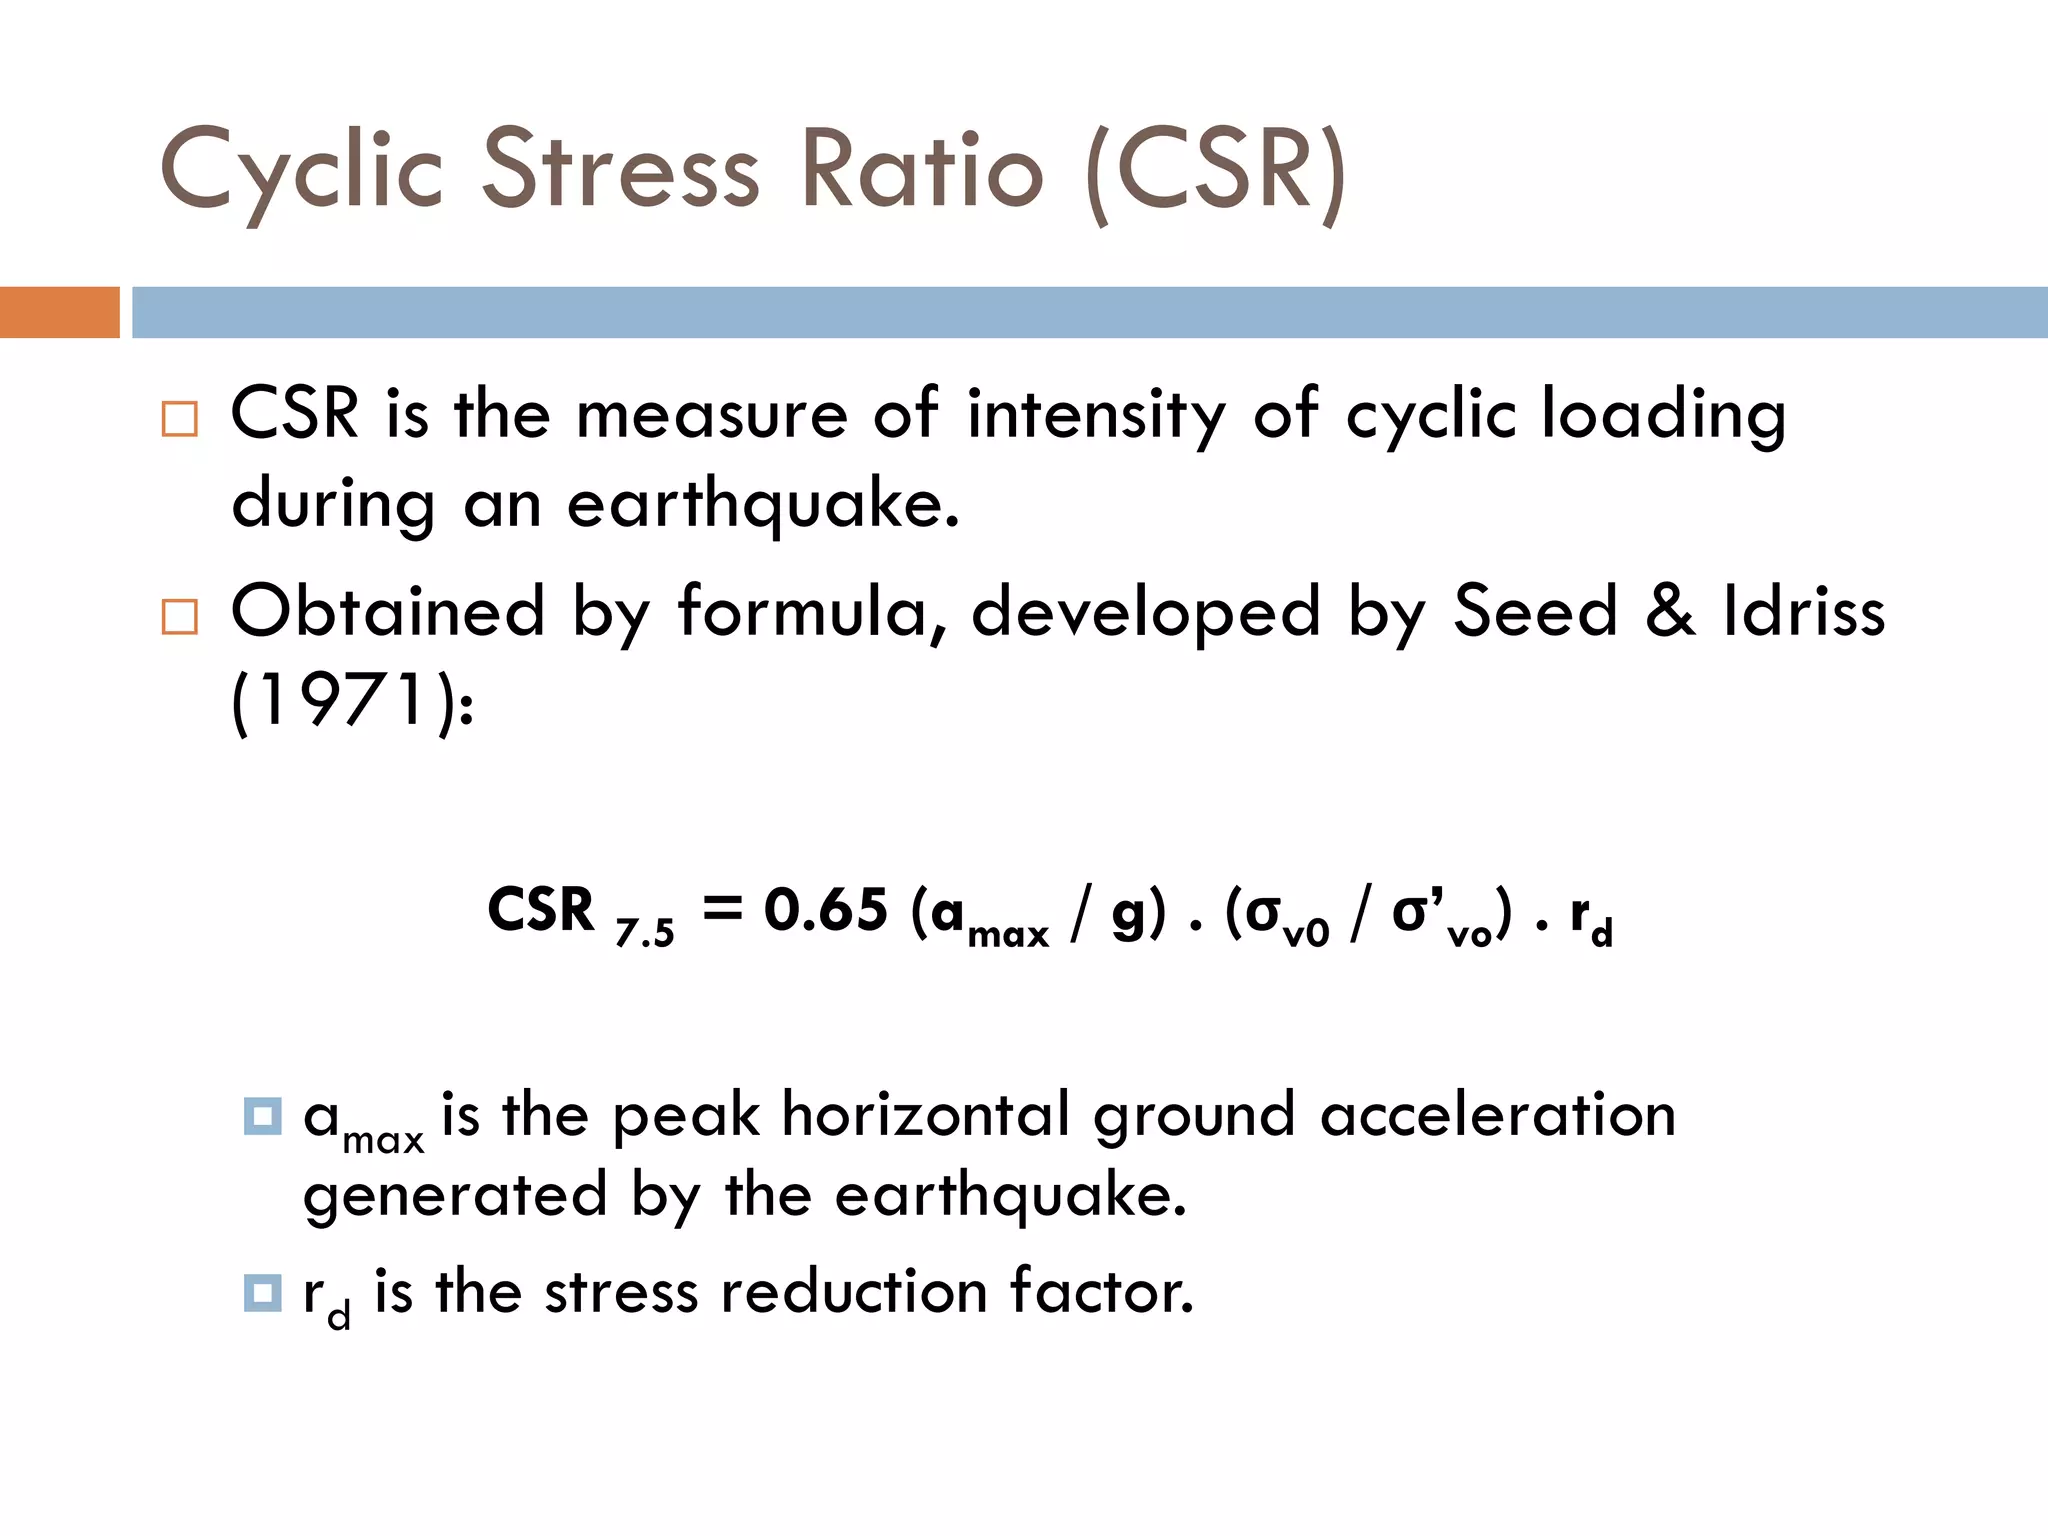
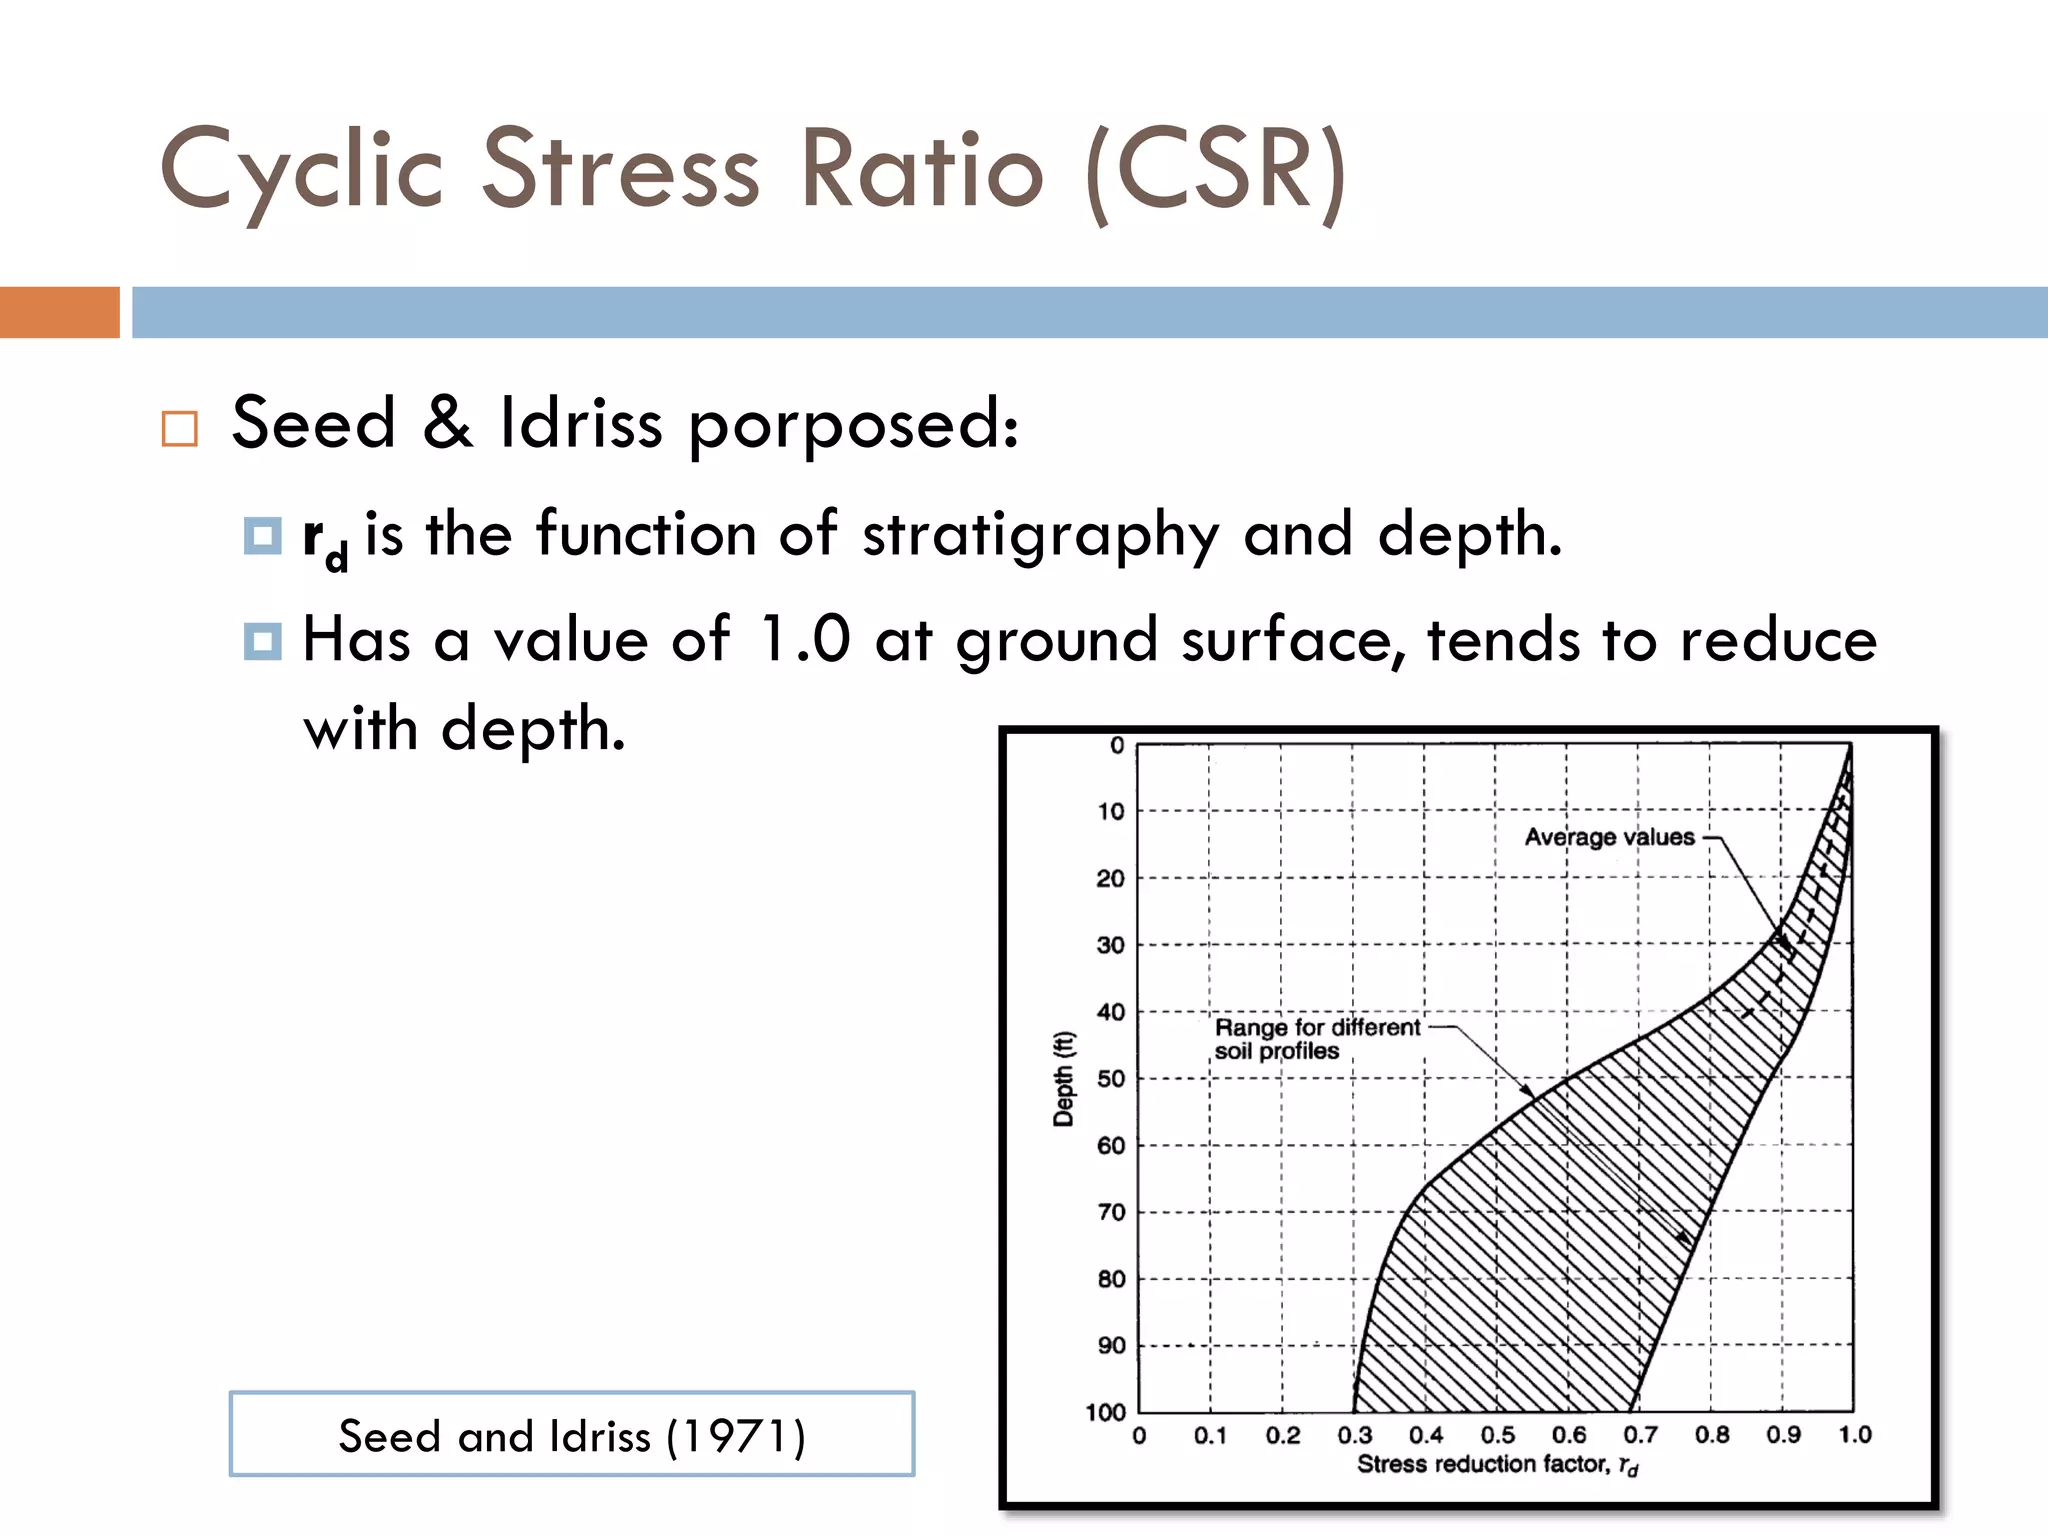
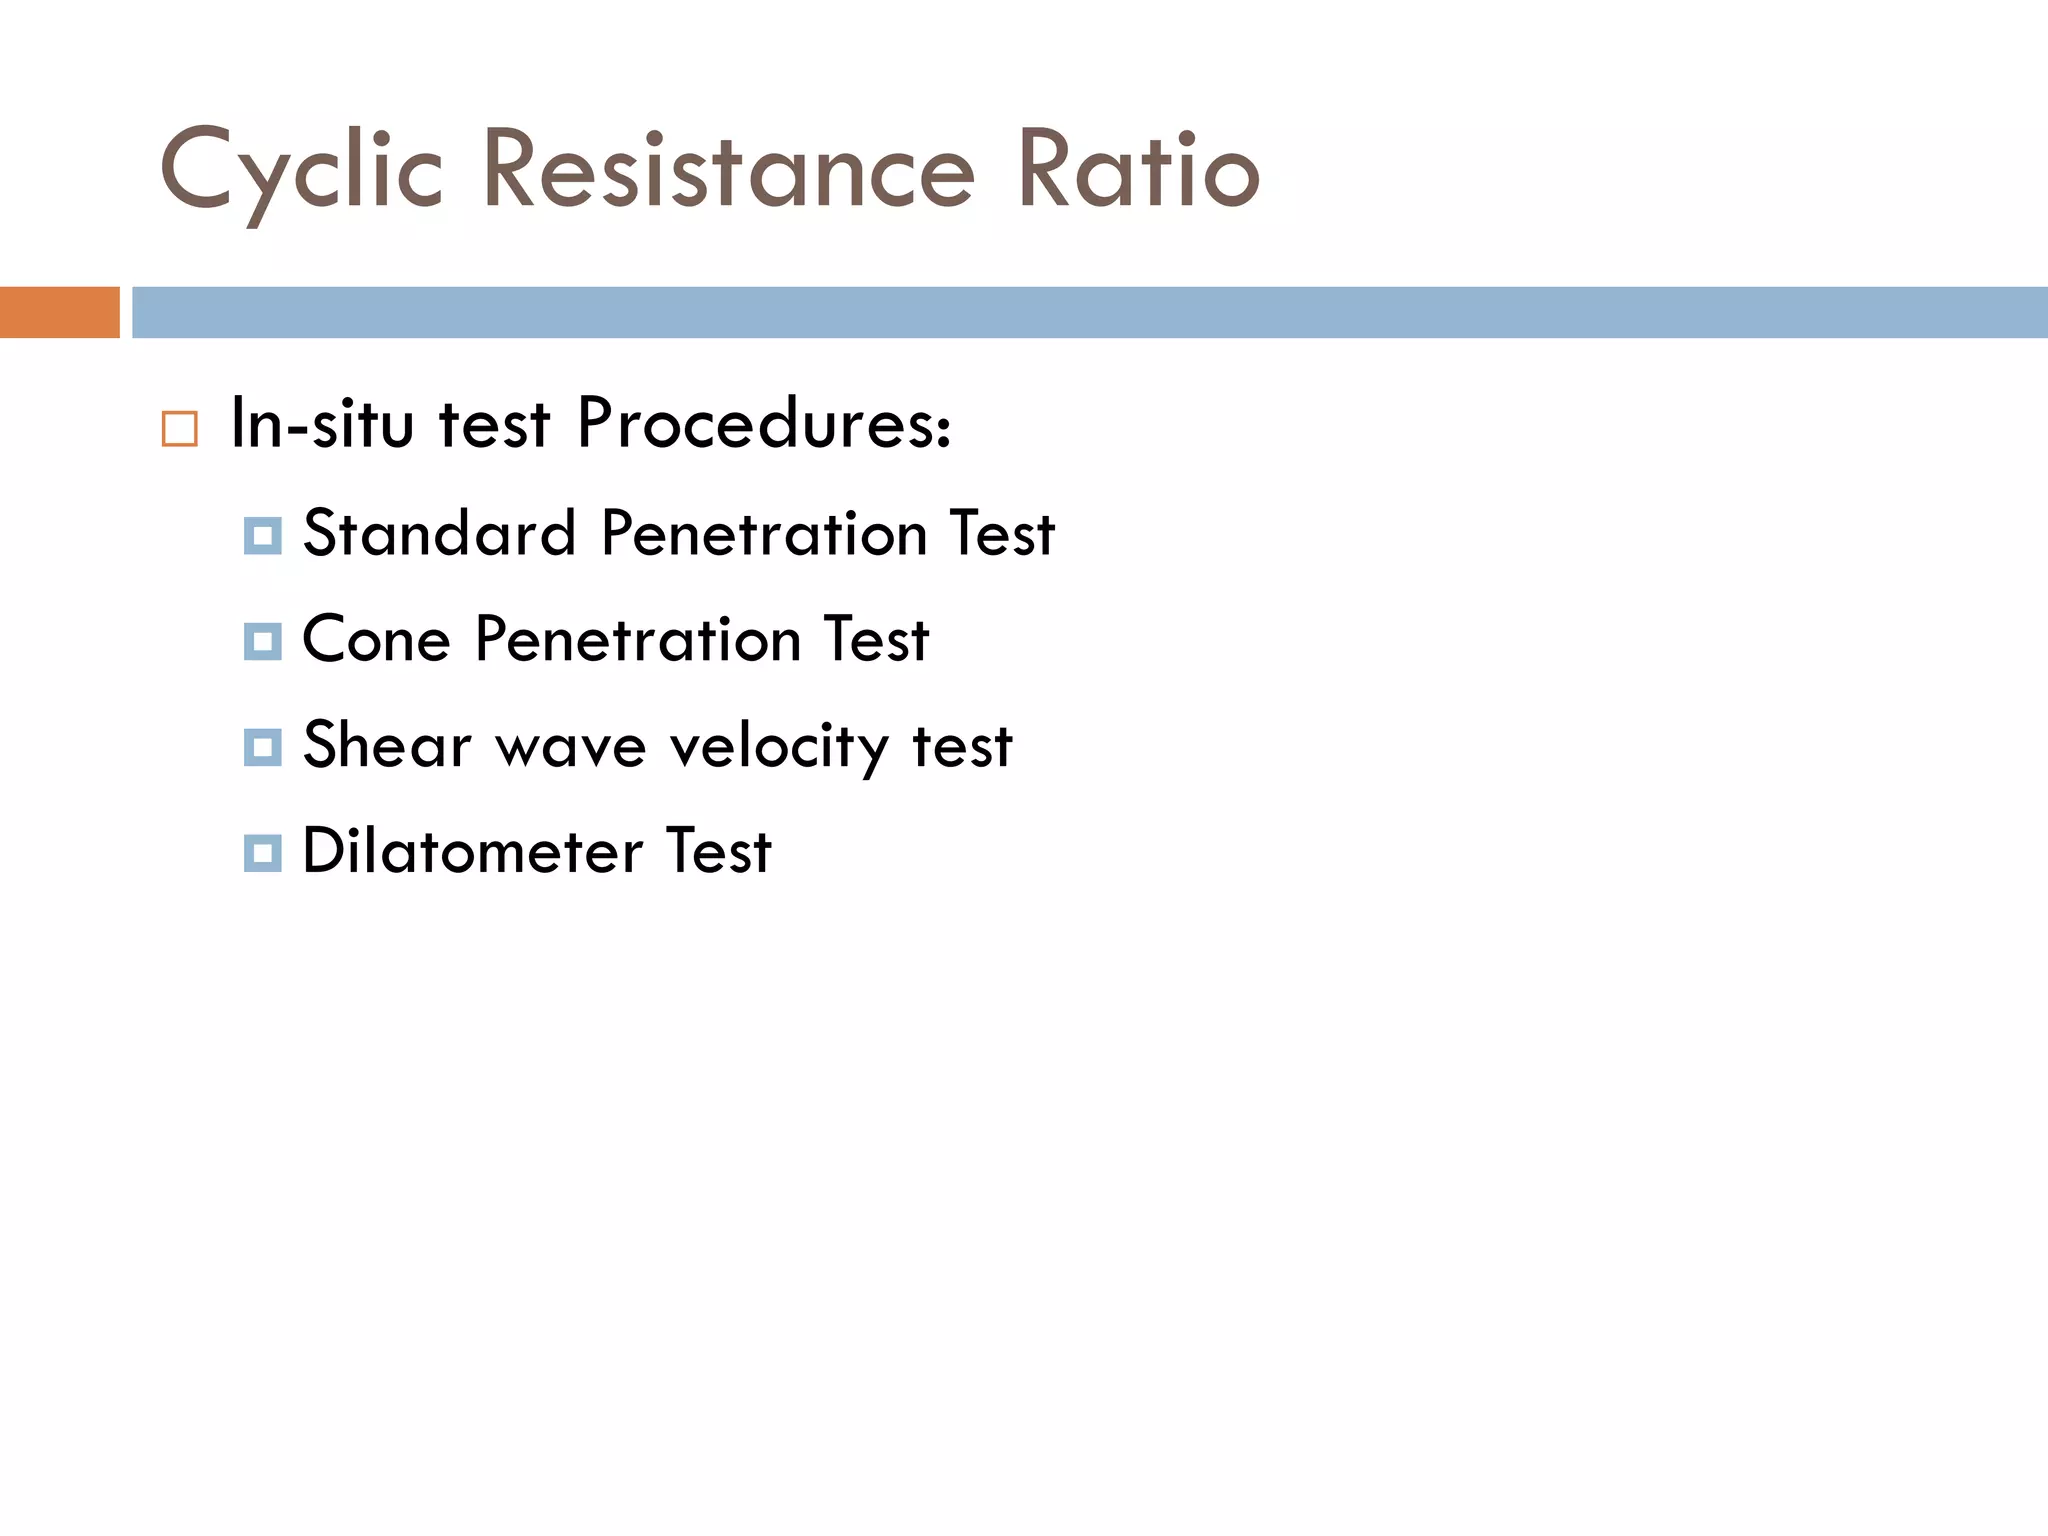
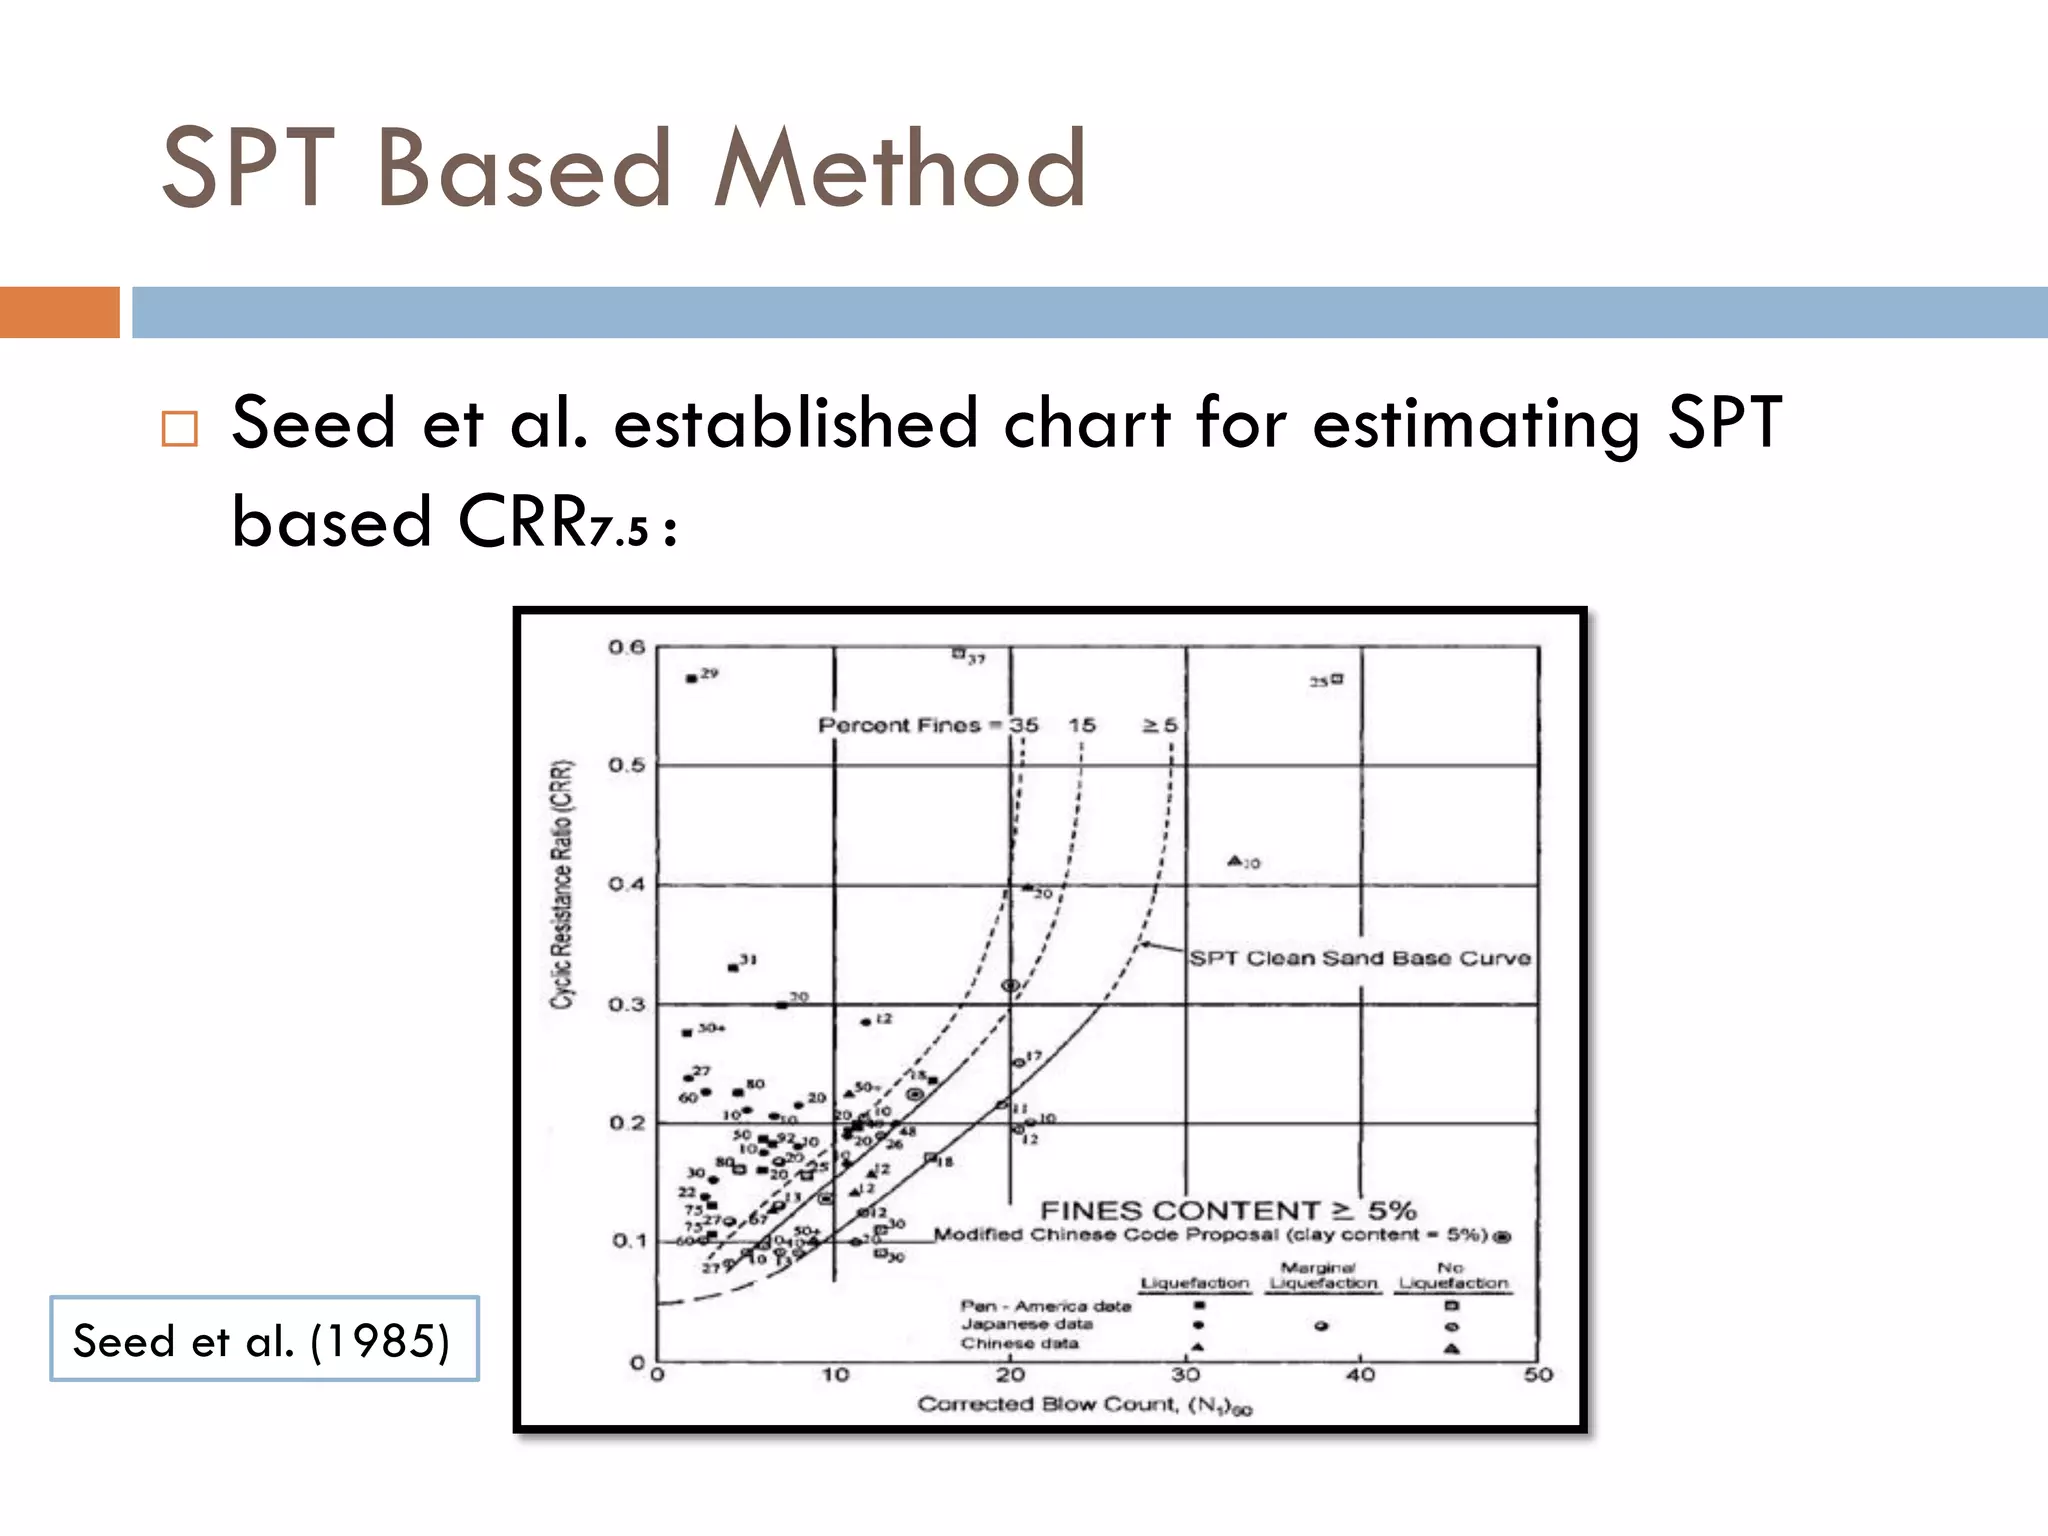
Explanation of CSR, its calculation methods, and in-situ testing procedures for assessing liquefaction potential.
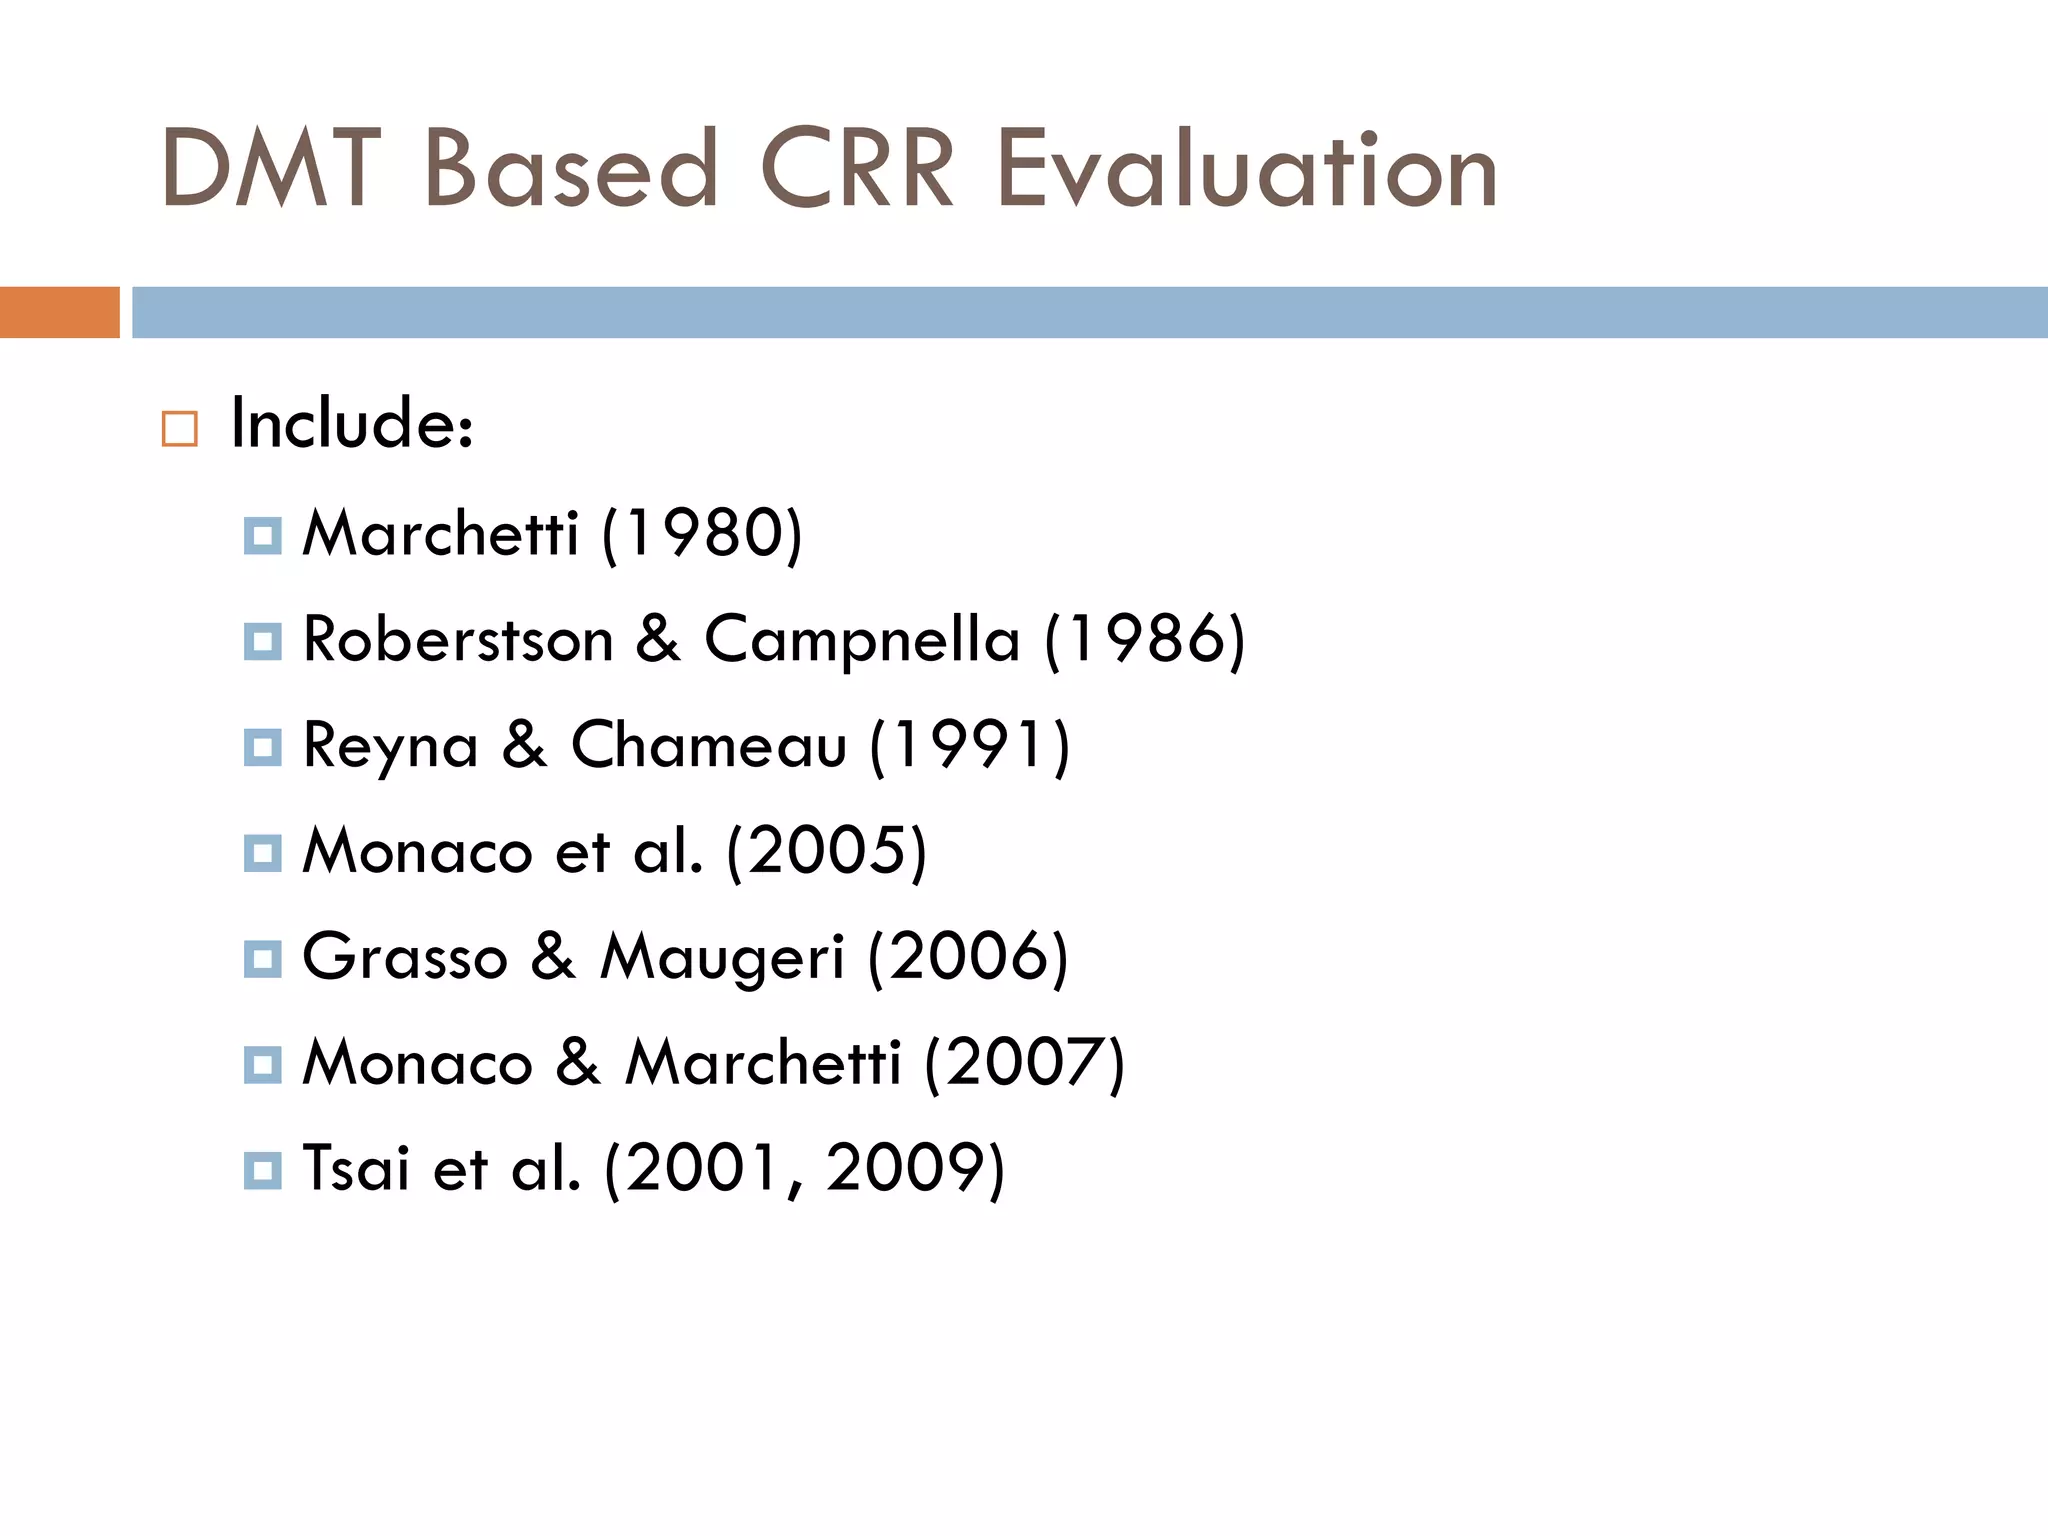
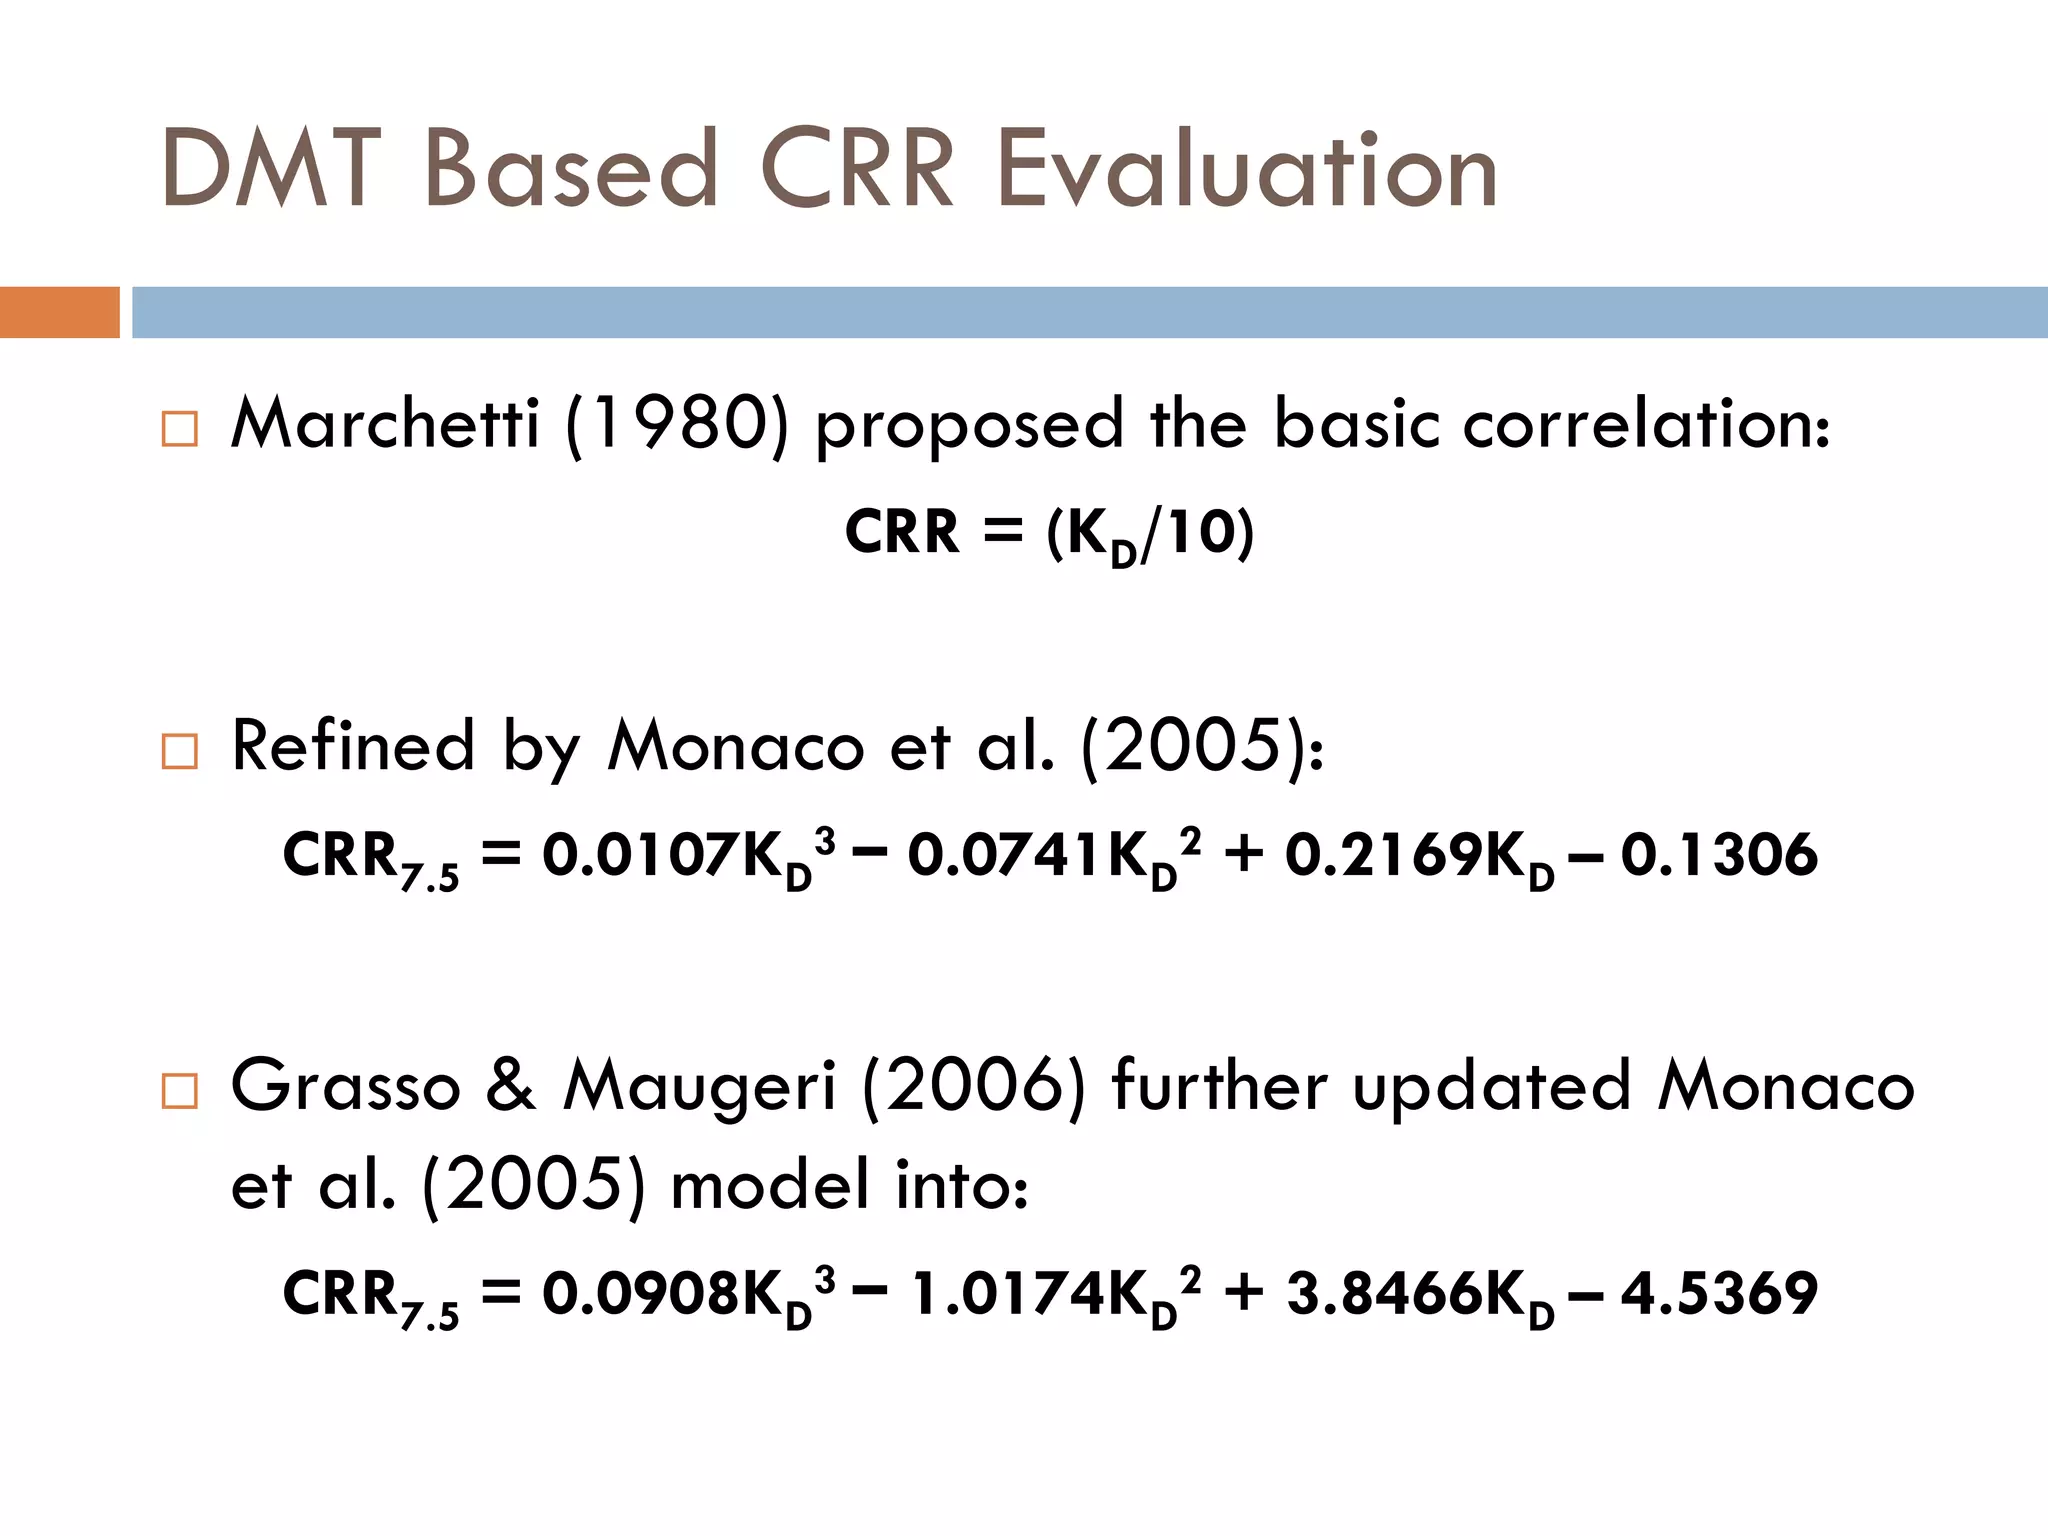
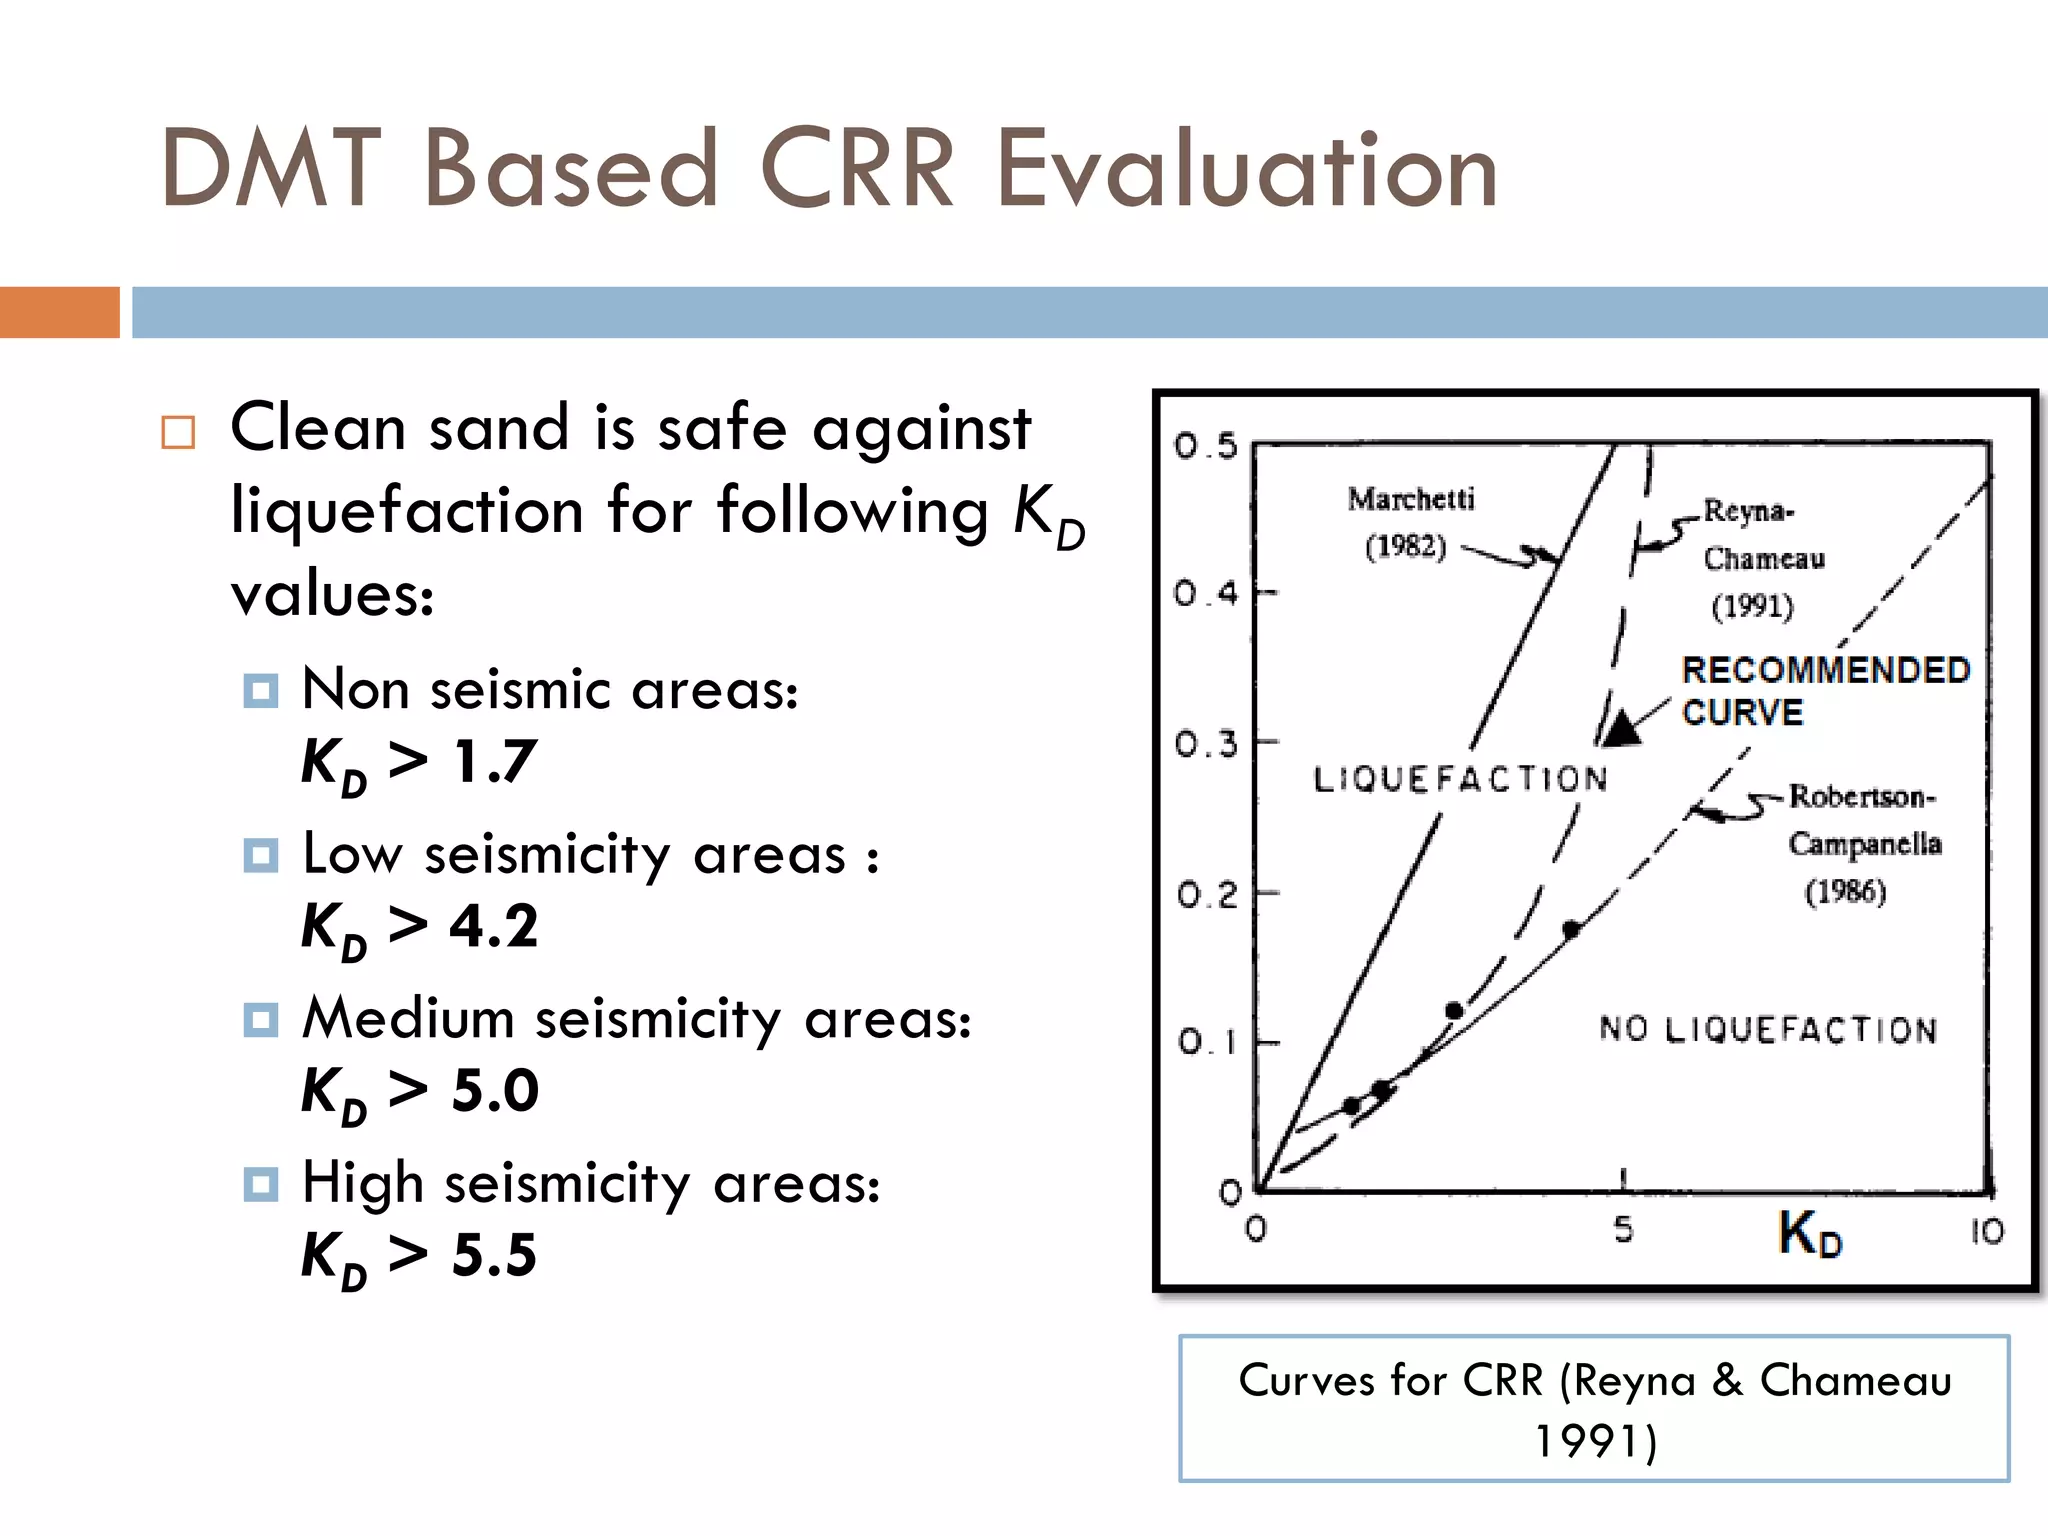
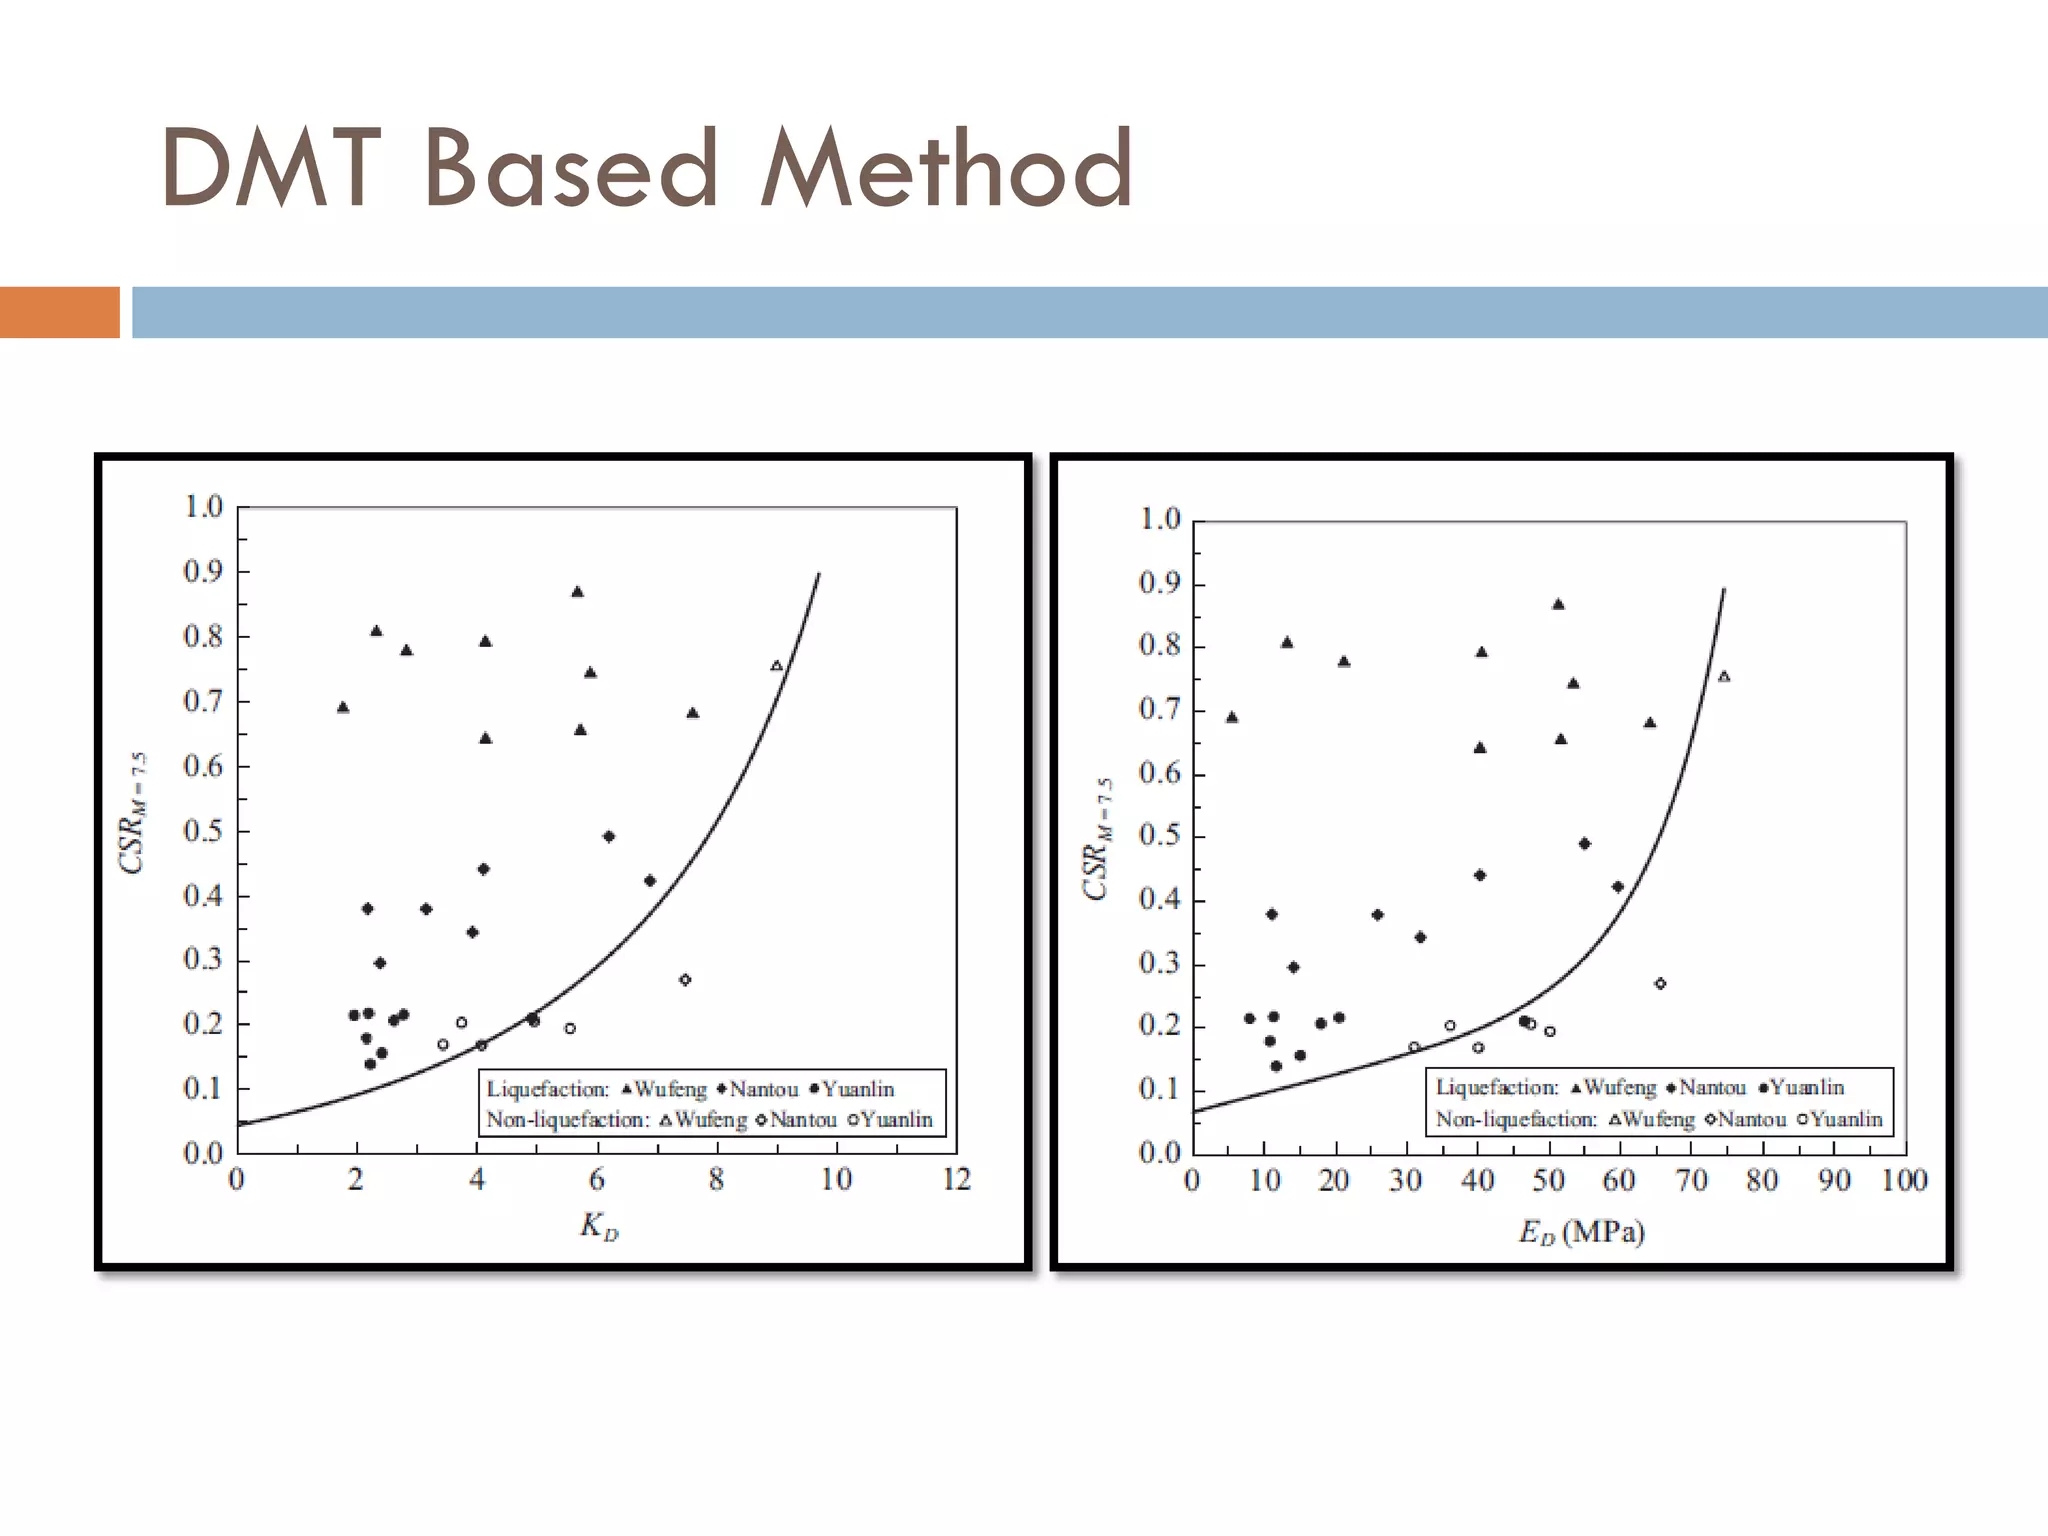
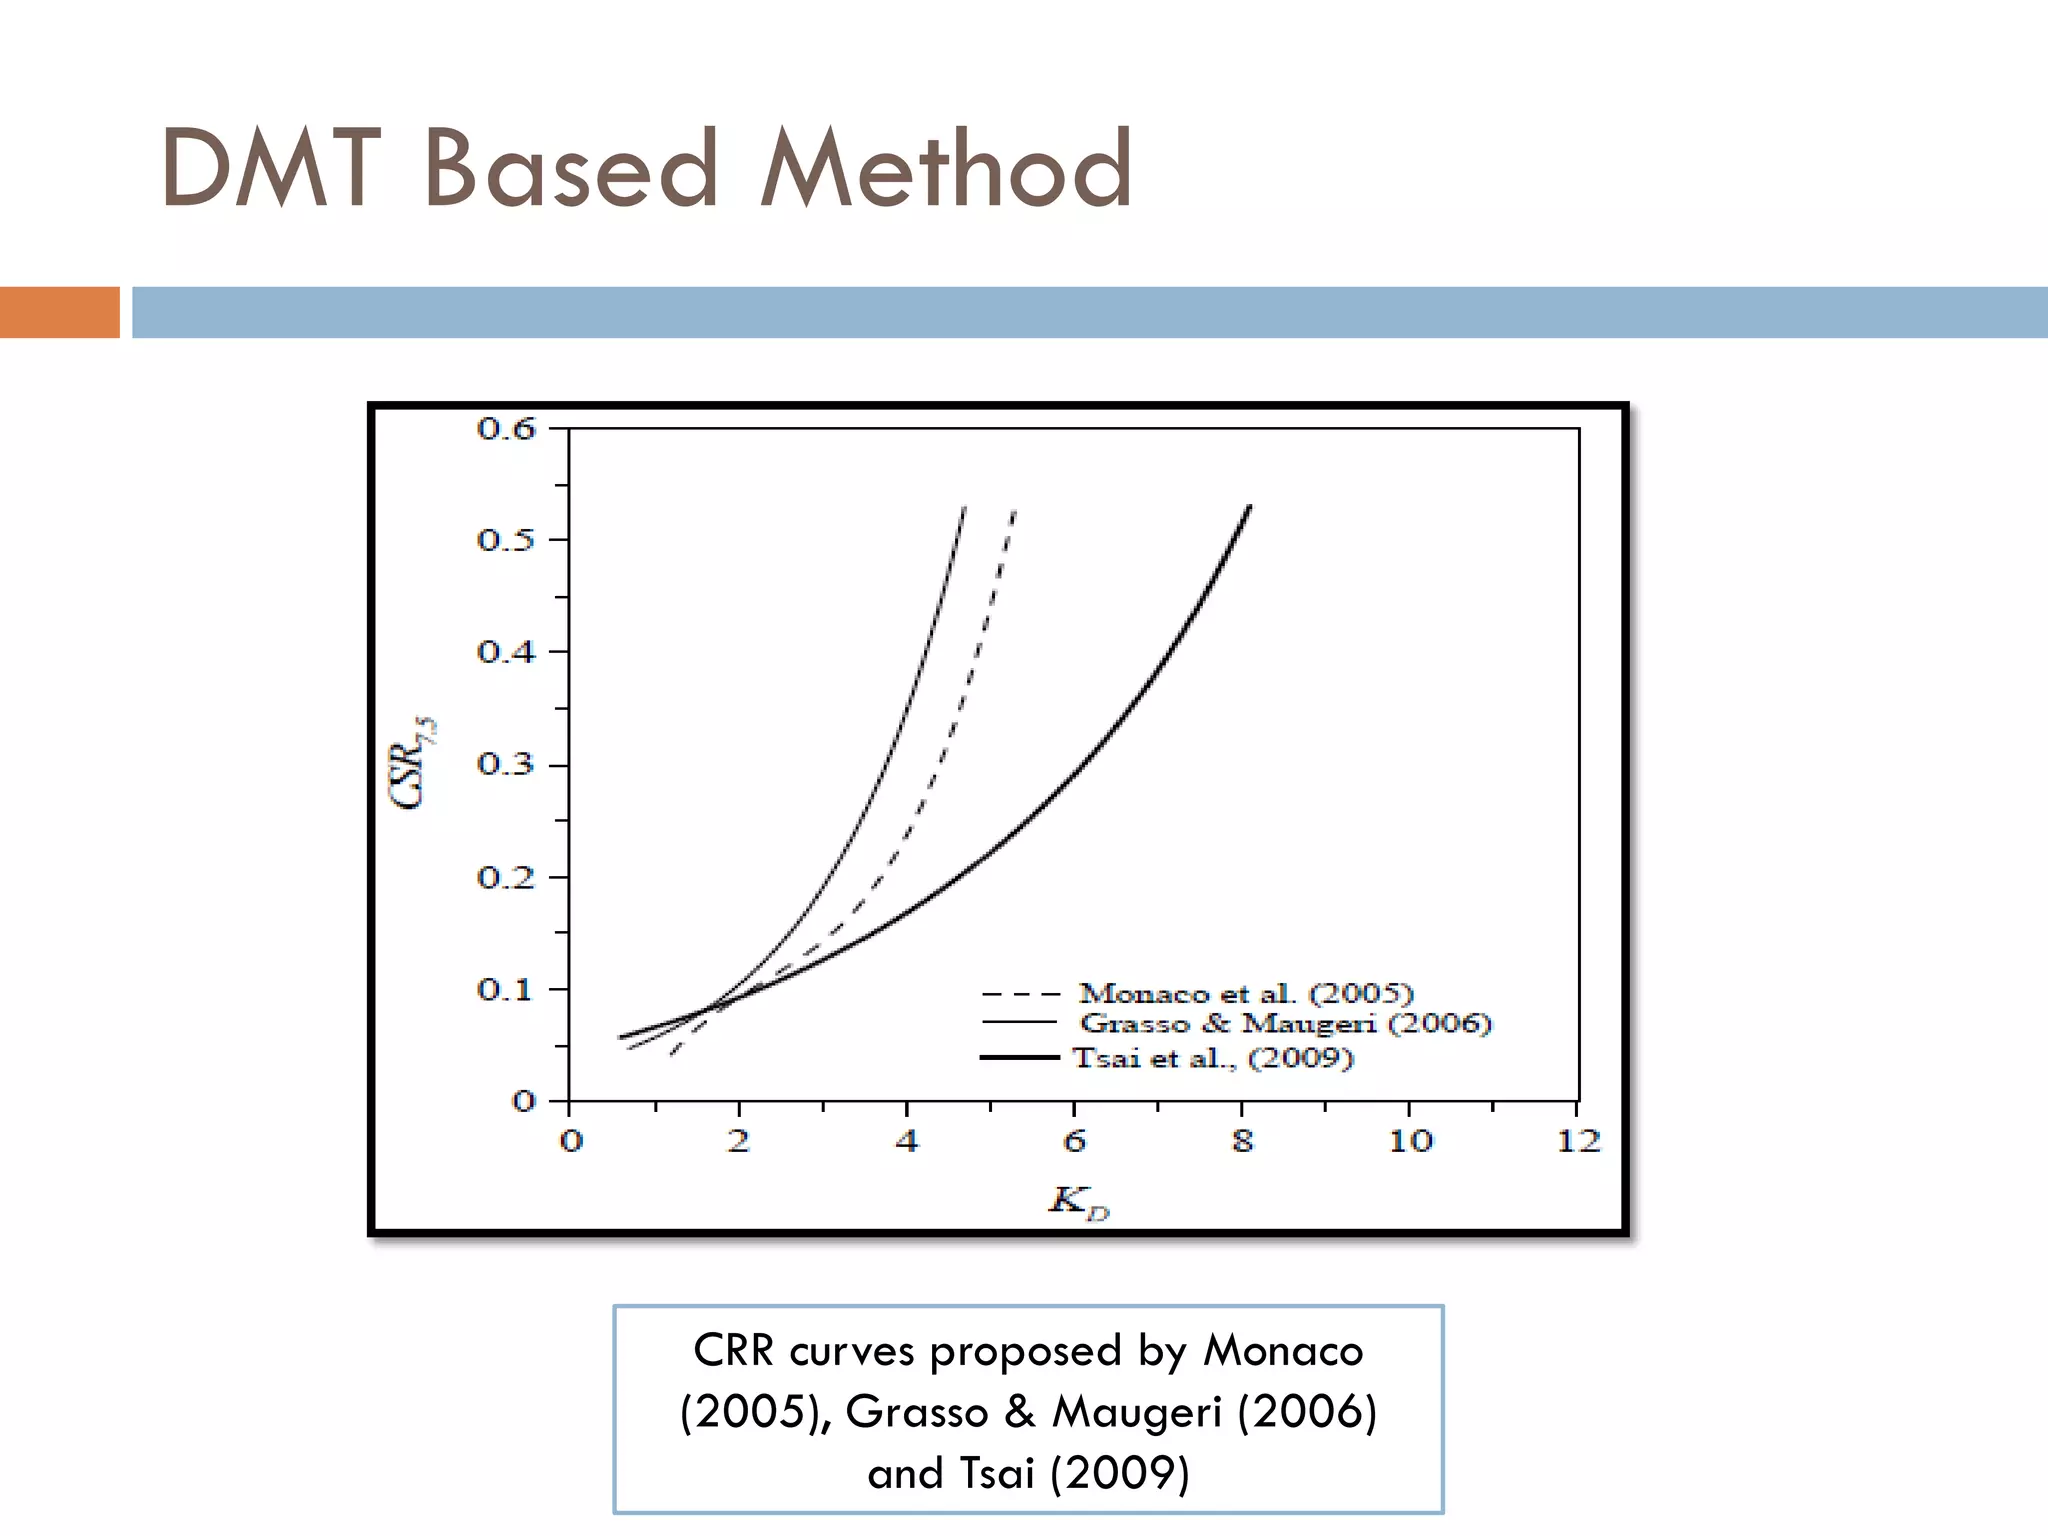
Evaluation of Cyclic Resistance Ratio using DMT correlations and development of boundary curves for liquefaction assessment.
Conclusions on the effectiveness of DMT in rapid soil assessment and recommendations for future testing.

![Geotechnical Engineering-I [Lec #19: Consolidation-III]](https://cdn.slidesharecdn.com/ss_thumbnails/19-180924141035-thumbnail.jpg?width=640&height=640&fit=bounds)
![Geotechnical Engineering-I [Lec #29: Soil Exploration - II]](https://cdn.slidesharecdn.com/ss_thumbnails/29-180924141840-thumbnail.jpg?width=640&height=640&fit=bounds)


![Geotechnical Engineering-II [Lec #28: Finite Slope Stability Analysis]](https://cdn.slidesharecdn.com/ss_thumbnails/28-181125070402-thumbnail.jpg?width=640&height=640&fit=bounds)
![Geotechnical Engineering-I [Lec #6: Sieve Analysis]](https://cdn.slidesharecdn.com/ss_thumbnails/6-180923180330-thumbnail.jpg?width=640&height=640&fit=bounds)


![Geotechnical Engineering-I [Lec #2: Introduction-2]](https://cdn.slidesharecdn.com/ss_thumbnails/2-180923175525-thumbnail.jpg?width=640&height=640&fit=bounds)


![[3a] Equivalent CPT-DMT Settlement Method.pdf](https://cdn.slidesharecdn.com/ss_thumbnails/3aequivalentcpt-dmtsettlementmethod-240111182014-cbce5ca8-thumbnail.jpg?width=640&height=640&fit=bounds)


