Downloaded 18 times
![Acta Geod. Geoph. Hung., Vol. 46(3), pp. 347–369 (2011)
DOI: 10.1556/AGeod.46.2011.3.6
LIQUEFACTION AND POST-LIQUEFACTION
SETTLEMENT ASSESSMENT — A PROBABILISTIC
APPROACH
E Gy˝ori1
, L T´oth1
, Z Gr´aczer1
, T Katona2
1Seismological Department, Geodetic and Geophysical Research Institute
of the Hungarian Academy of Sciences, Meredek u. 18, H-1118 Budapest, Hungary,
e-mail: gyori@seismology.hu
2Paks Nuclear Power Plant, Hungary
[Manuscript received June 22, 2011; accepted July 28, 2011]
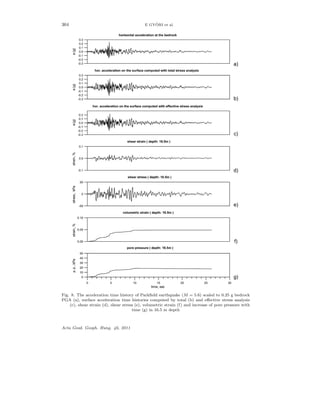
Low velocity surface layers can significantly increase ground accelerations during
earthquakes. When saturated sandy sediments are present, because of pore pres-
sure increase, decrease of soil strength or even liquefaction can occur. Some volume
change follows the dissipation of excess pore pressure after the earthquake resulting
surface settlements. To determine the liquefaction probability and post-liquefaction
settlement is very important for critical facilities e.g. for the site of Paks Nuclear
Power Plant, Hungary. Pore pressure increase and so the liquefaction and surface
settlements depend on the characteristics of seismic loading and soil parameters. To
quantify the extent of these phenomena is rather difficult. Uncertainties arise both
from the probabilistic nature of the earthquake loading and from the simplifications of
soil models as well. In the paper, the most important semi-empirical and dynamical
effective stress methods for liquefaction and post-liquefaction settlement assessment
are summarized. Most significant contributors to the uncertainties are highlighted,
and particular examples through the investigation of Paks NPP site are given. Fi-
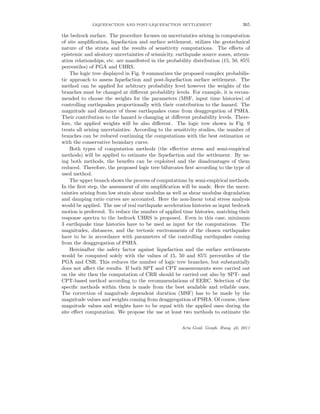
nally, a probabilistic procedure is proposed where the uncertainties will be taken into
account by applying a logic tree methodology. At the same time, the uncertainties
are reduced by the use of site-specific UHRS and stress reduction factors.
Keywords: liquefaction; logic tree methodology; Paks NPP; site amplification;
surface settlement; uncertainties
1. Introduction
Low velocity surface layers can significantly increase ground accelerations during
earthquakes. Besides strong shaking, soil failures can also occur causing damages
to built environment. When cohesionless loose granular soils can be found in the
upper strata, in dry conditions, shaking can induce compaction and settlement of
the ground; this phenomenon is called seismic settlement. Dry or nearly dry sands
densify very quickly; settlement of such deposits is usually complete by the end of
the earthquake. When saturated sandy deposits are subjected to shaking during
an earthquake, pore water pressure builds up leading to loss of strength or even
liquefaction. Some volume change follows the dissipation of excess pore pressure
1217-8977/$ 20.00 c 2011 Akad´emiai Kiad´o, Budapest](https://image.slidesharecdn.com/paperliquefaction1-150510003205-lva1-app6892/85/Paper-liquefaction-1-320.jpg)
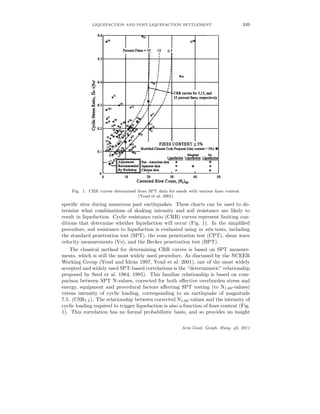

1. The document summarizes methods for assessing liquefaction and post-liquefaction settlement, including simplified and effective stress methods. 2. Simplified methods use empirical correlations between in-situ tests like SPT and CPT to determine liquefaction potential, while effective stress methods directly model pore pressure buildup using constitutive soil models. 3. Both methods have uncertainties from earthquake loading, soil properties, and testing, though effective stress modeling is more accurate but relies on precise soil parameters. The document proposes a probabilistic approach using logic trees to account for uncertainties.


