Download to read offline


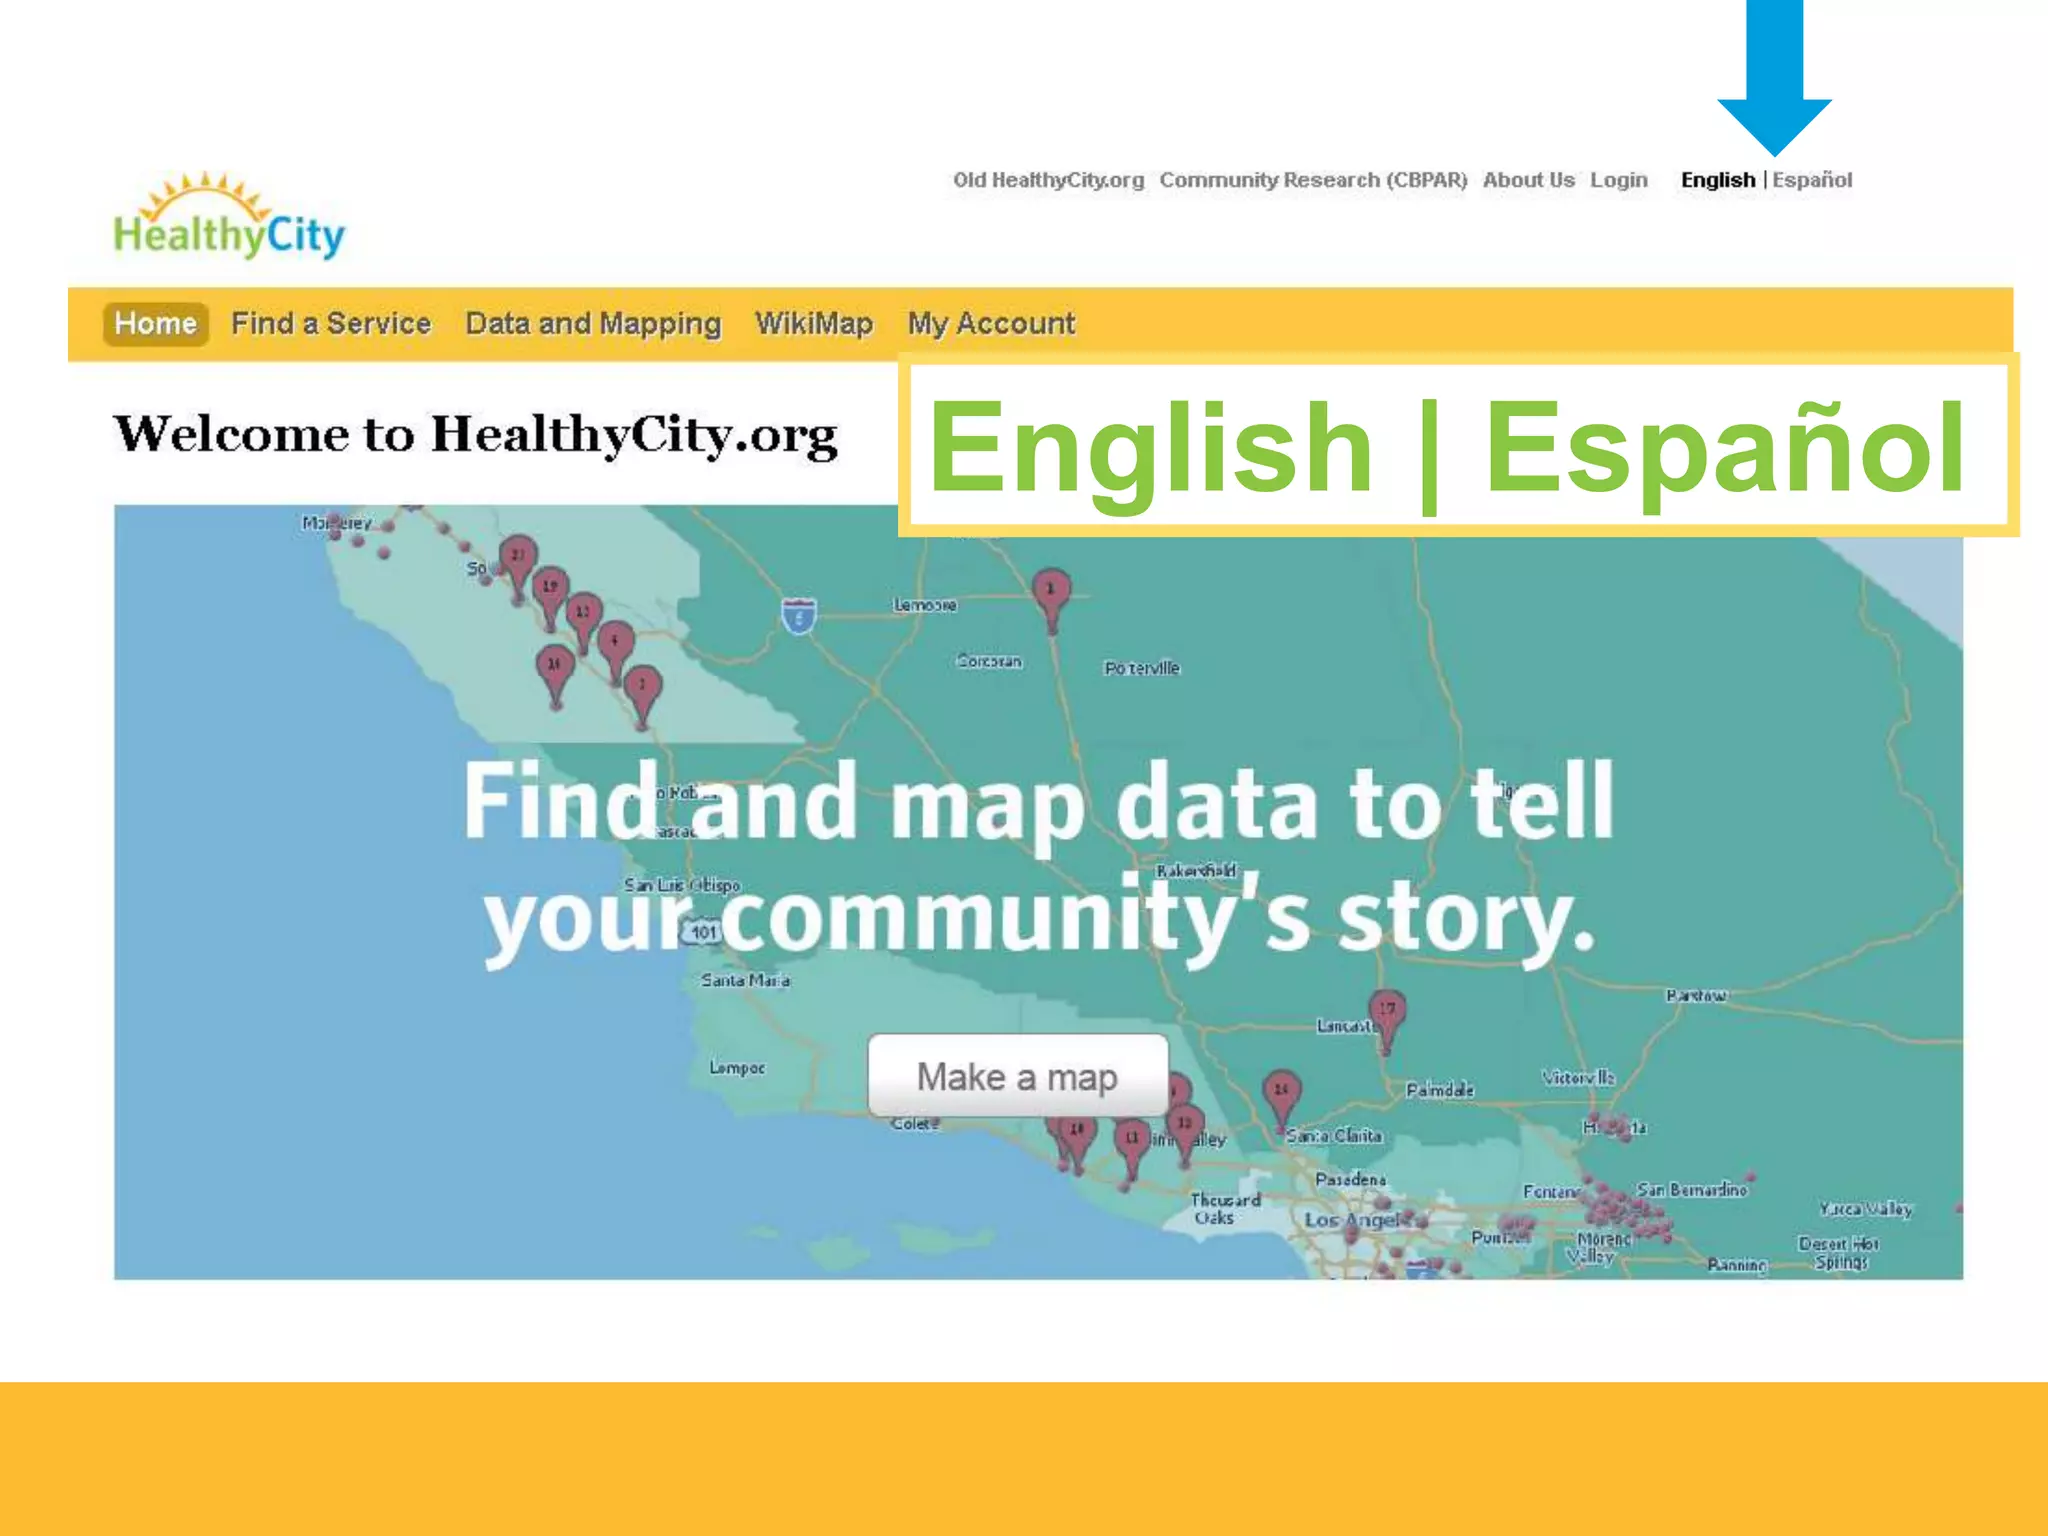
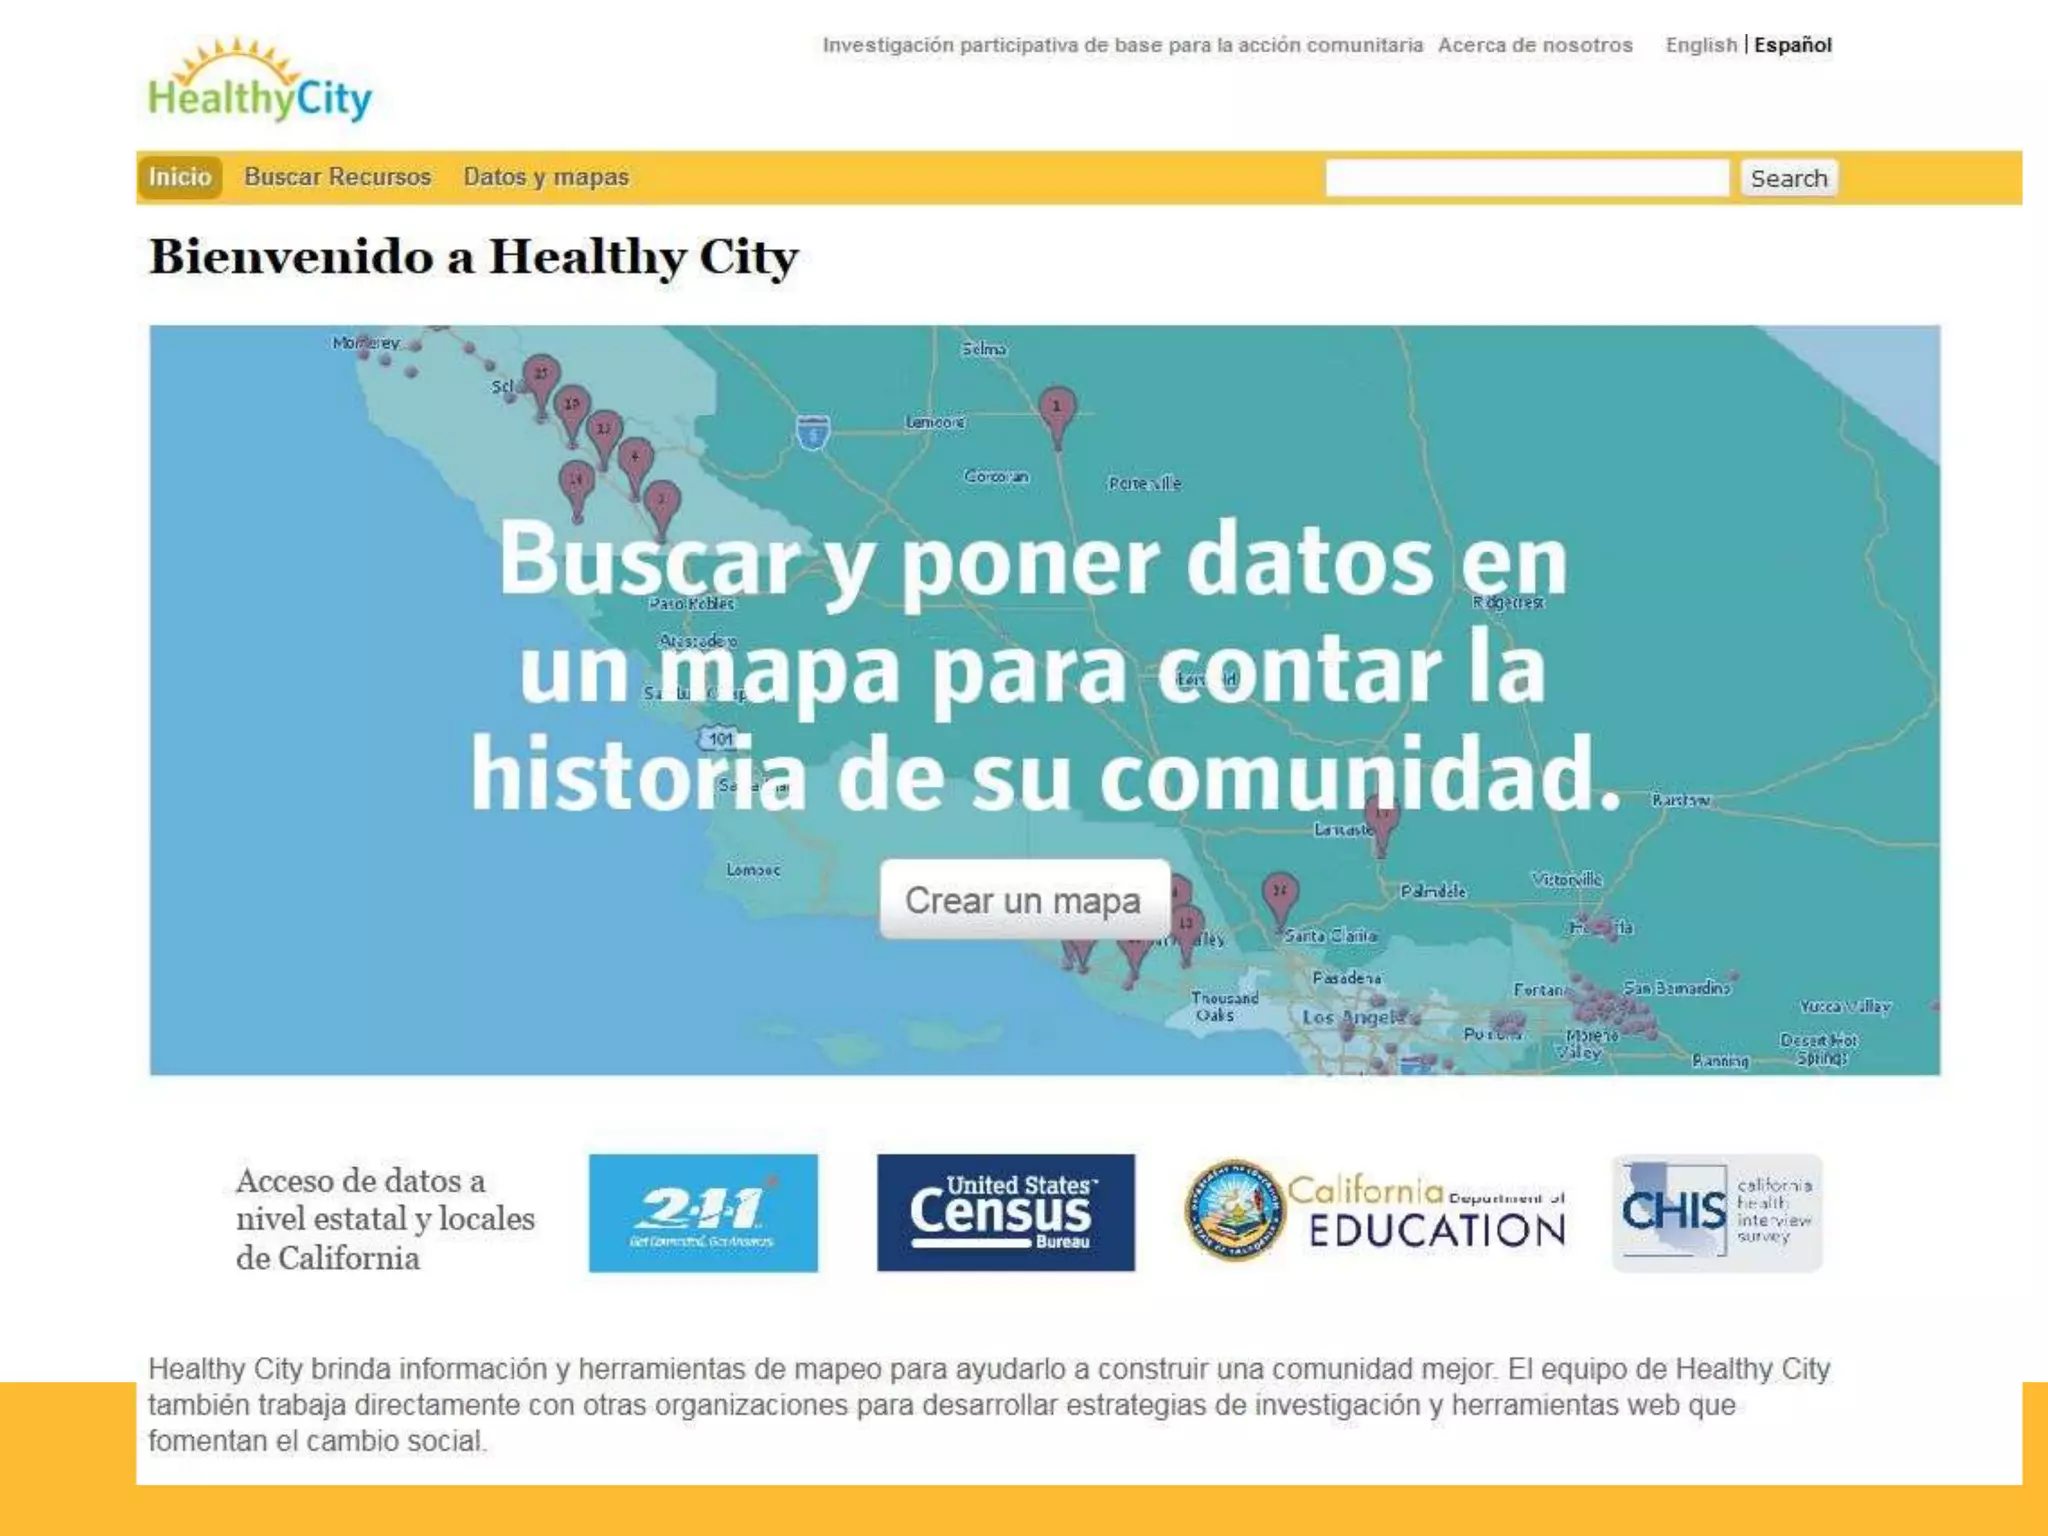
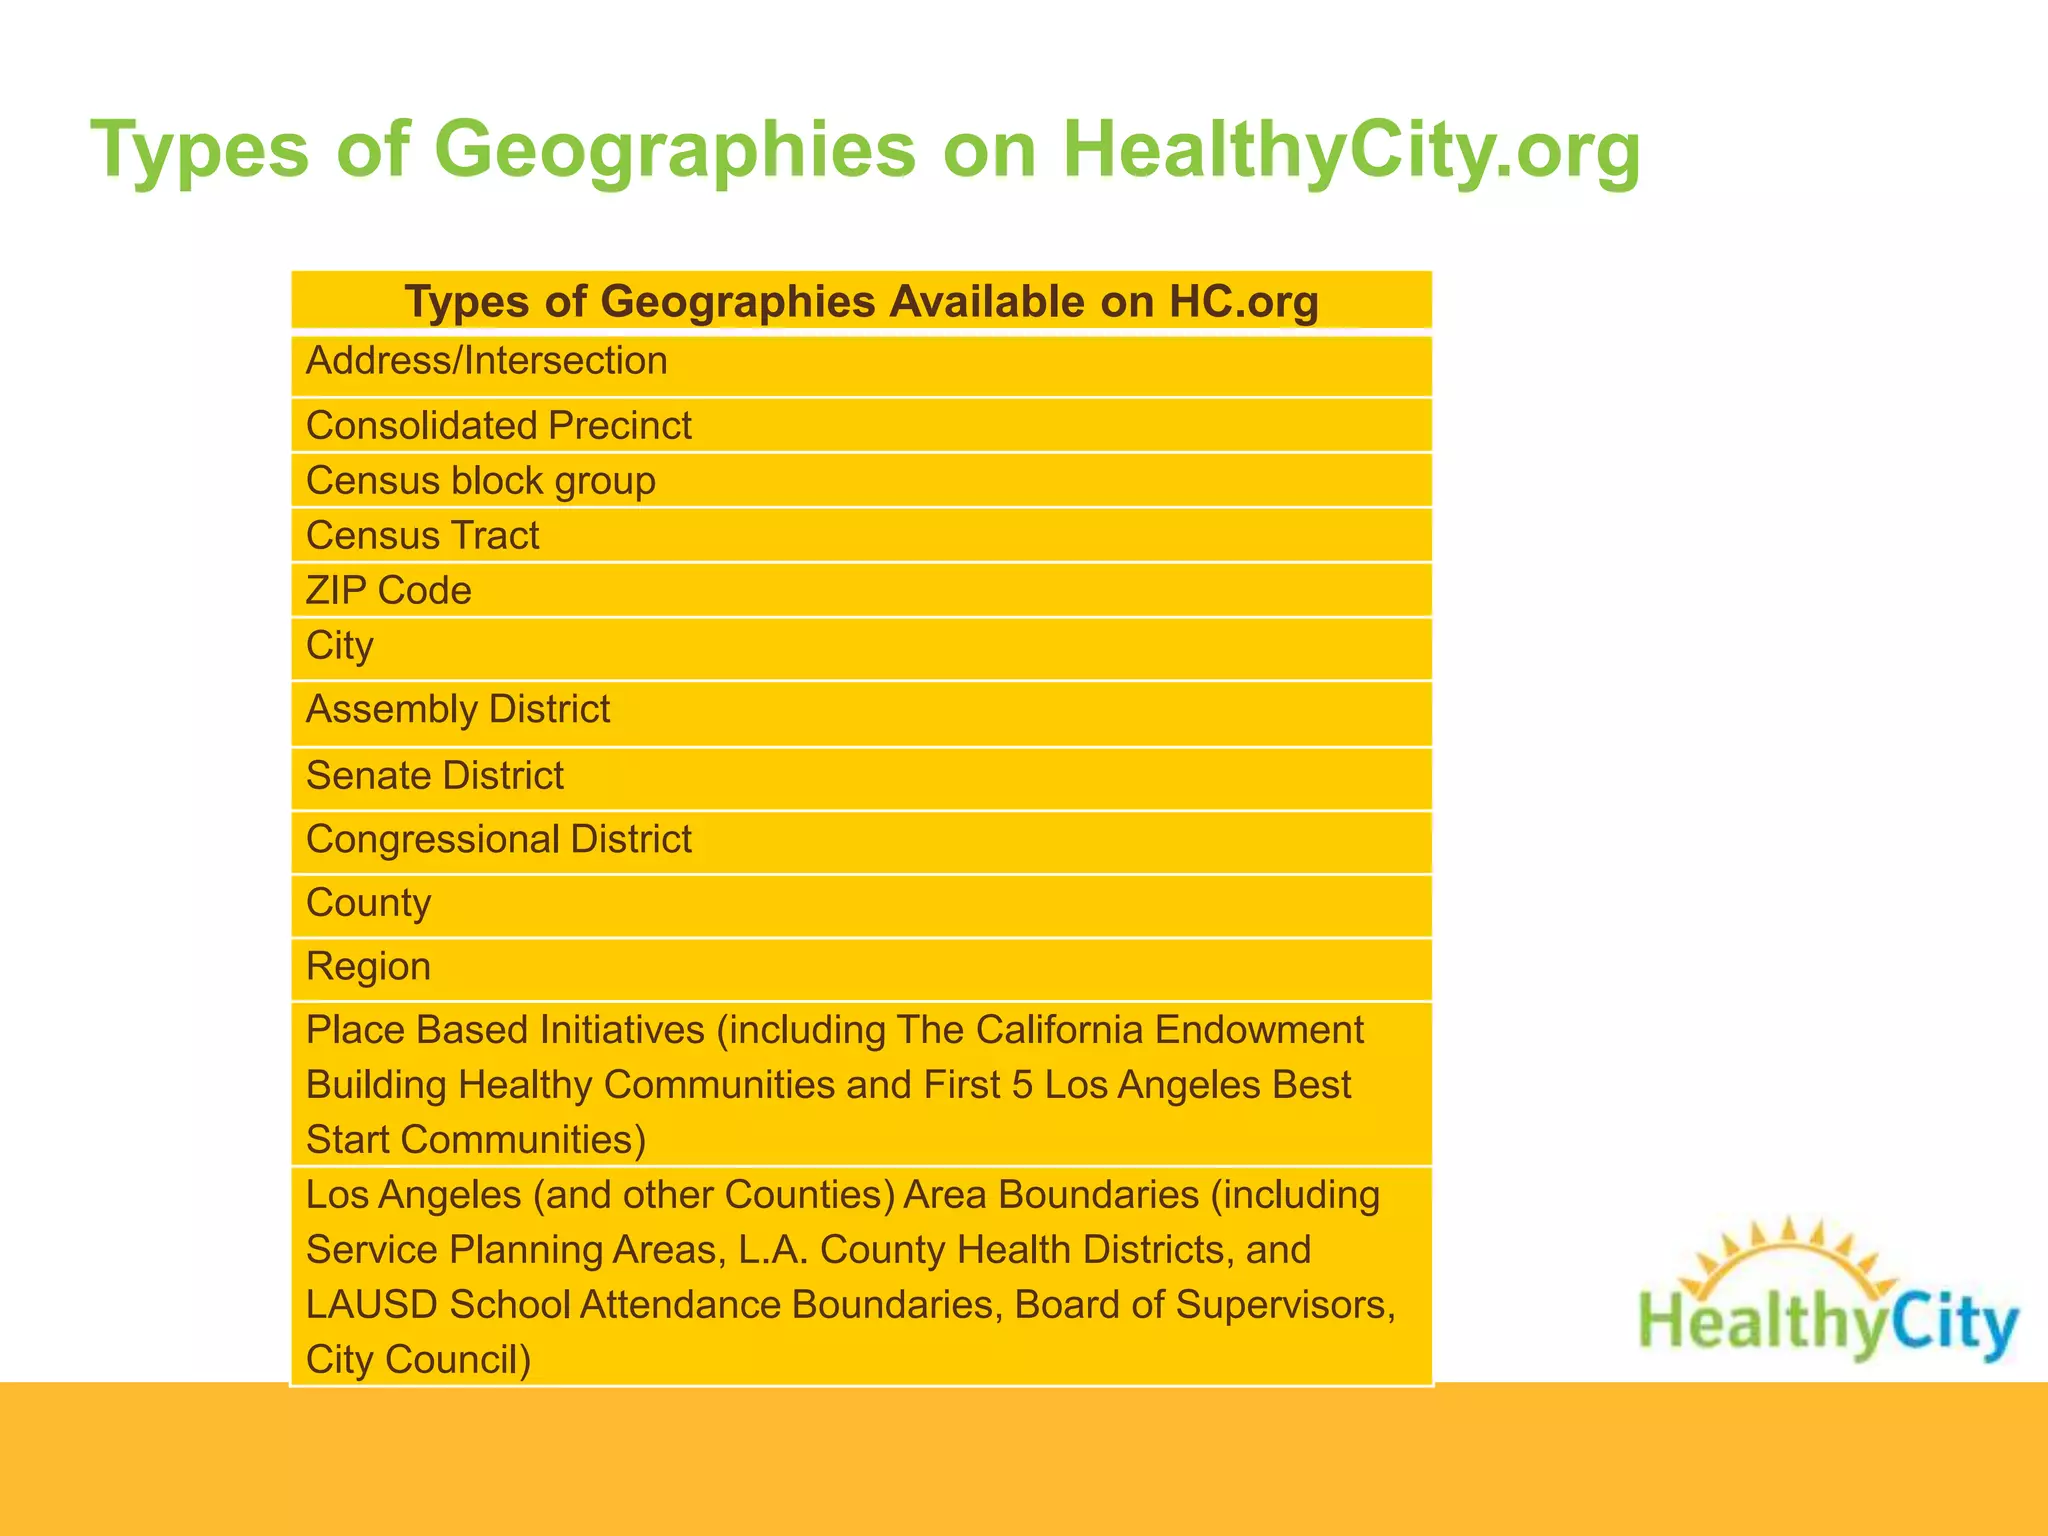
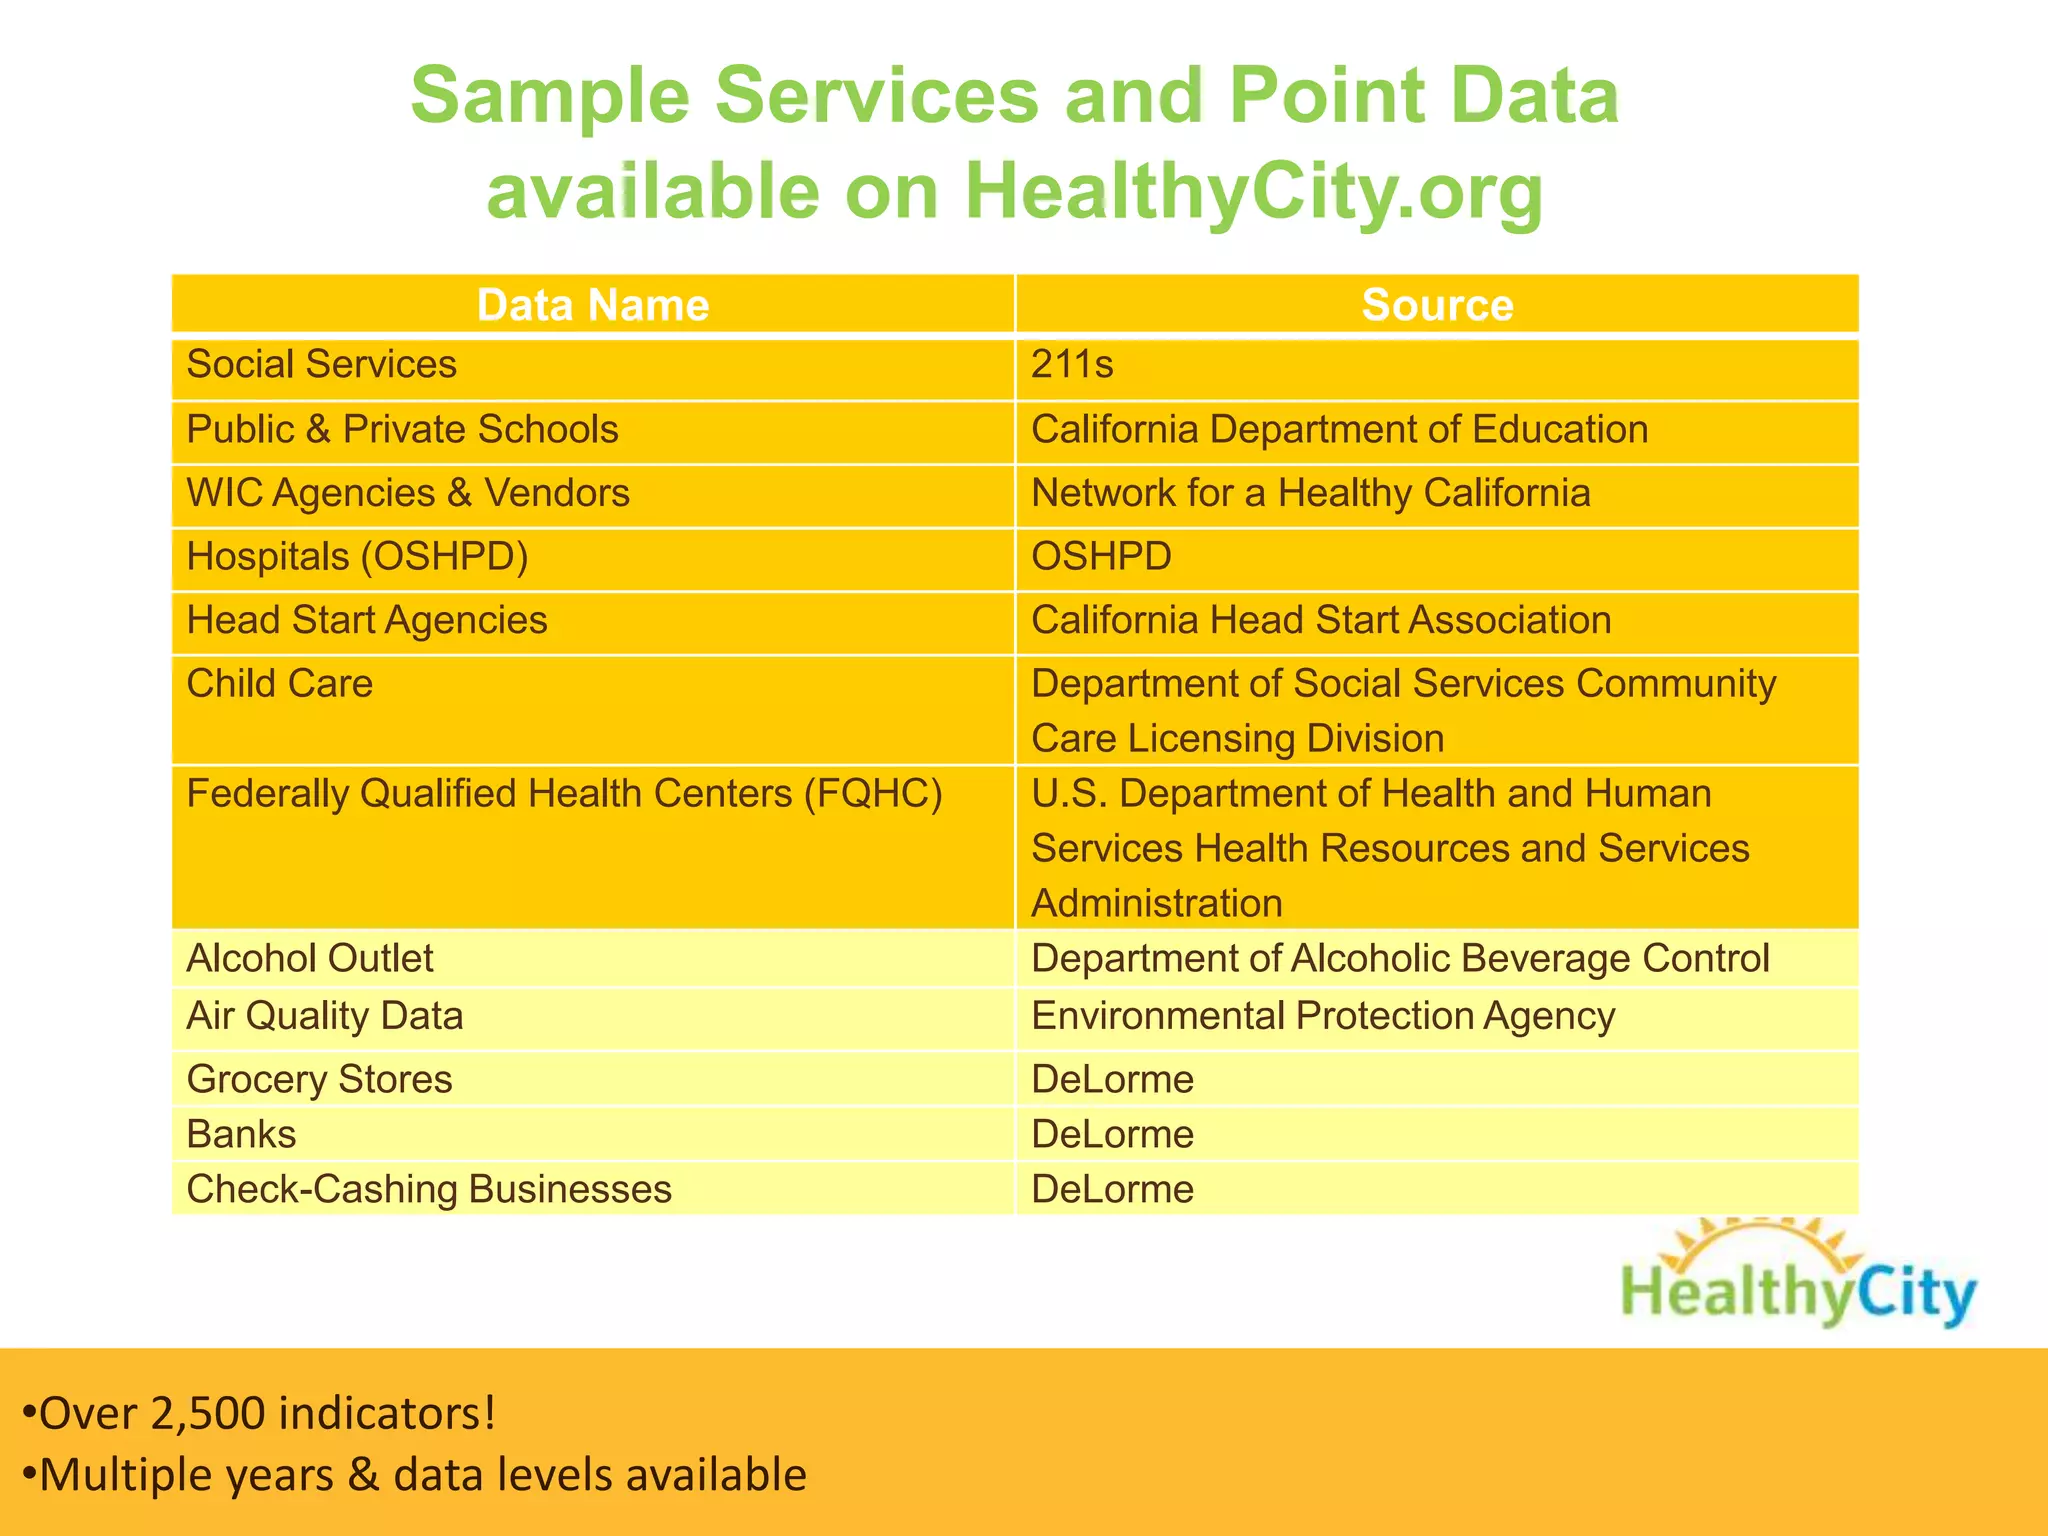
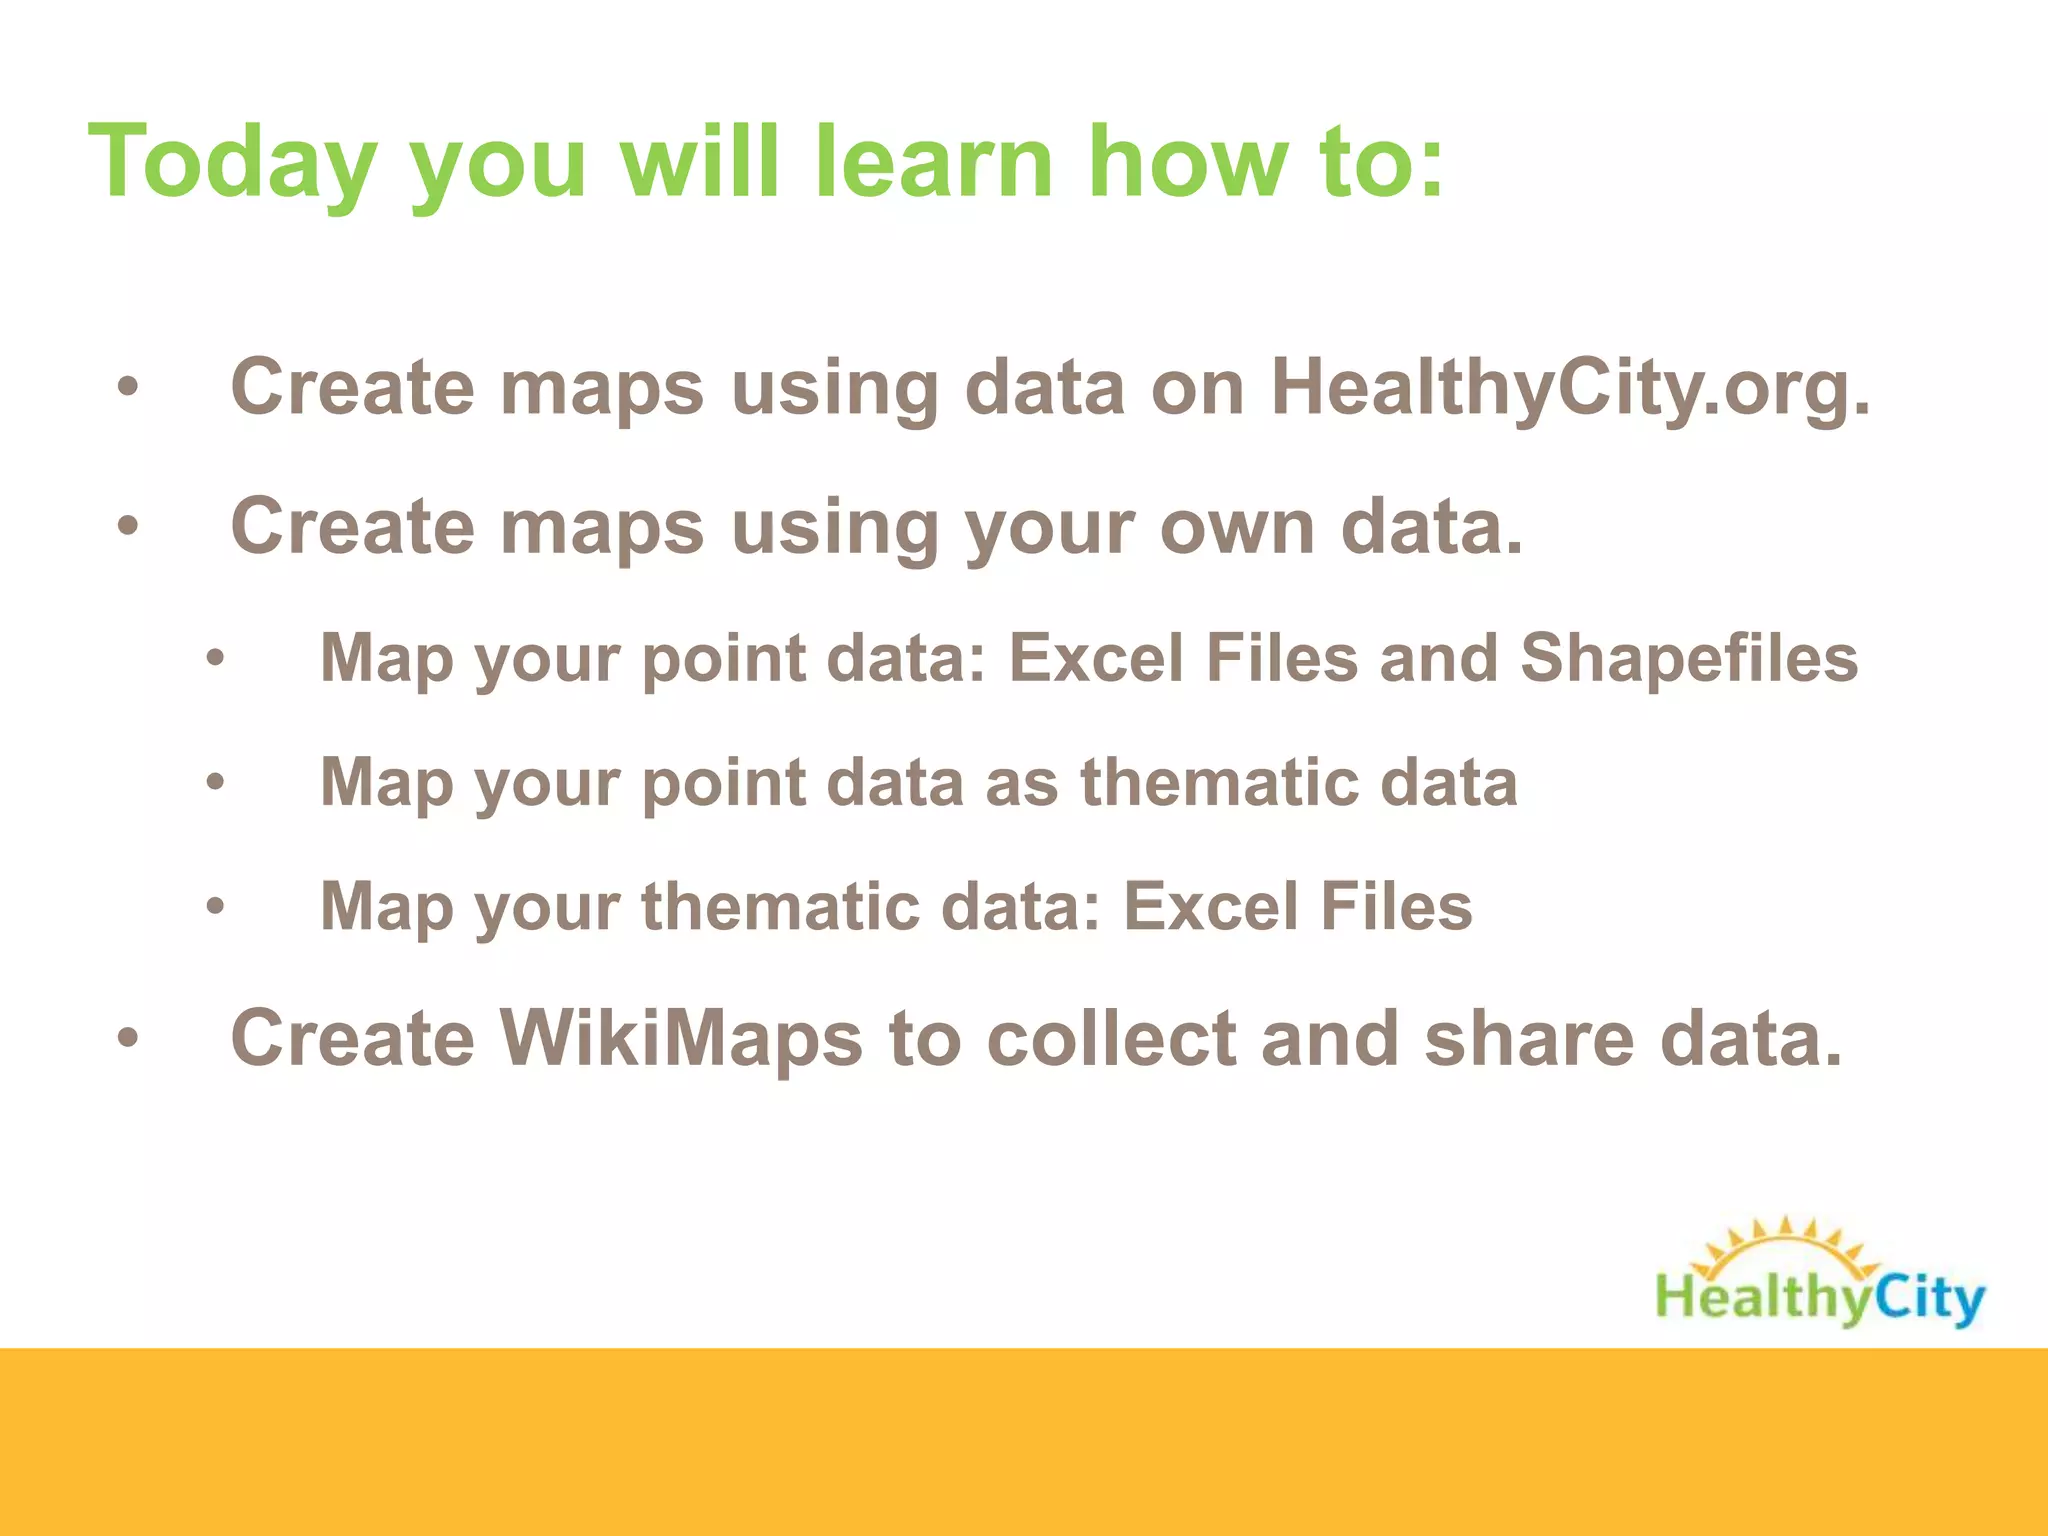
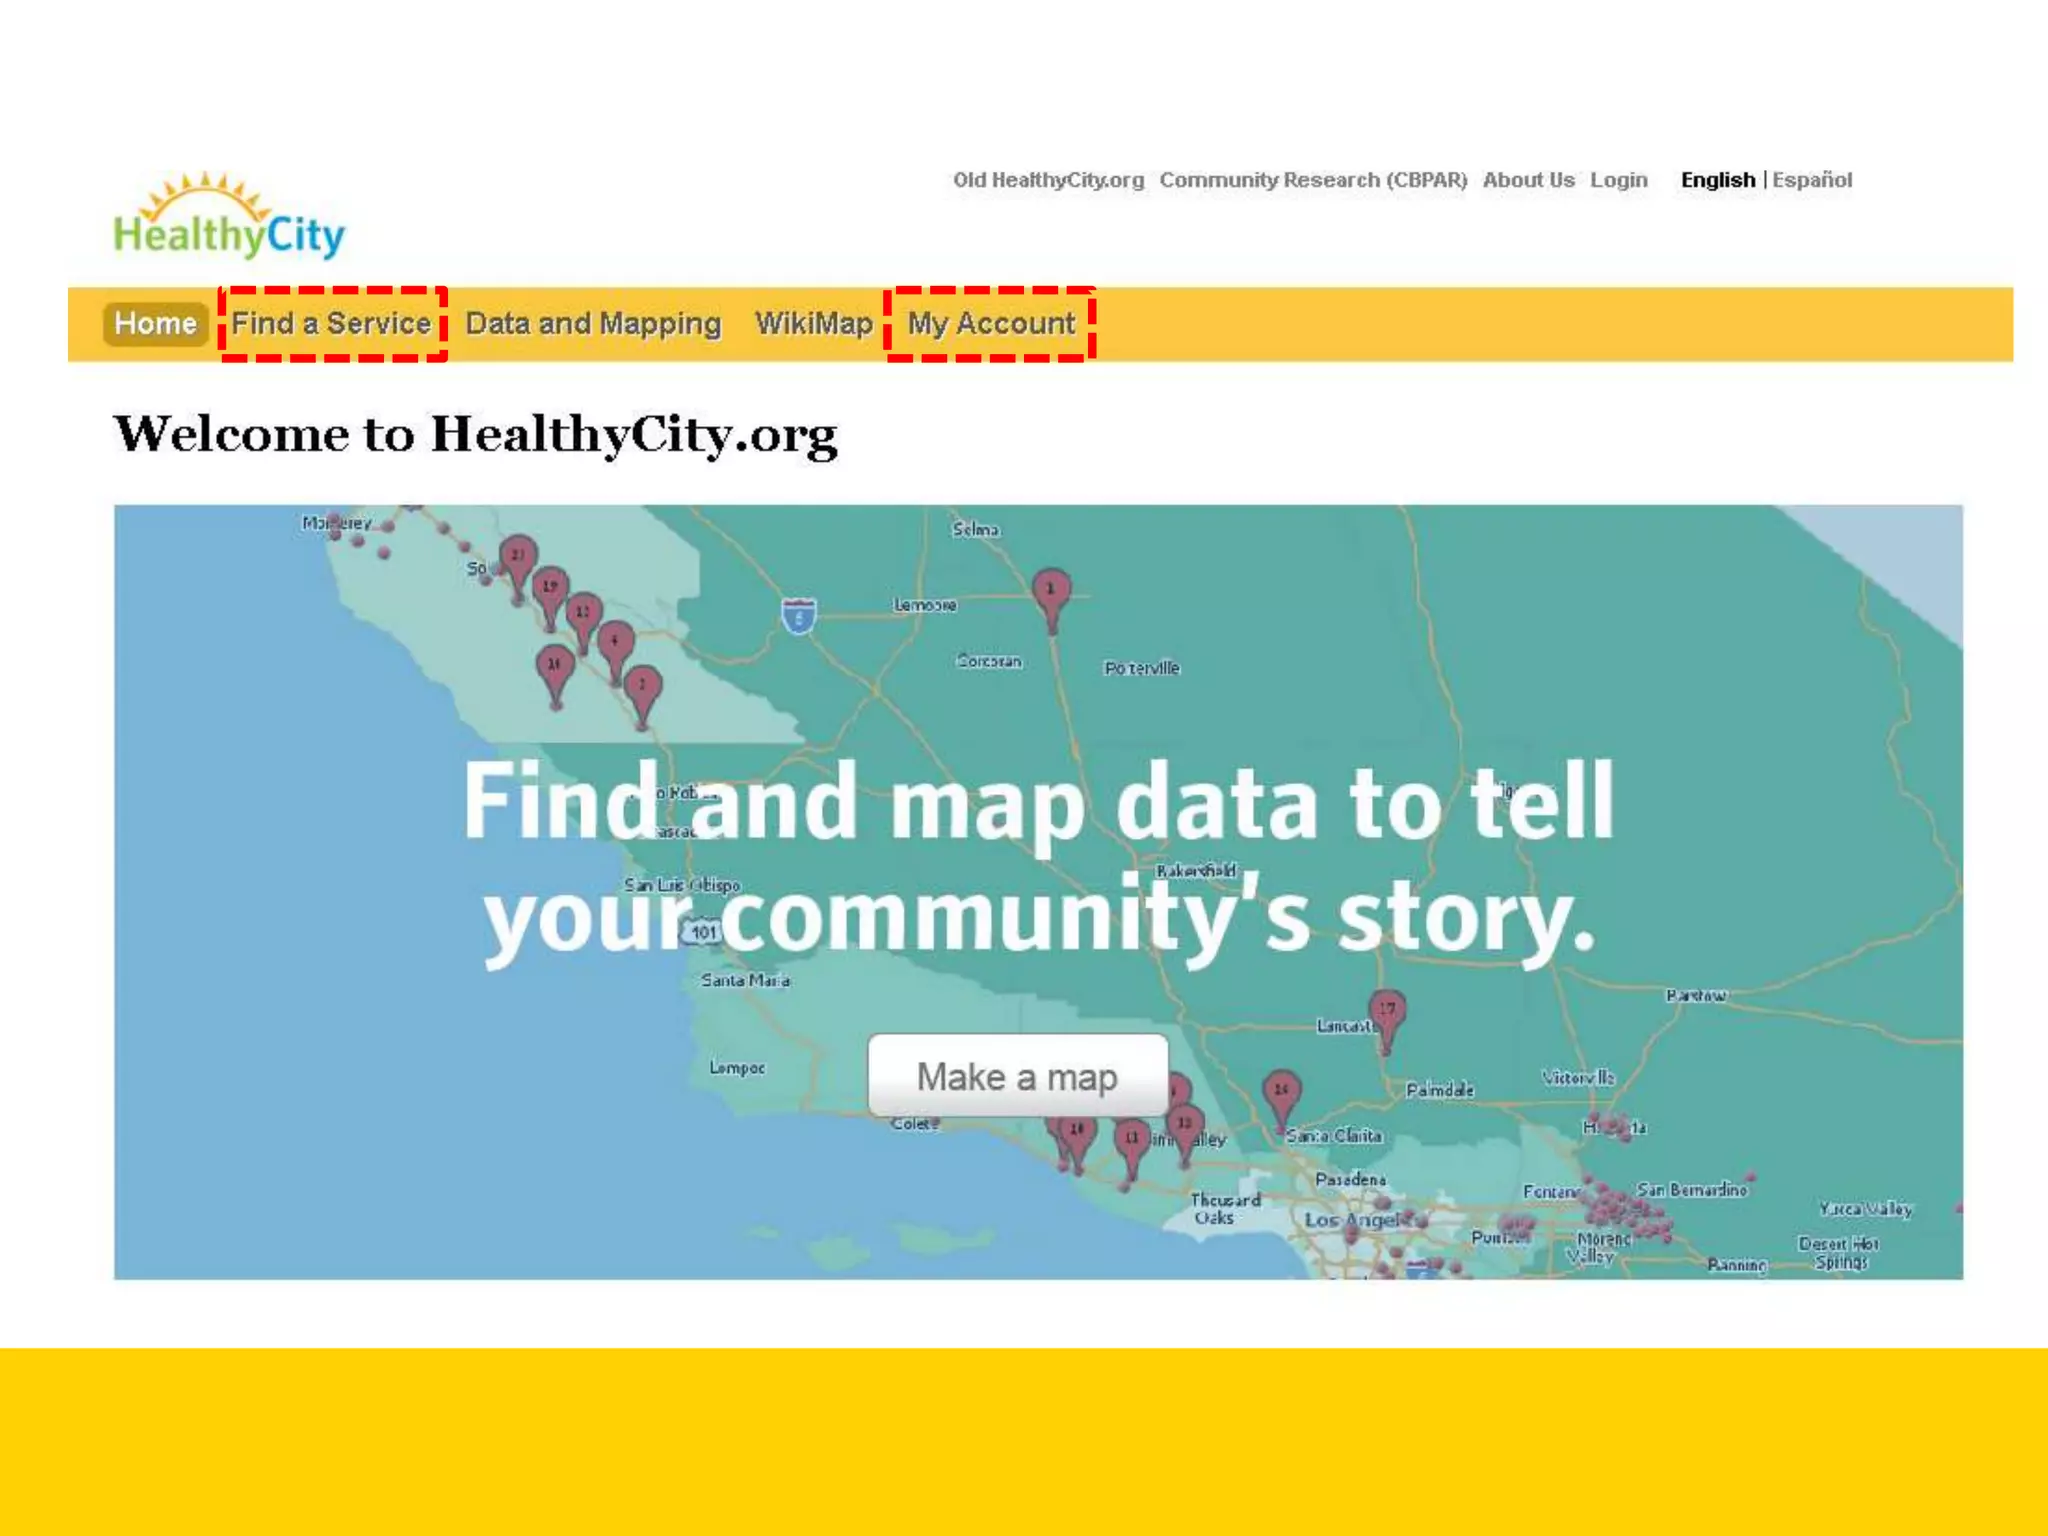


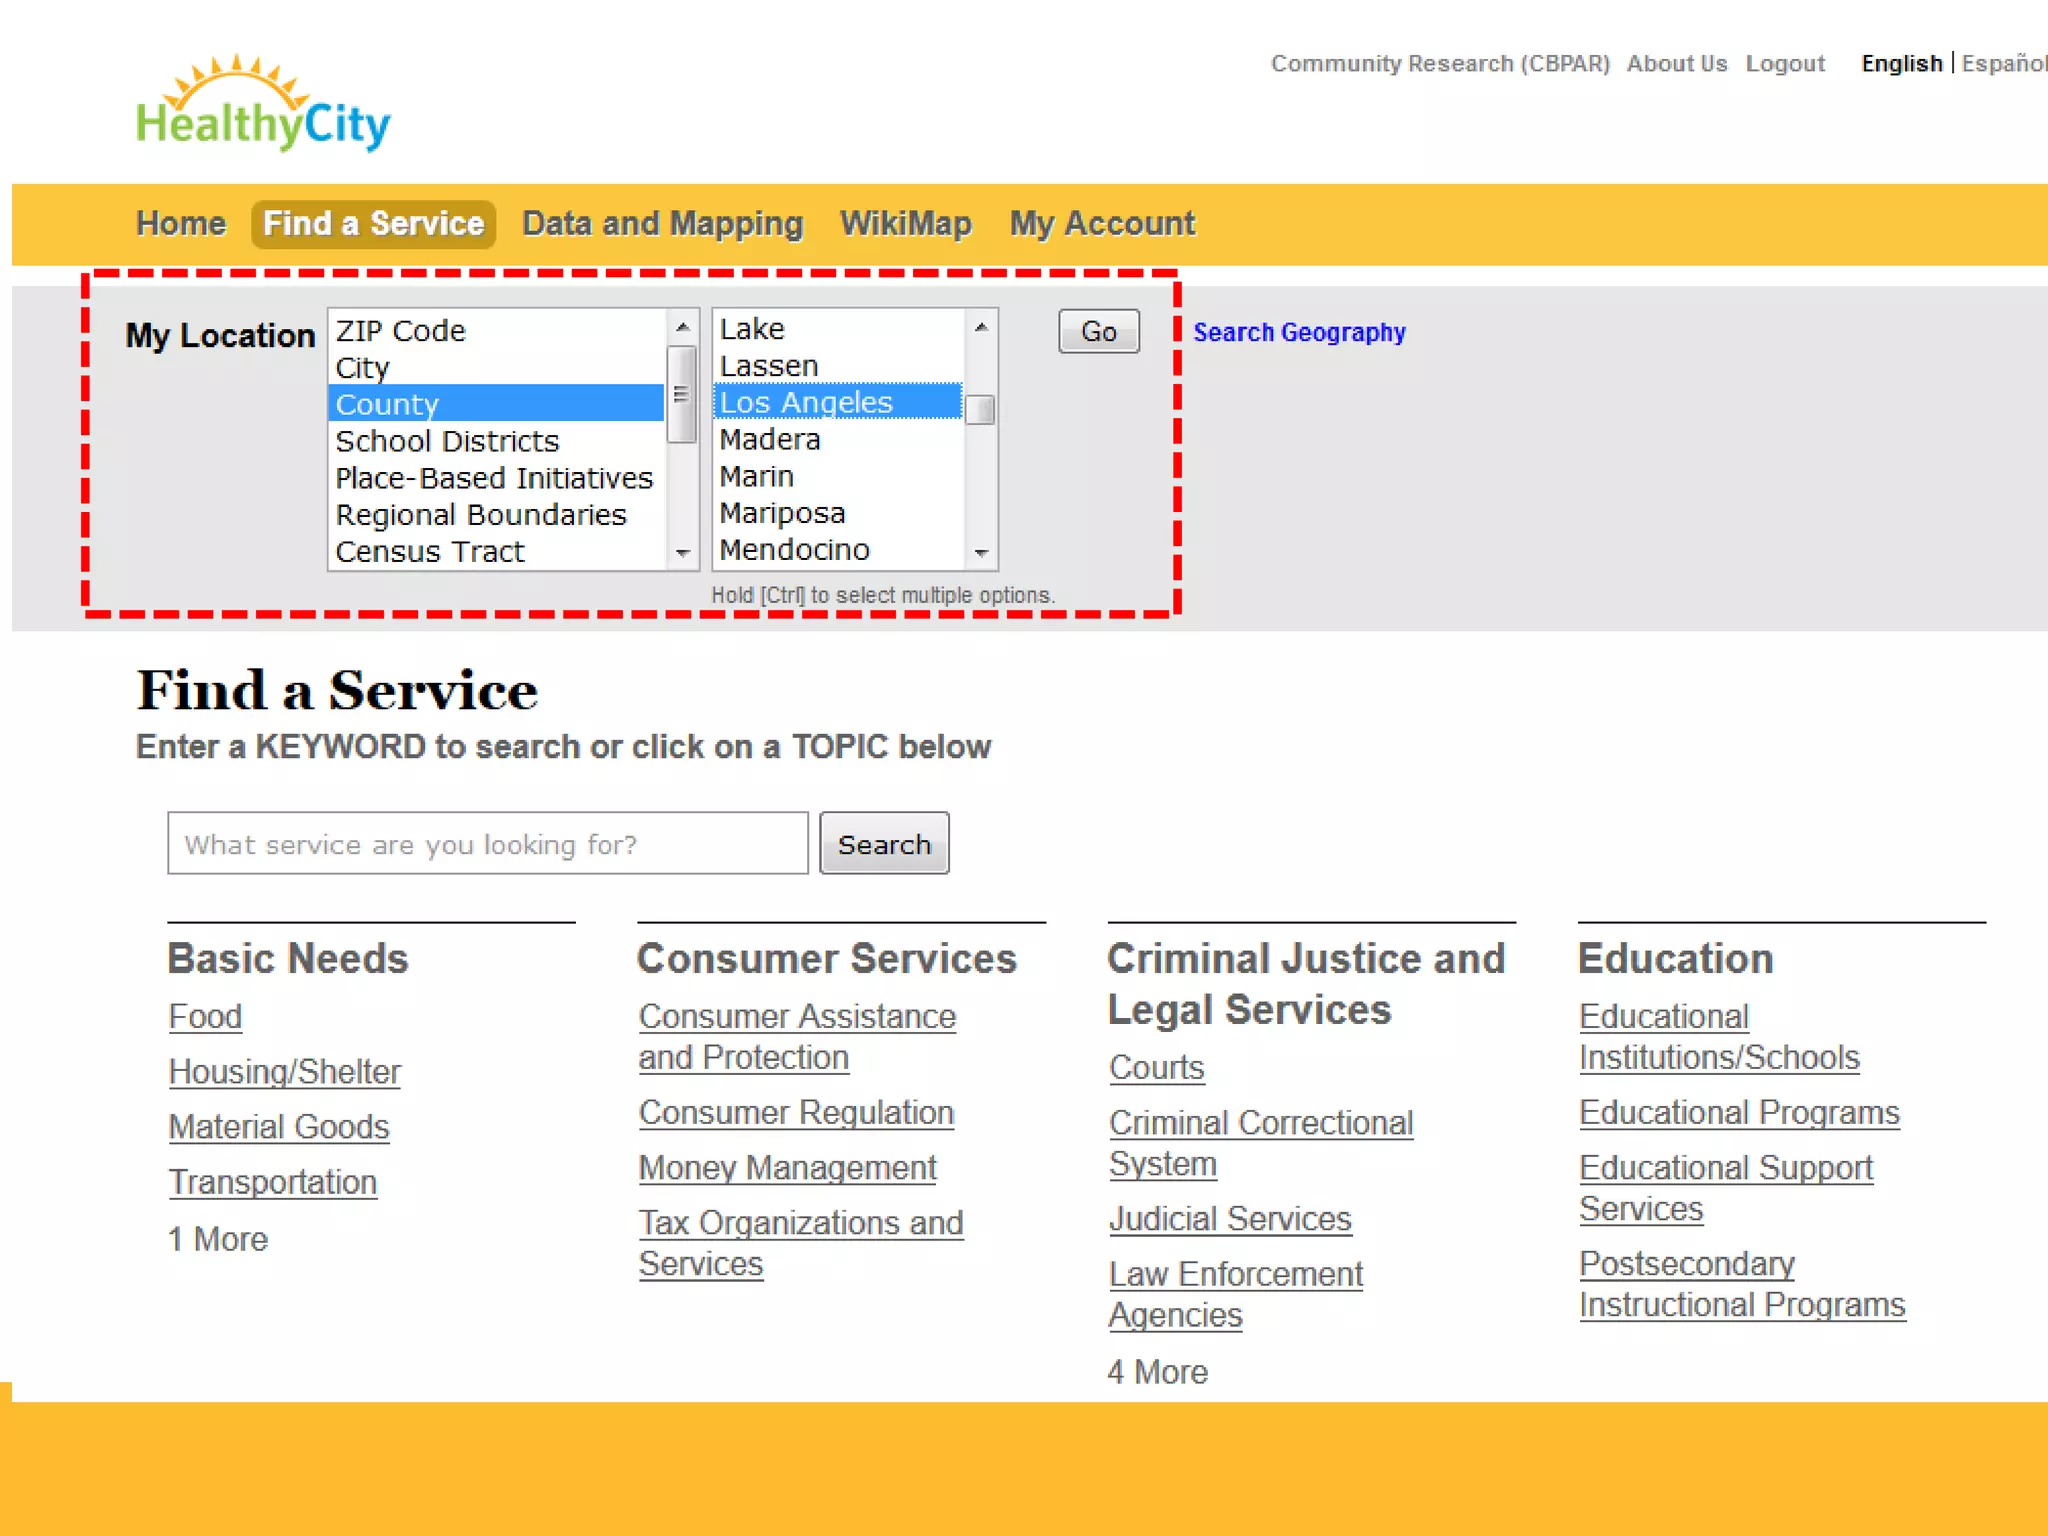
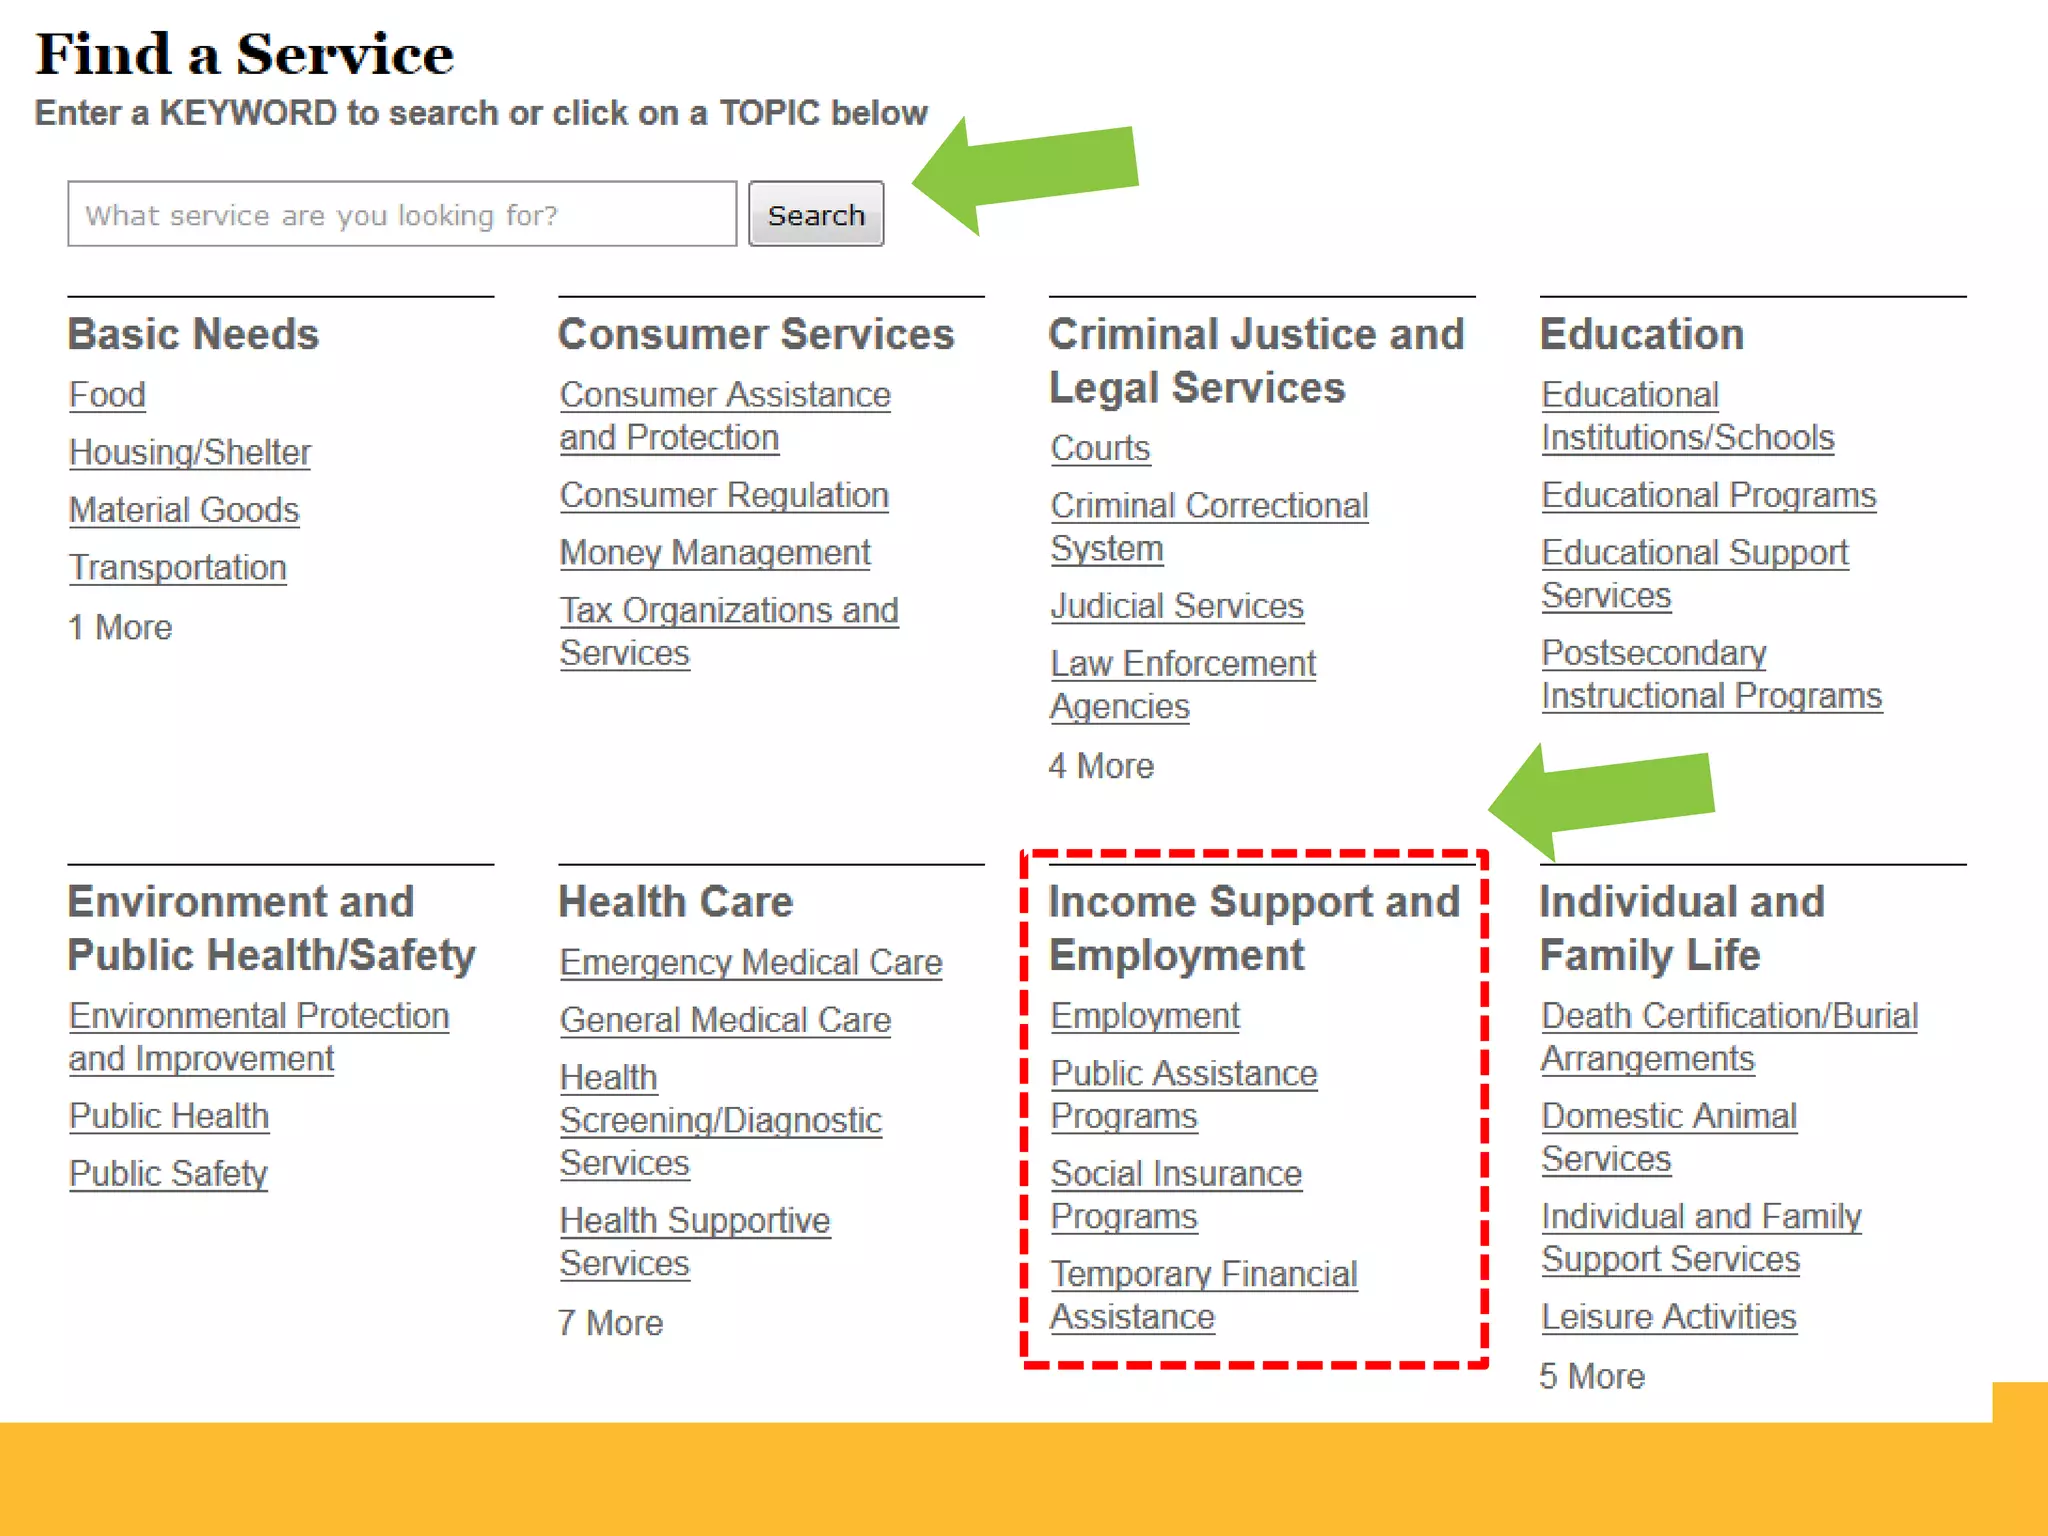


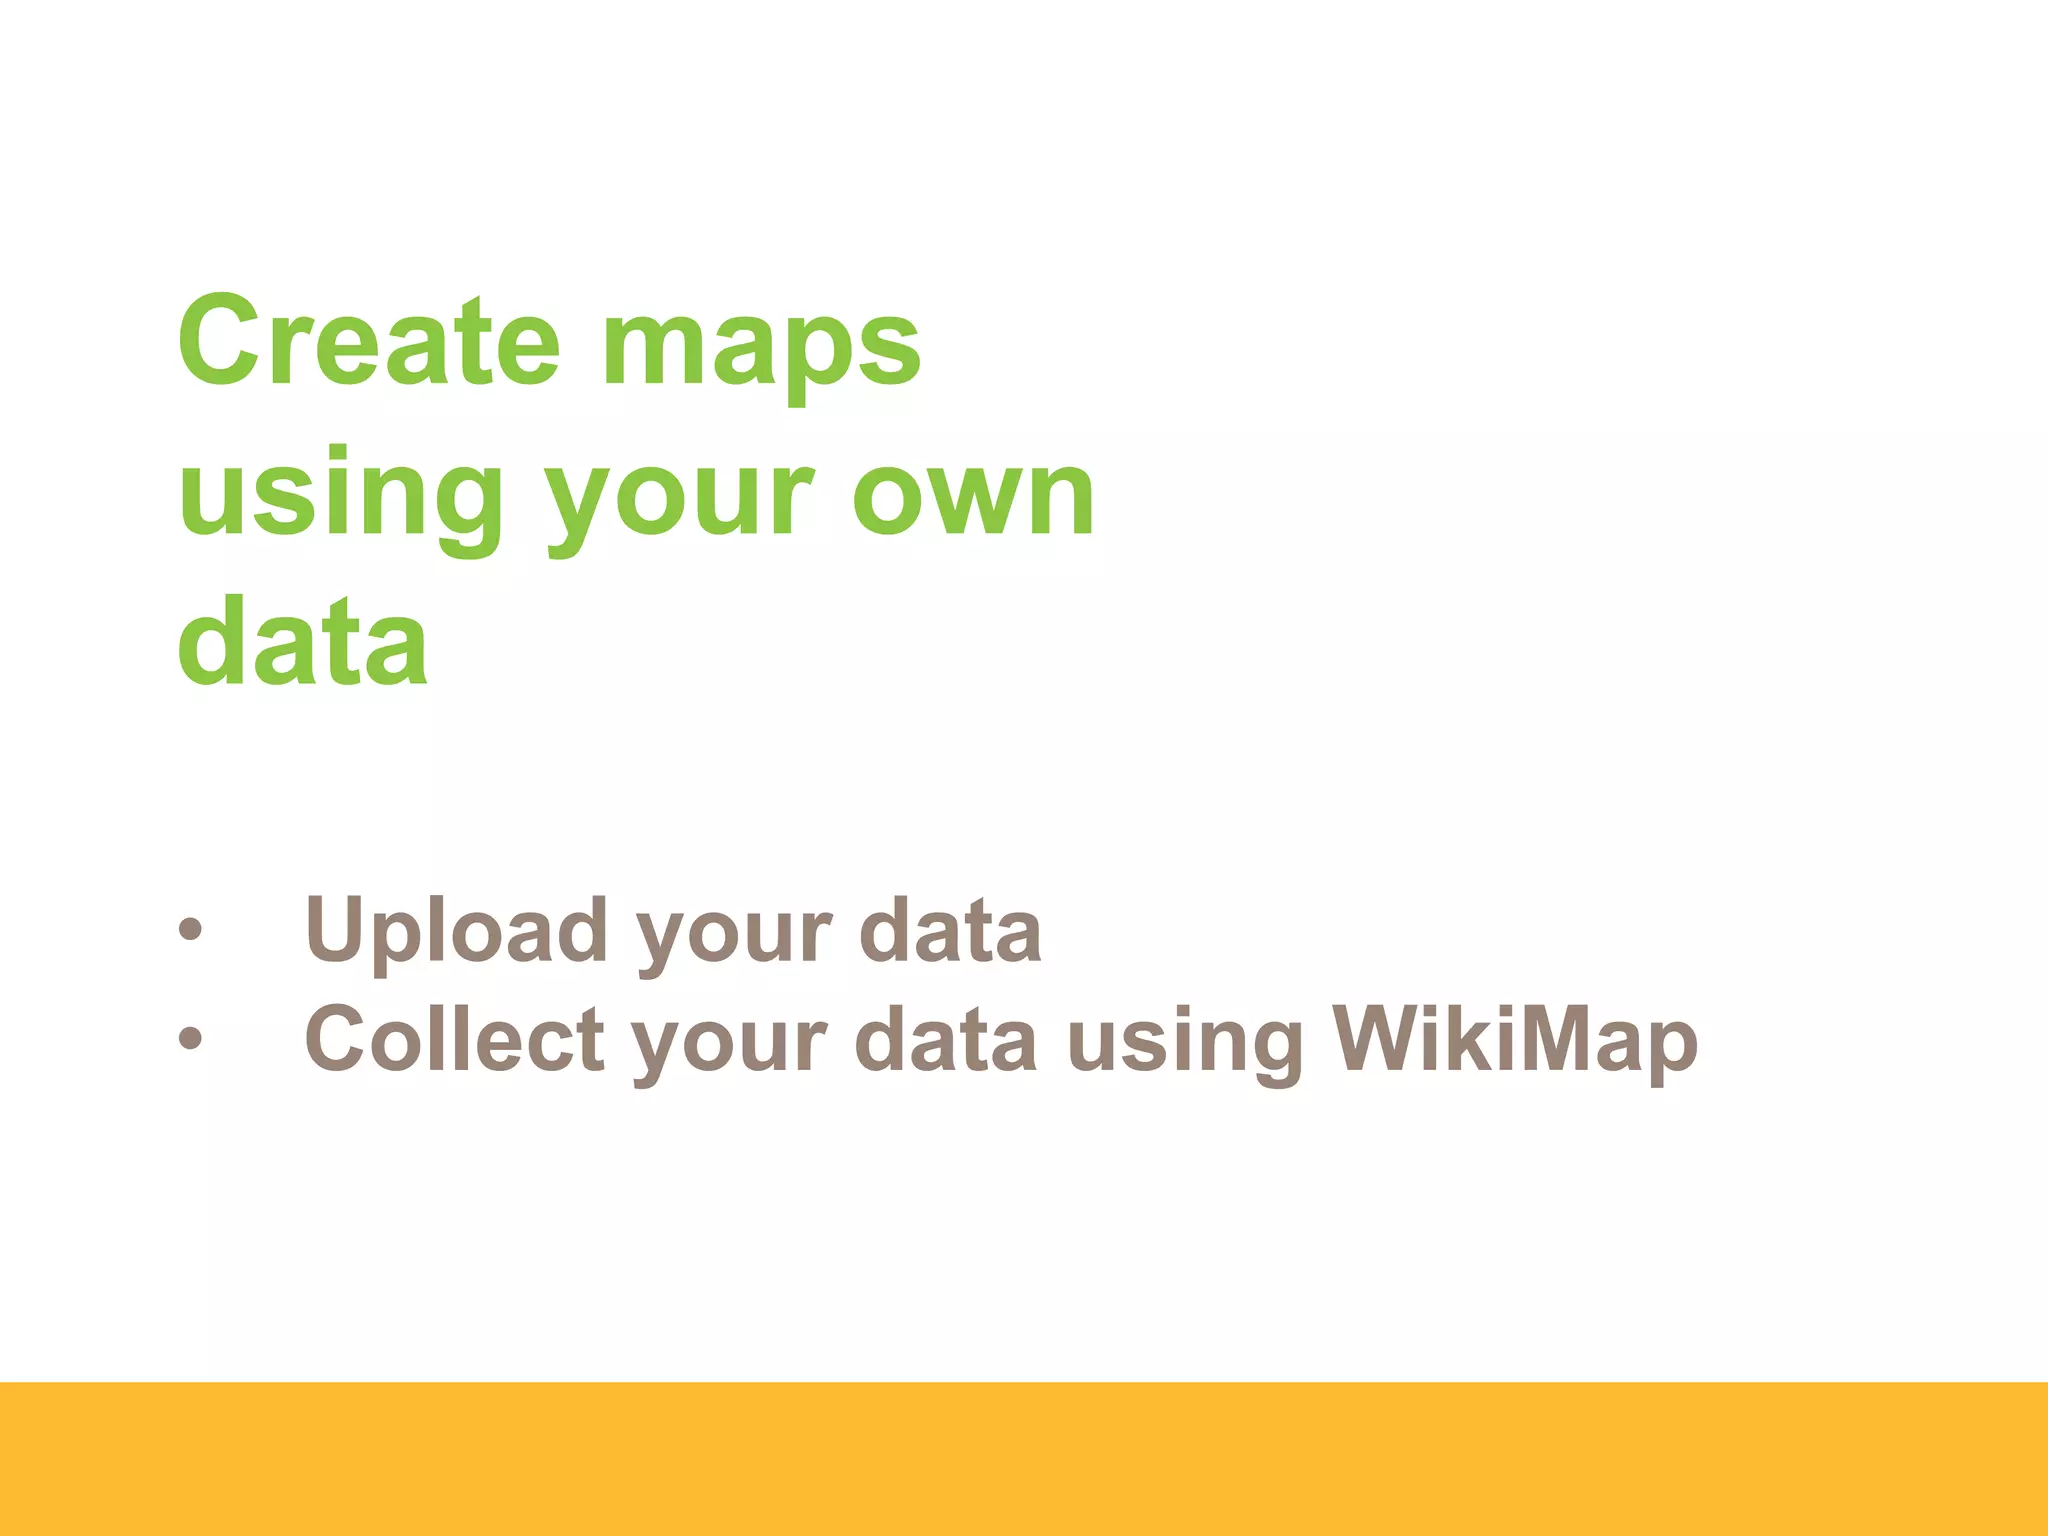
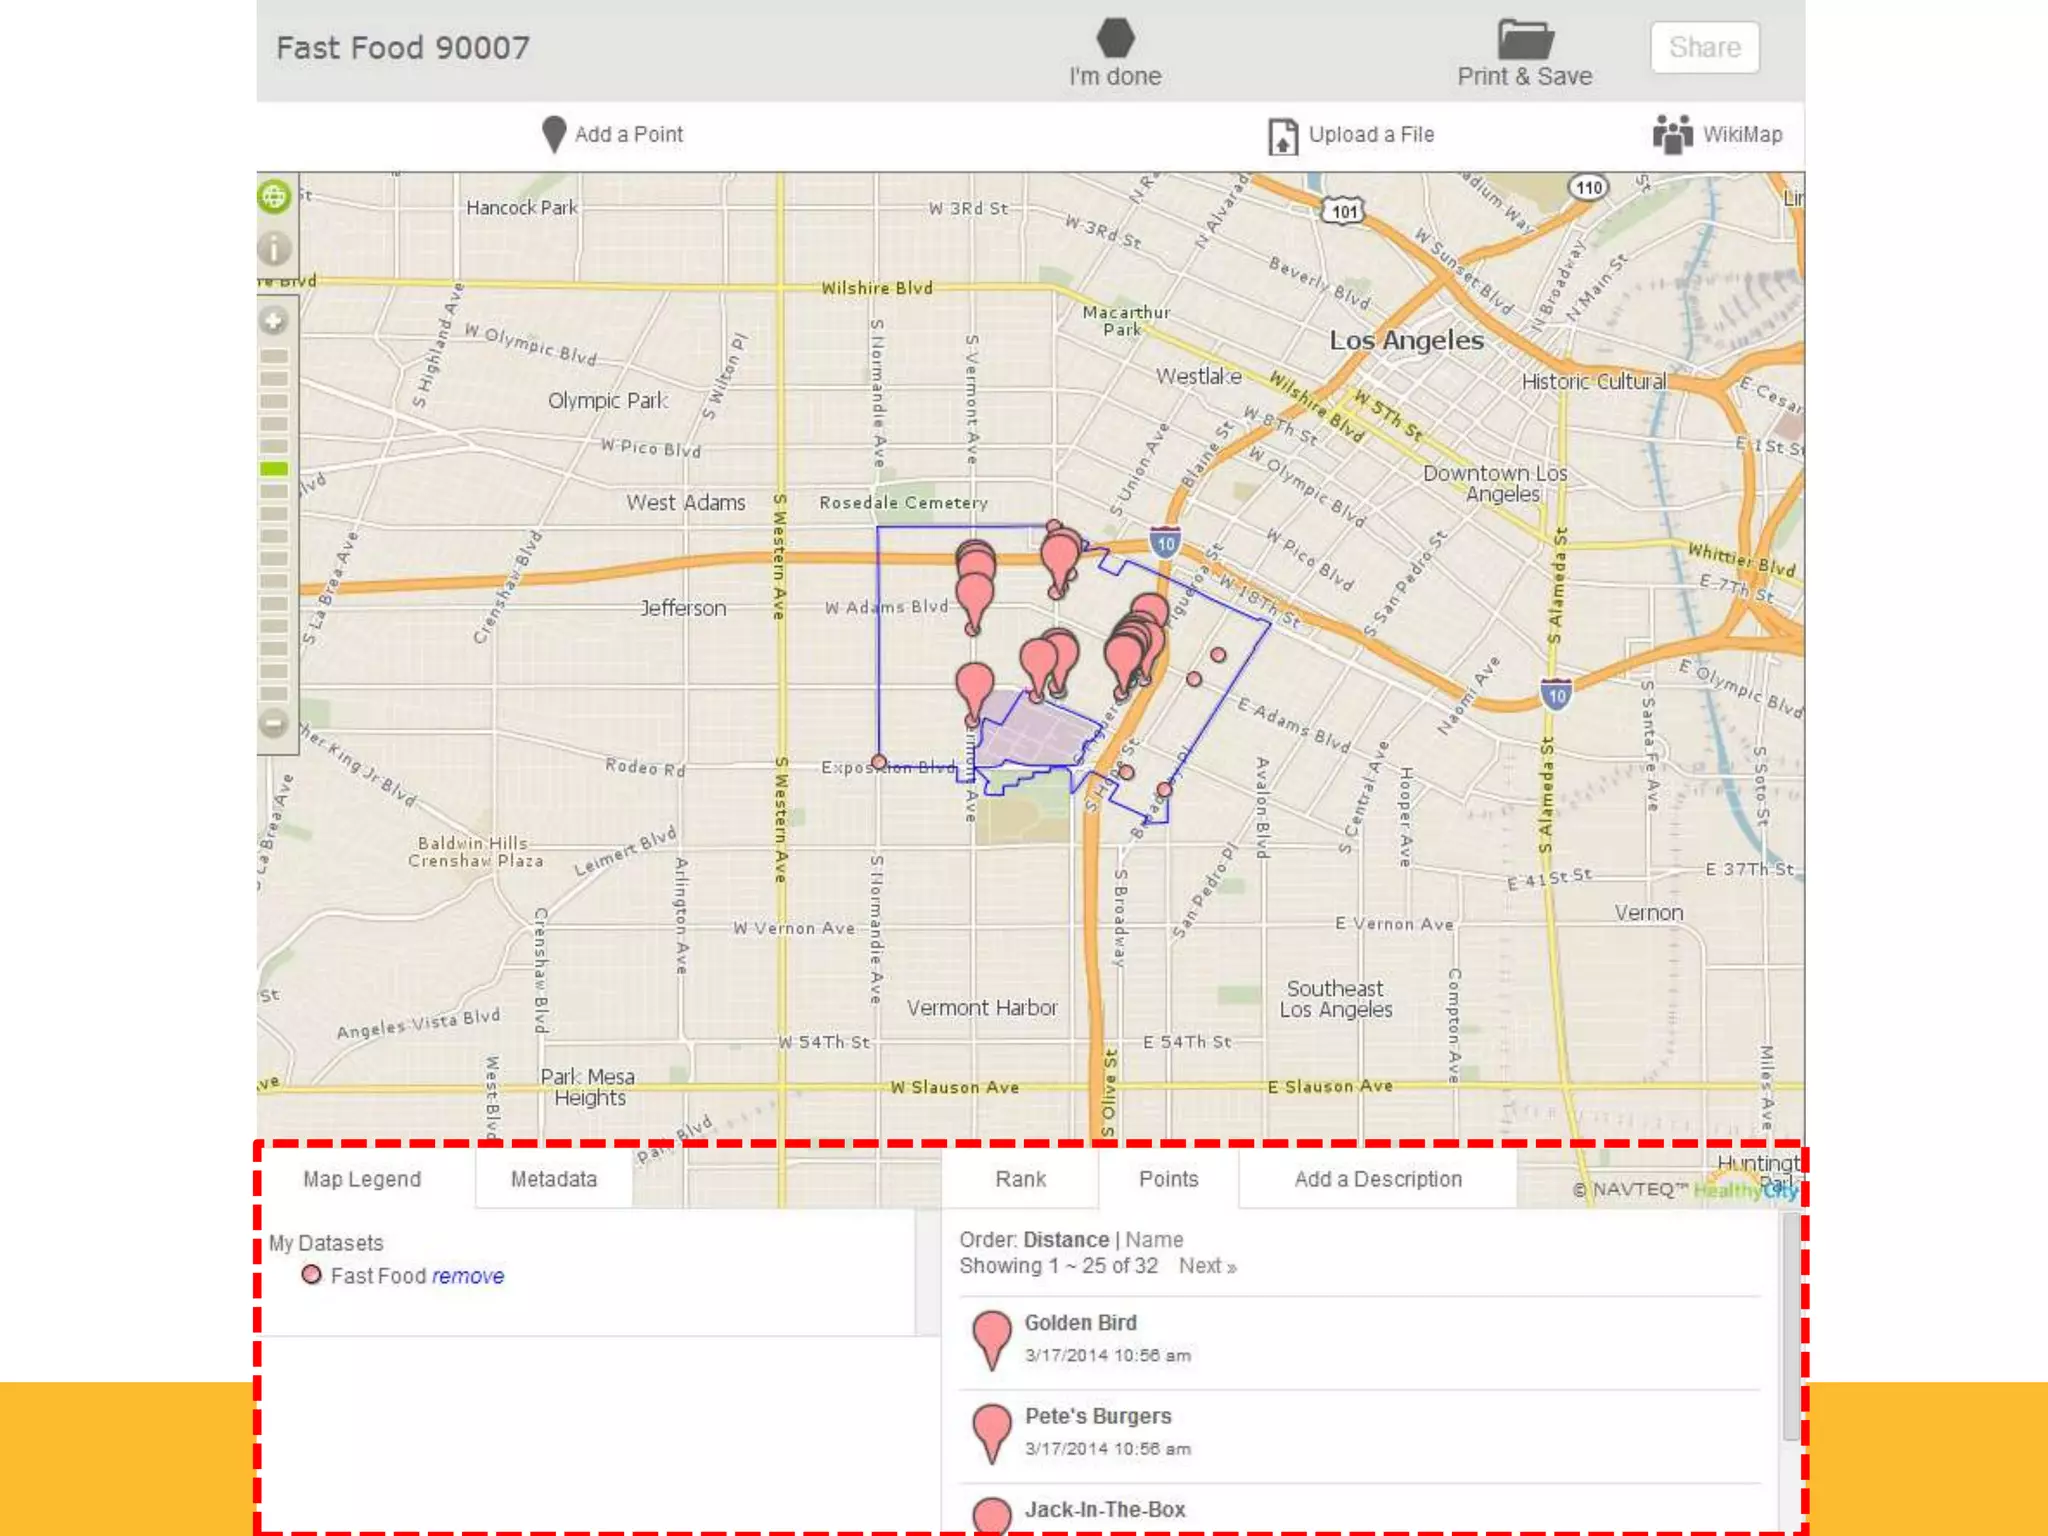
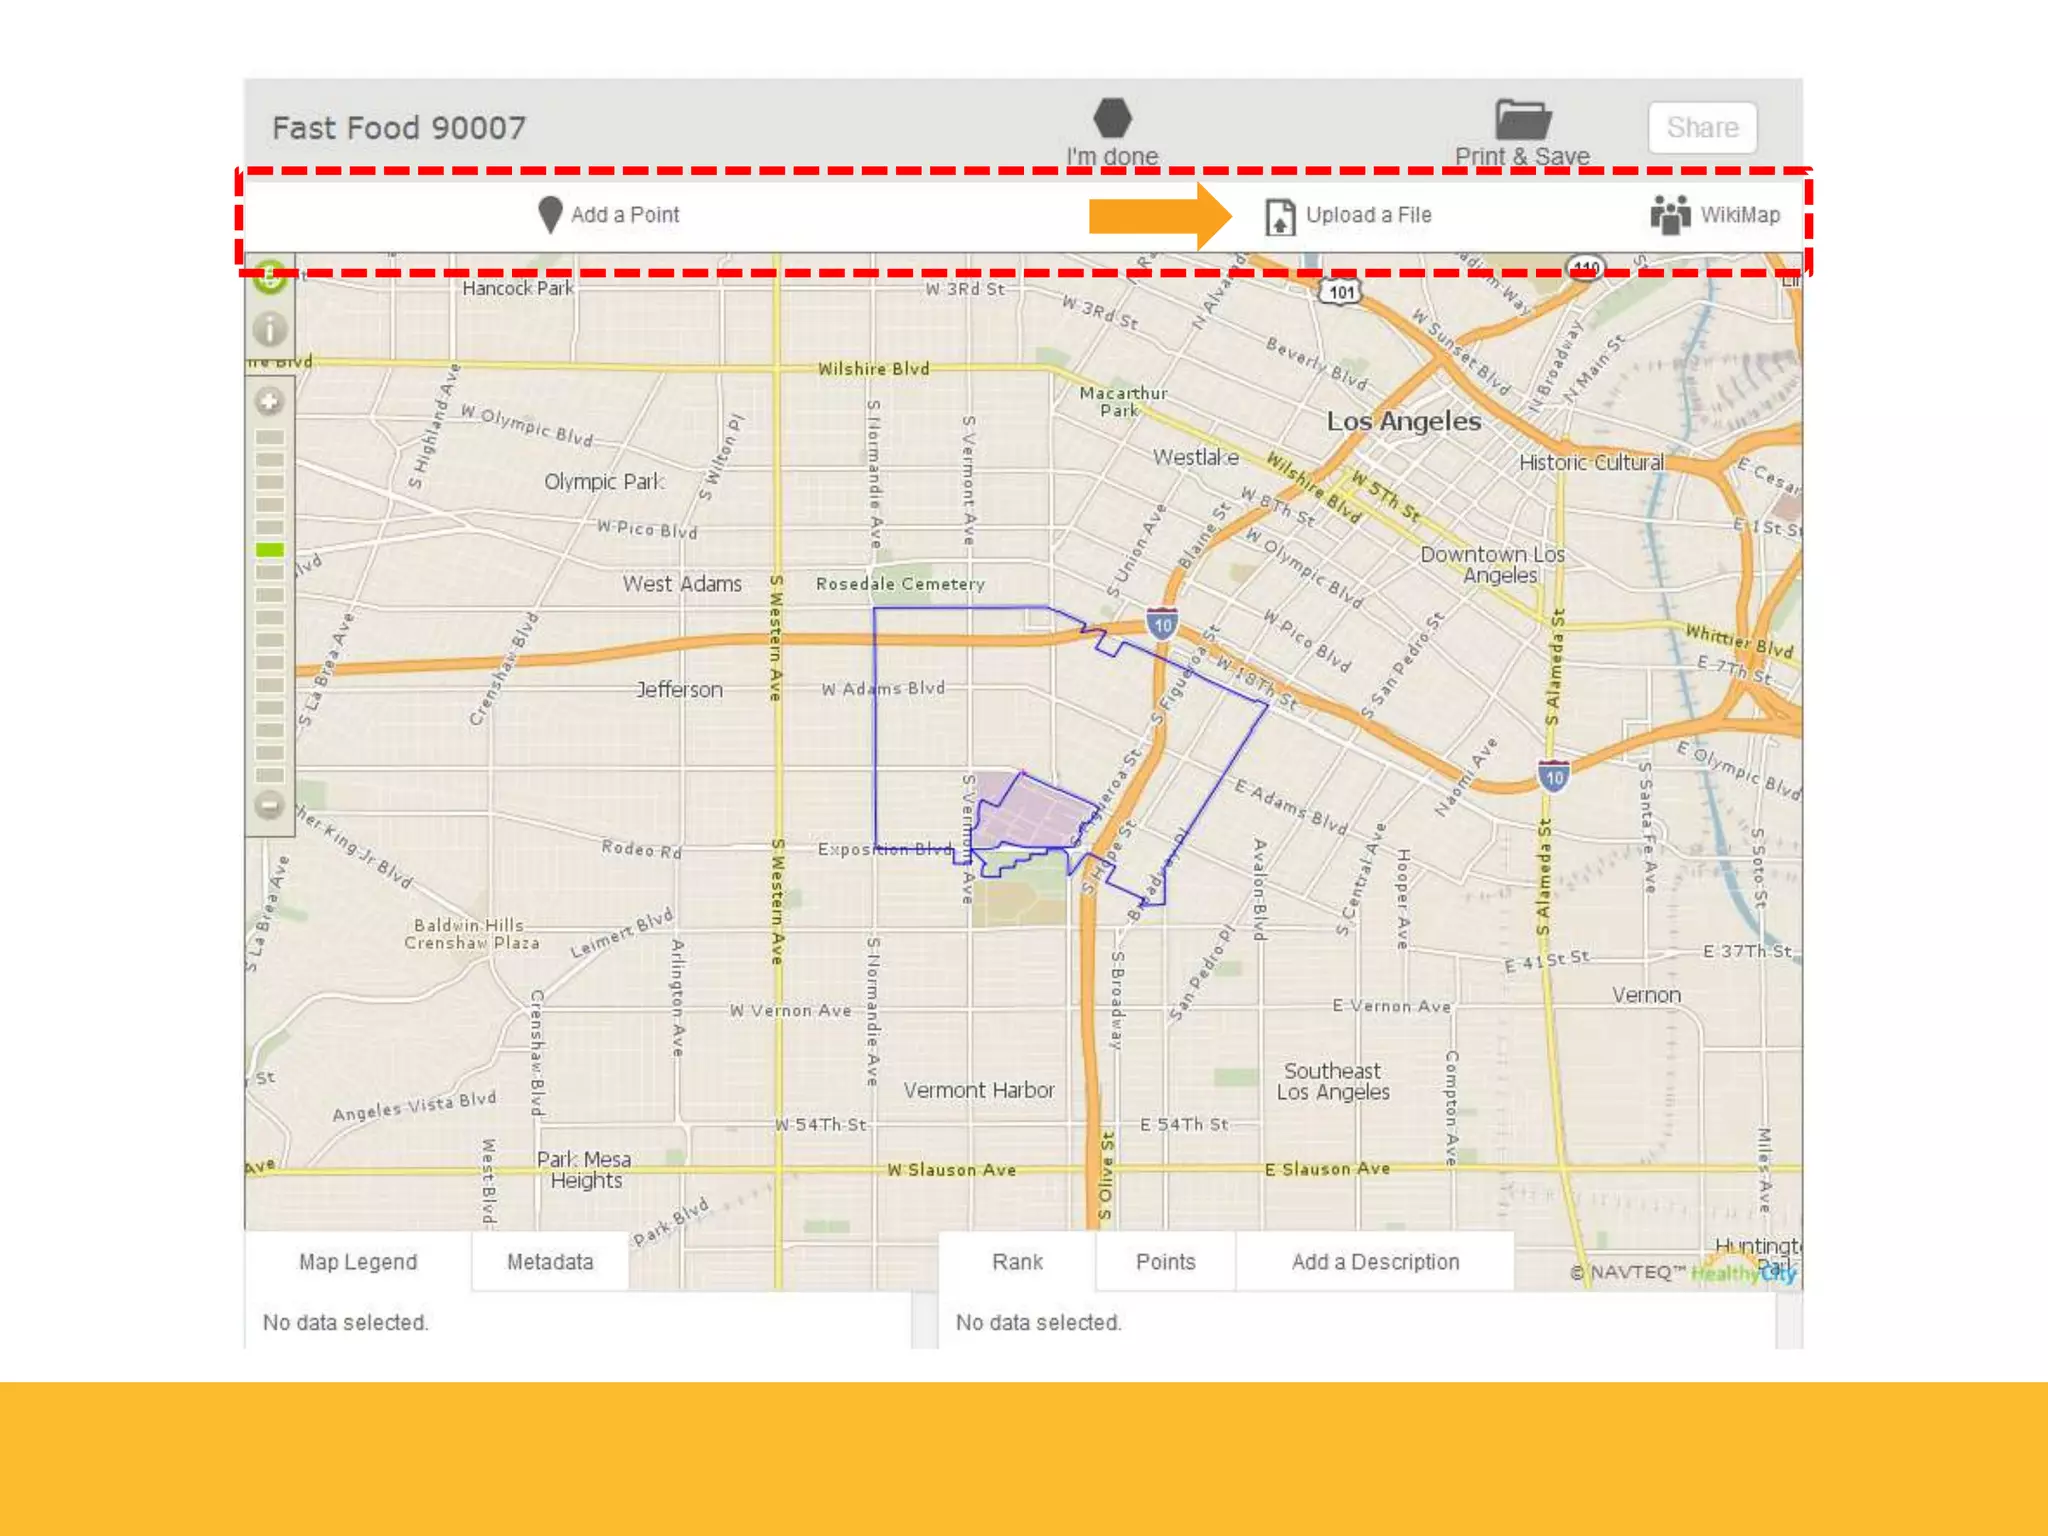
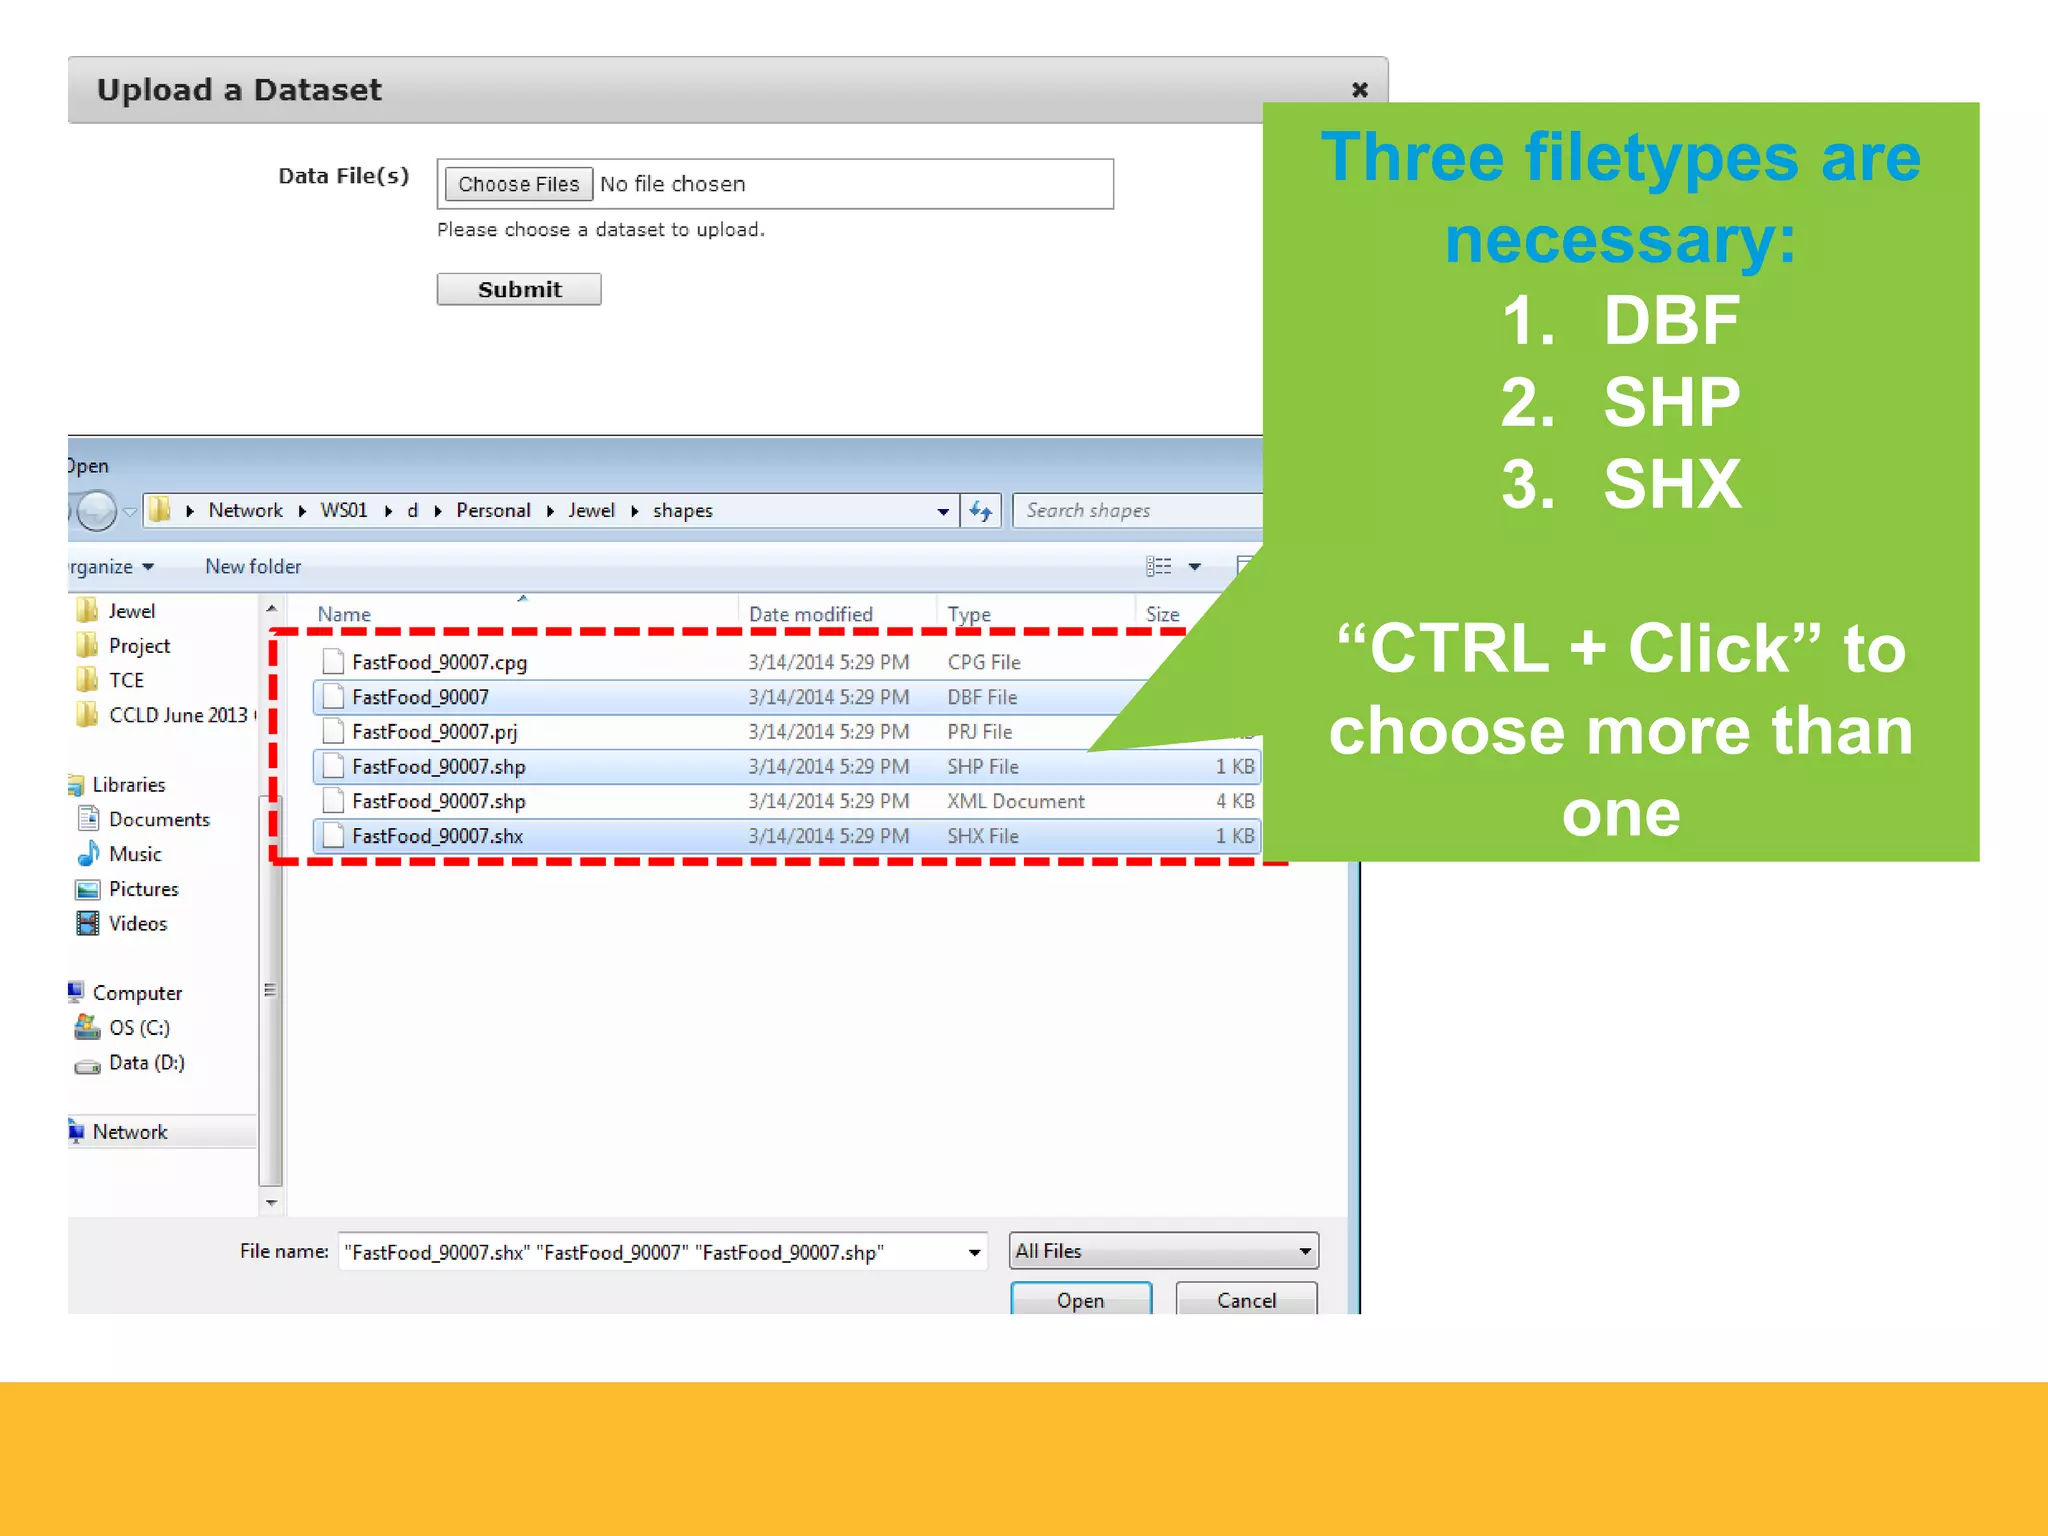
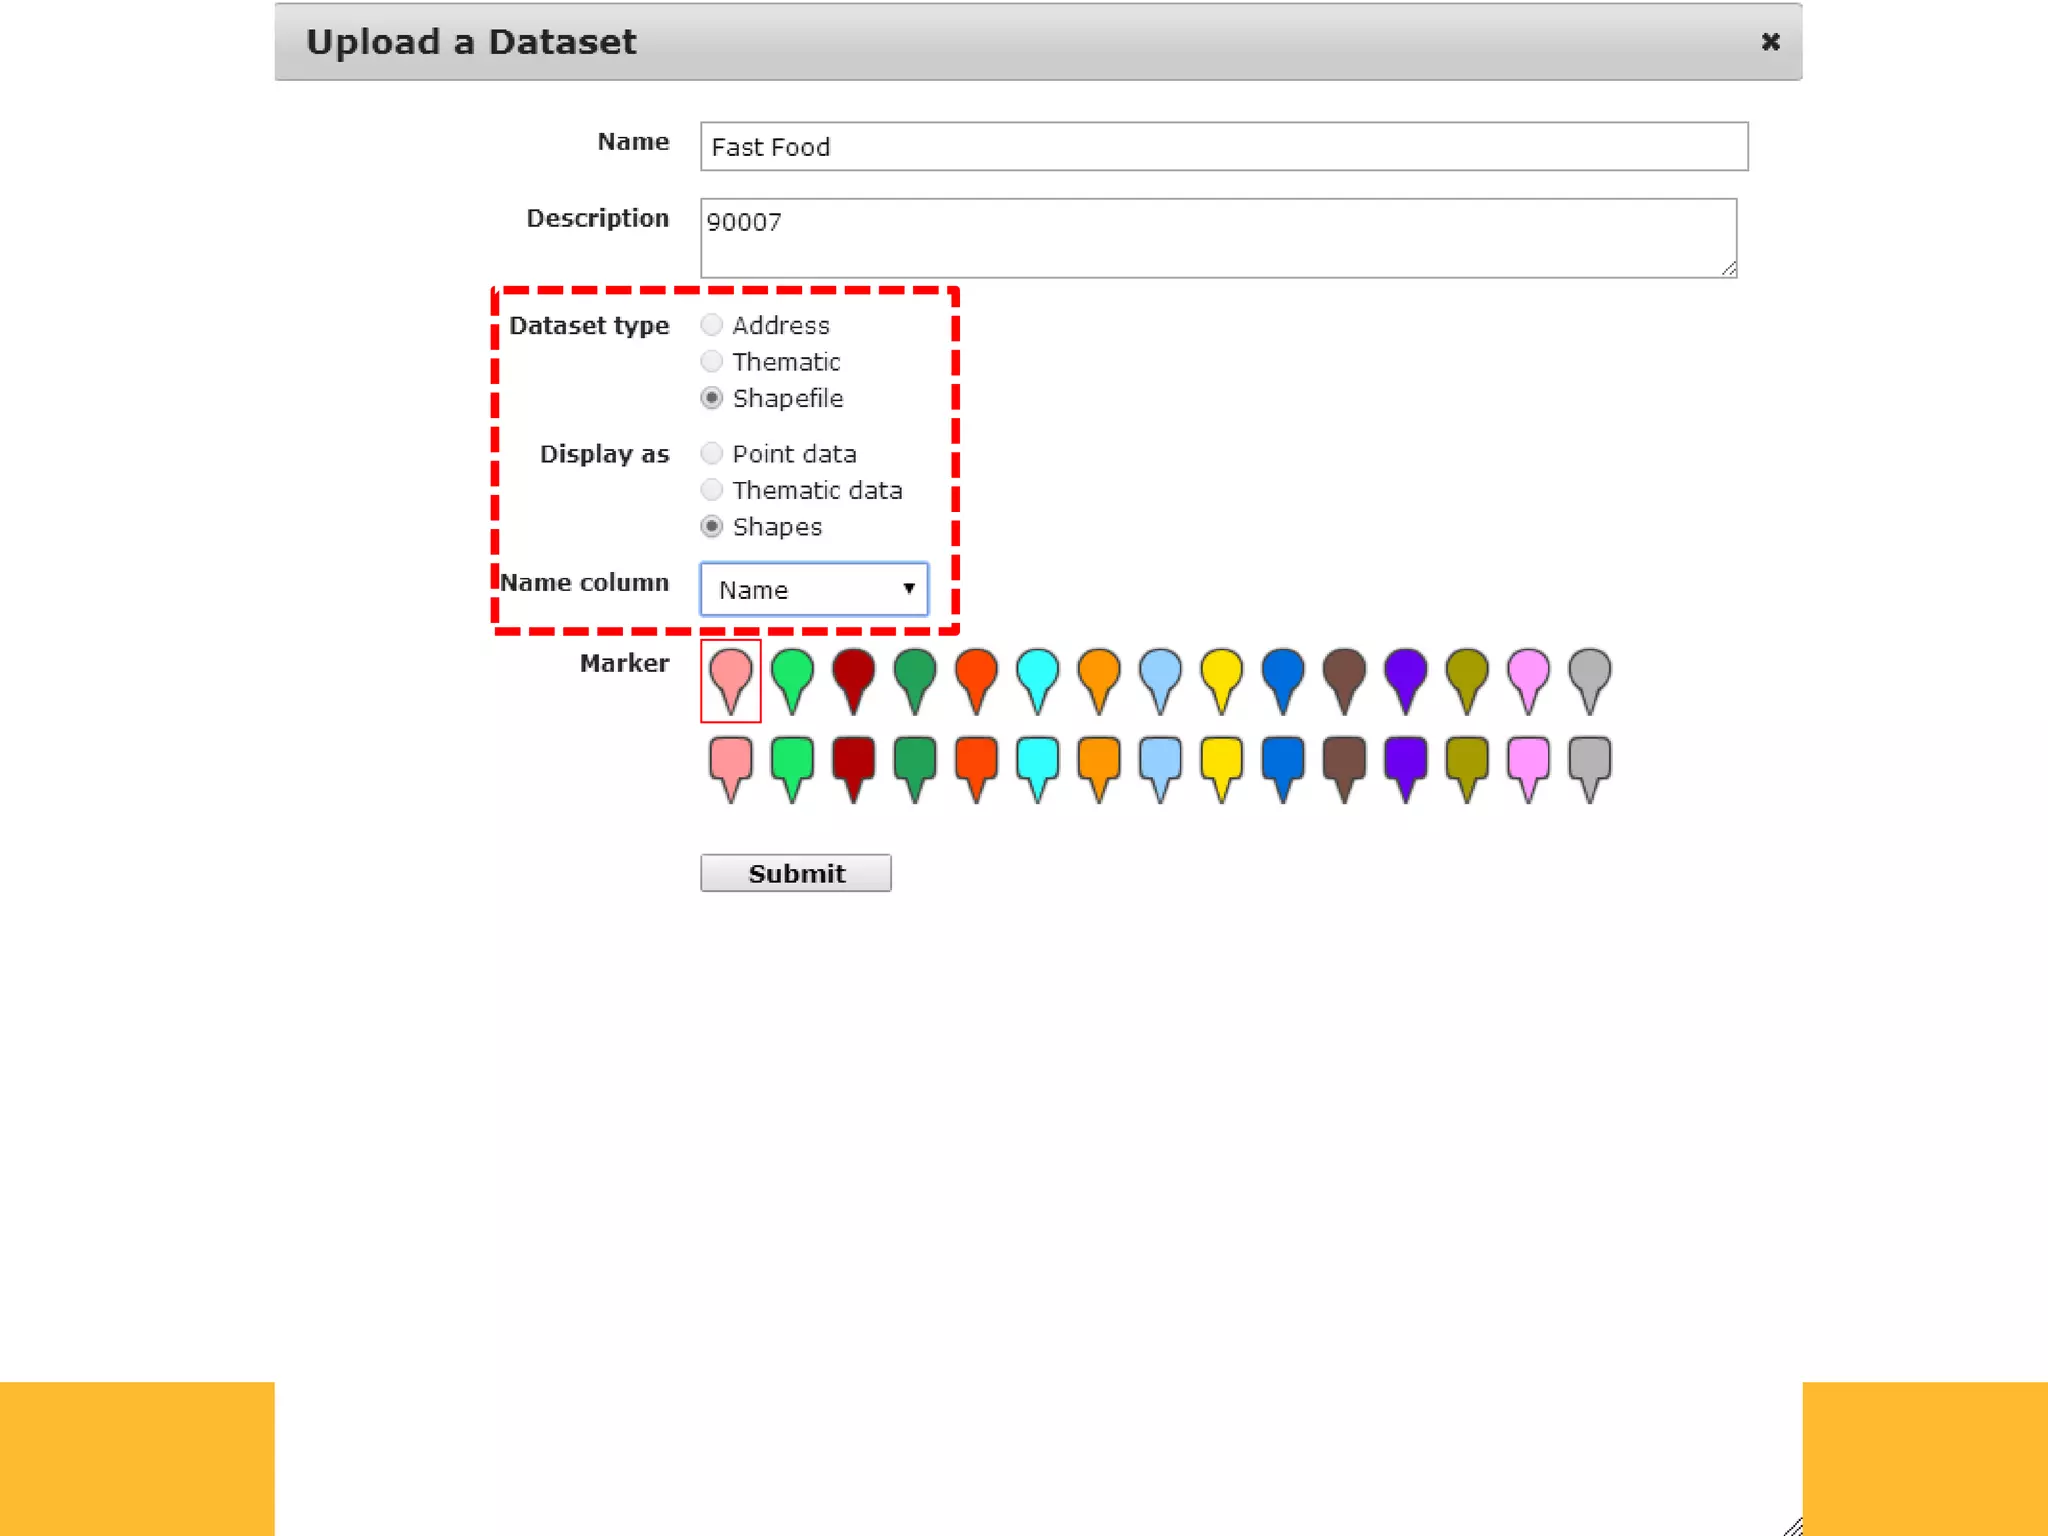

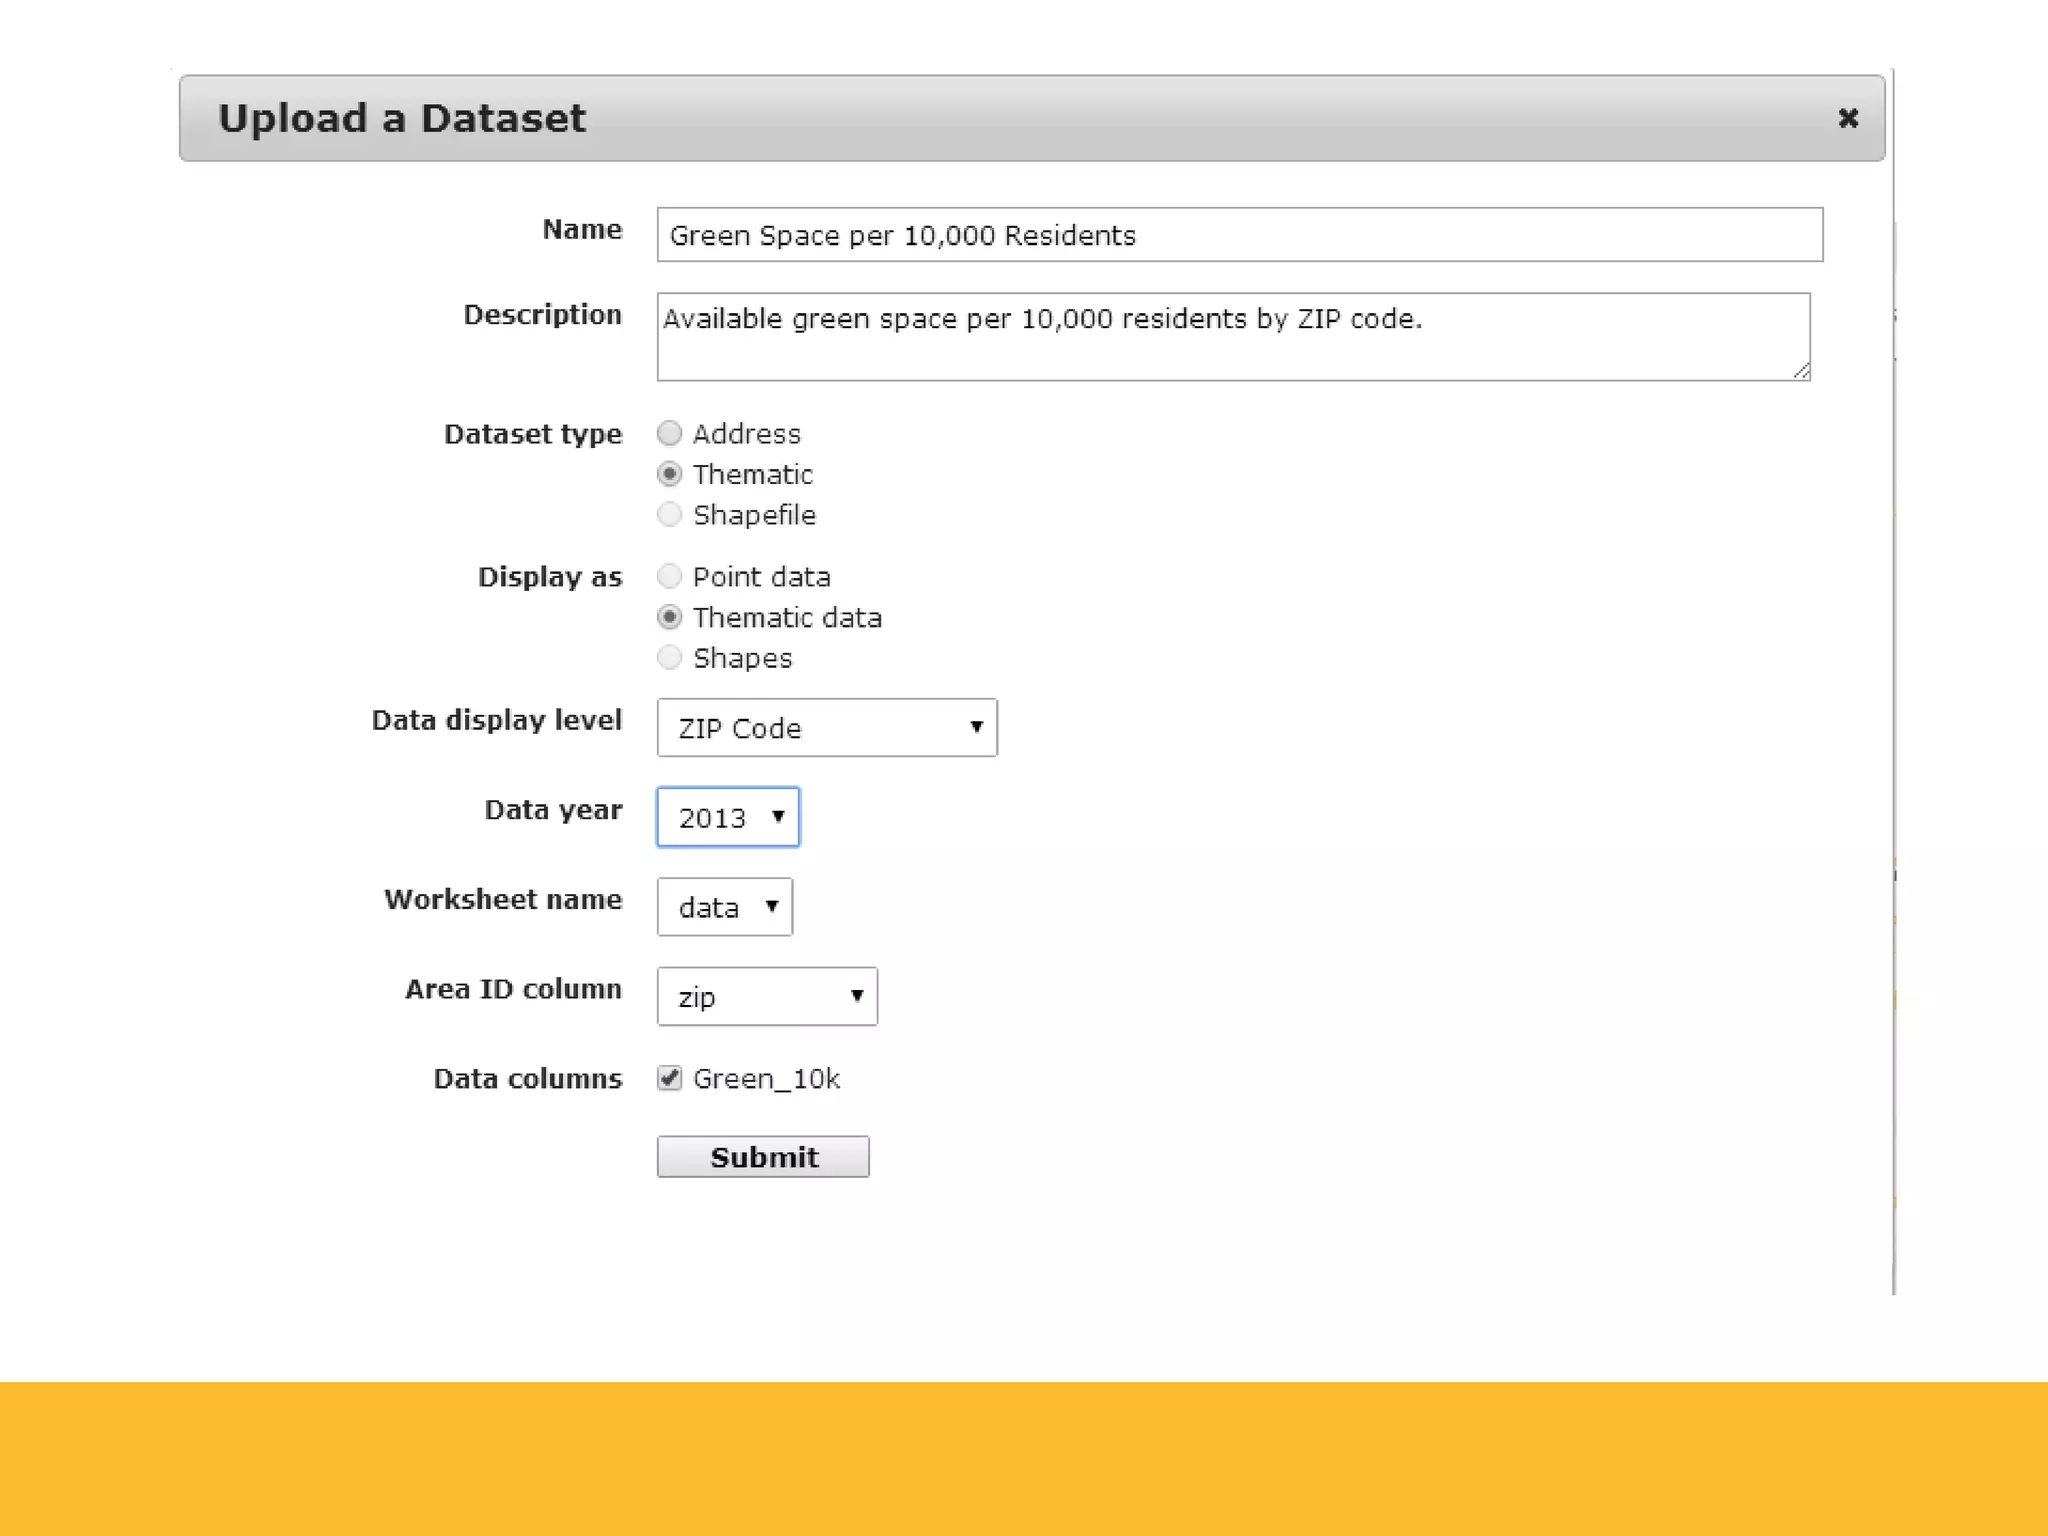

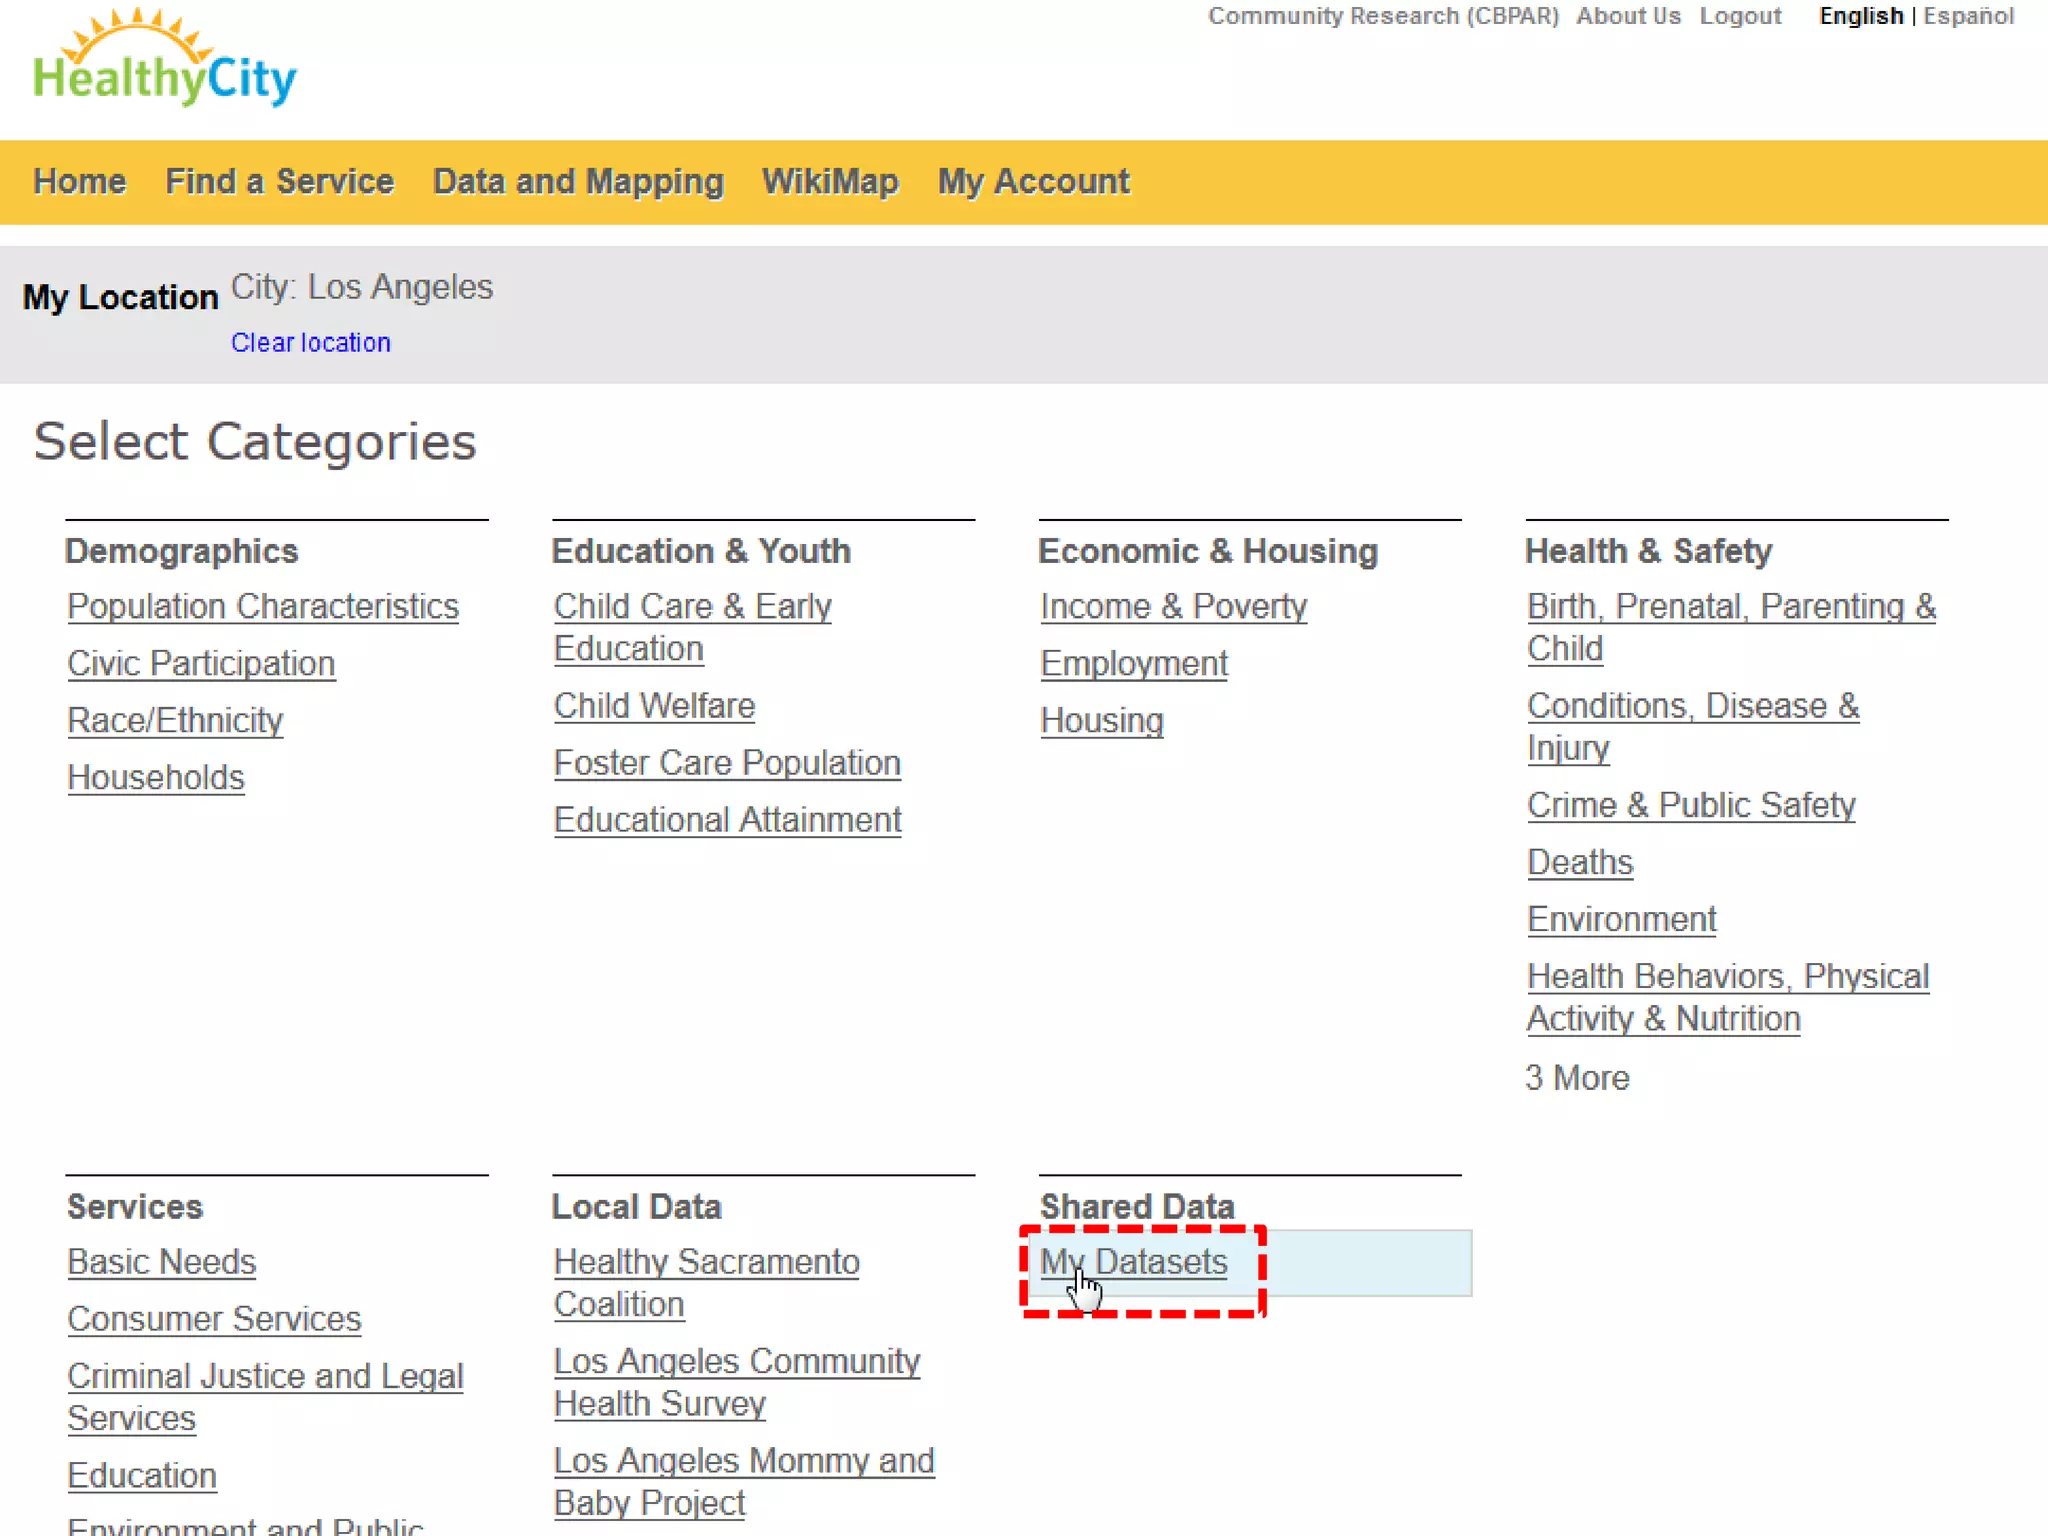
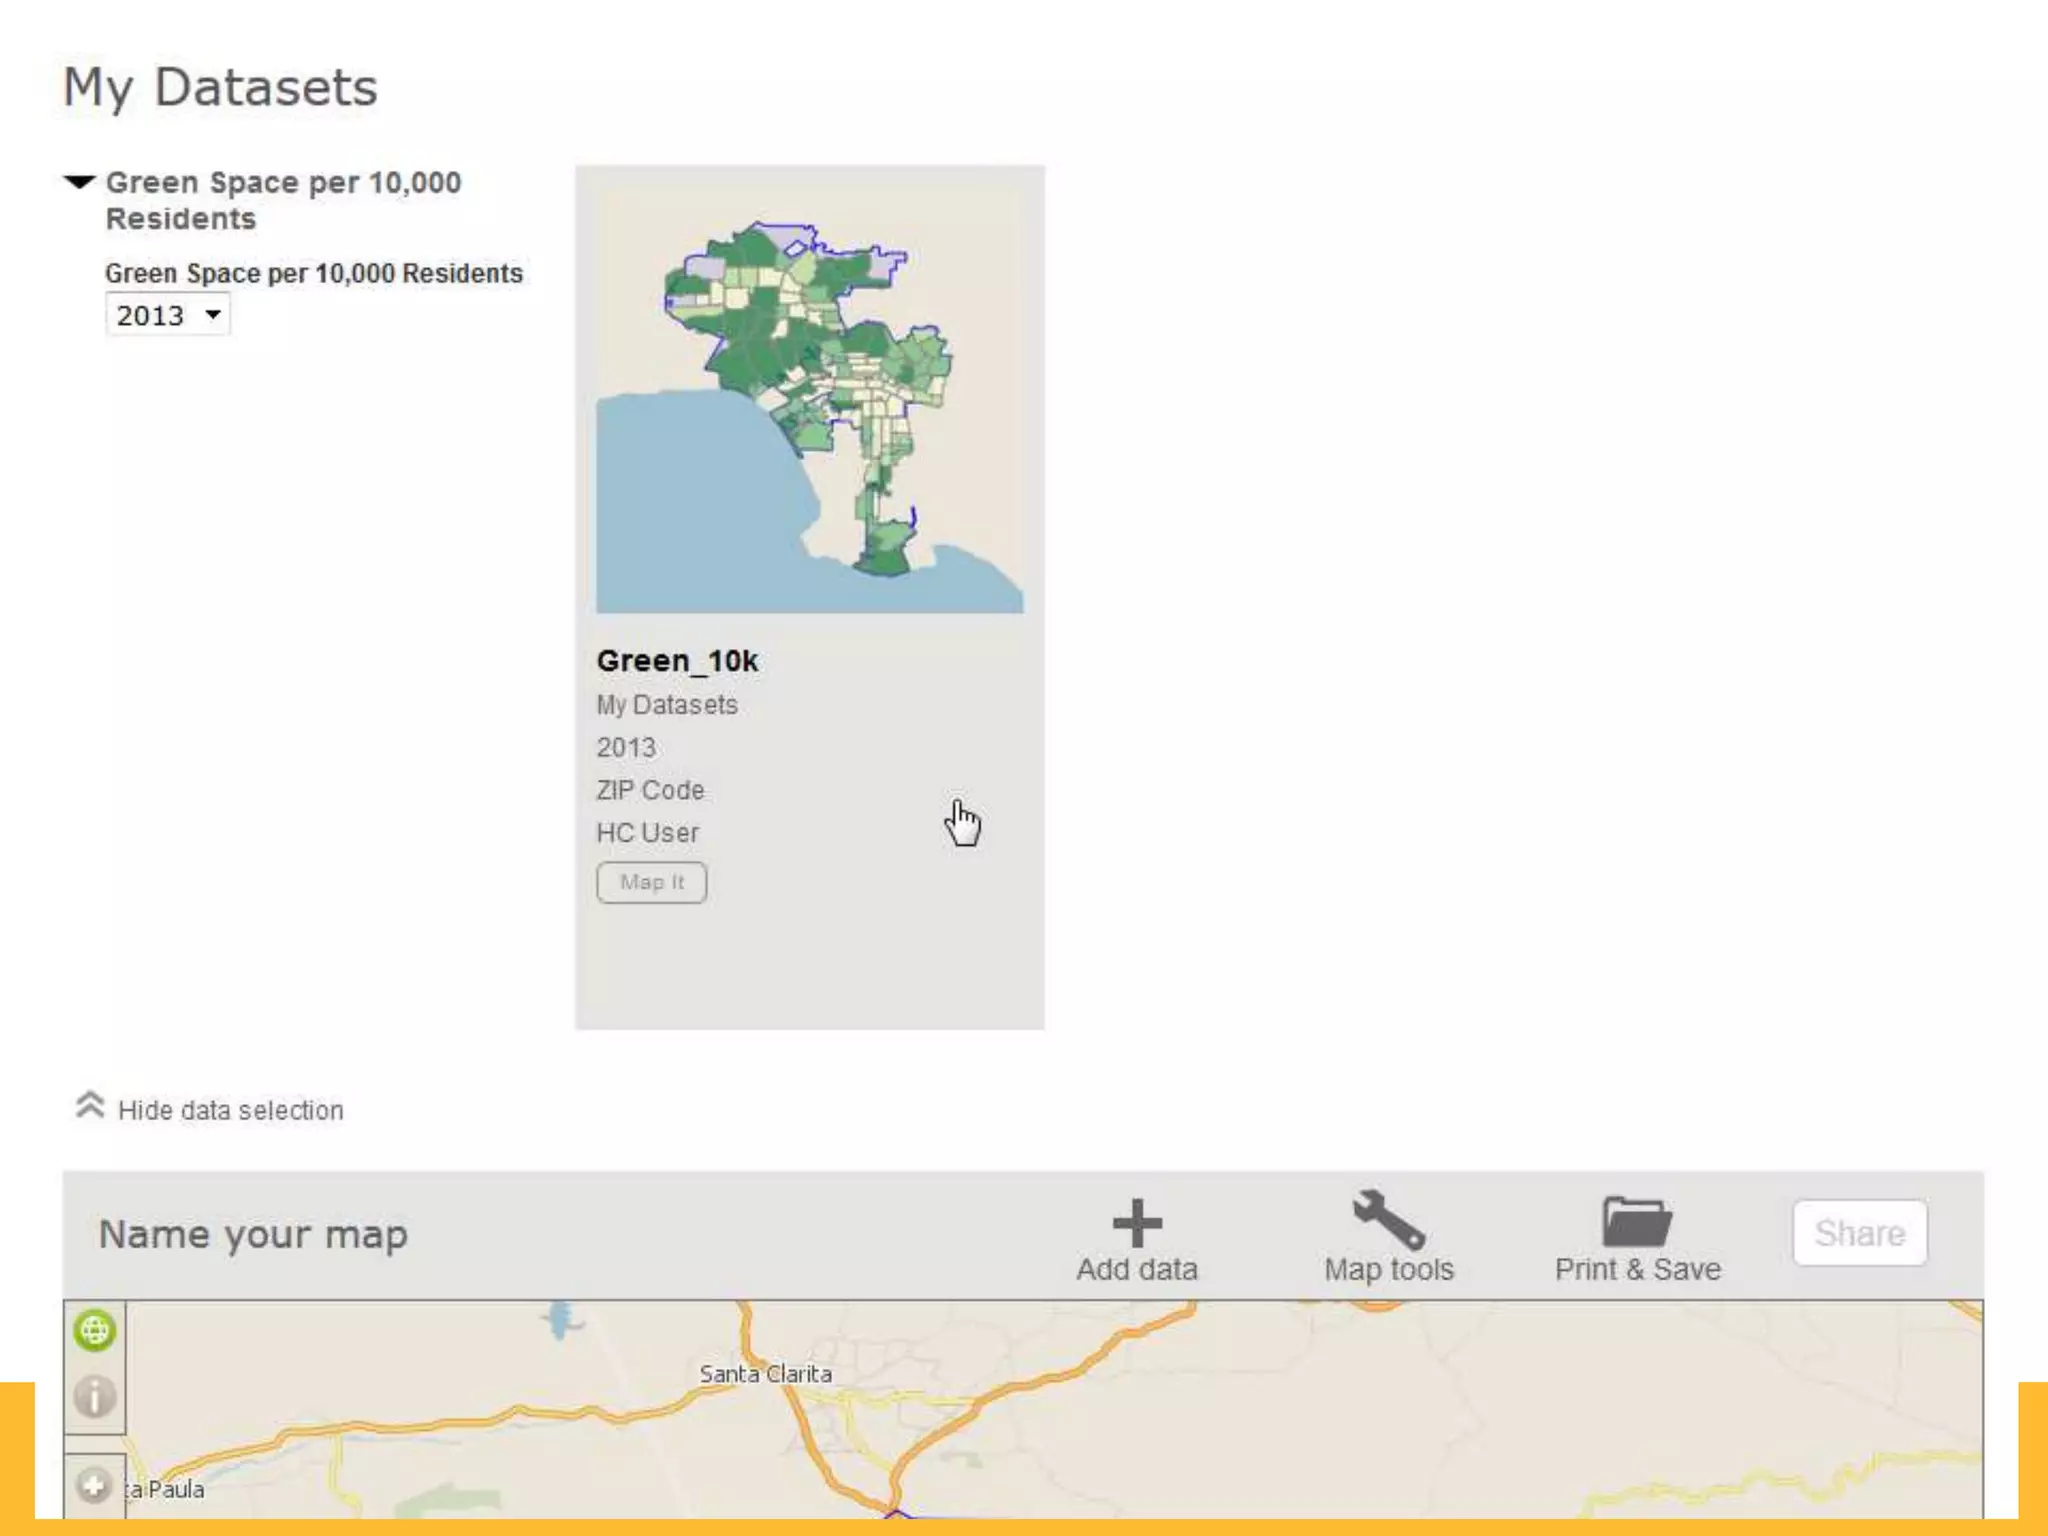
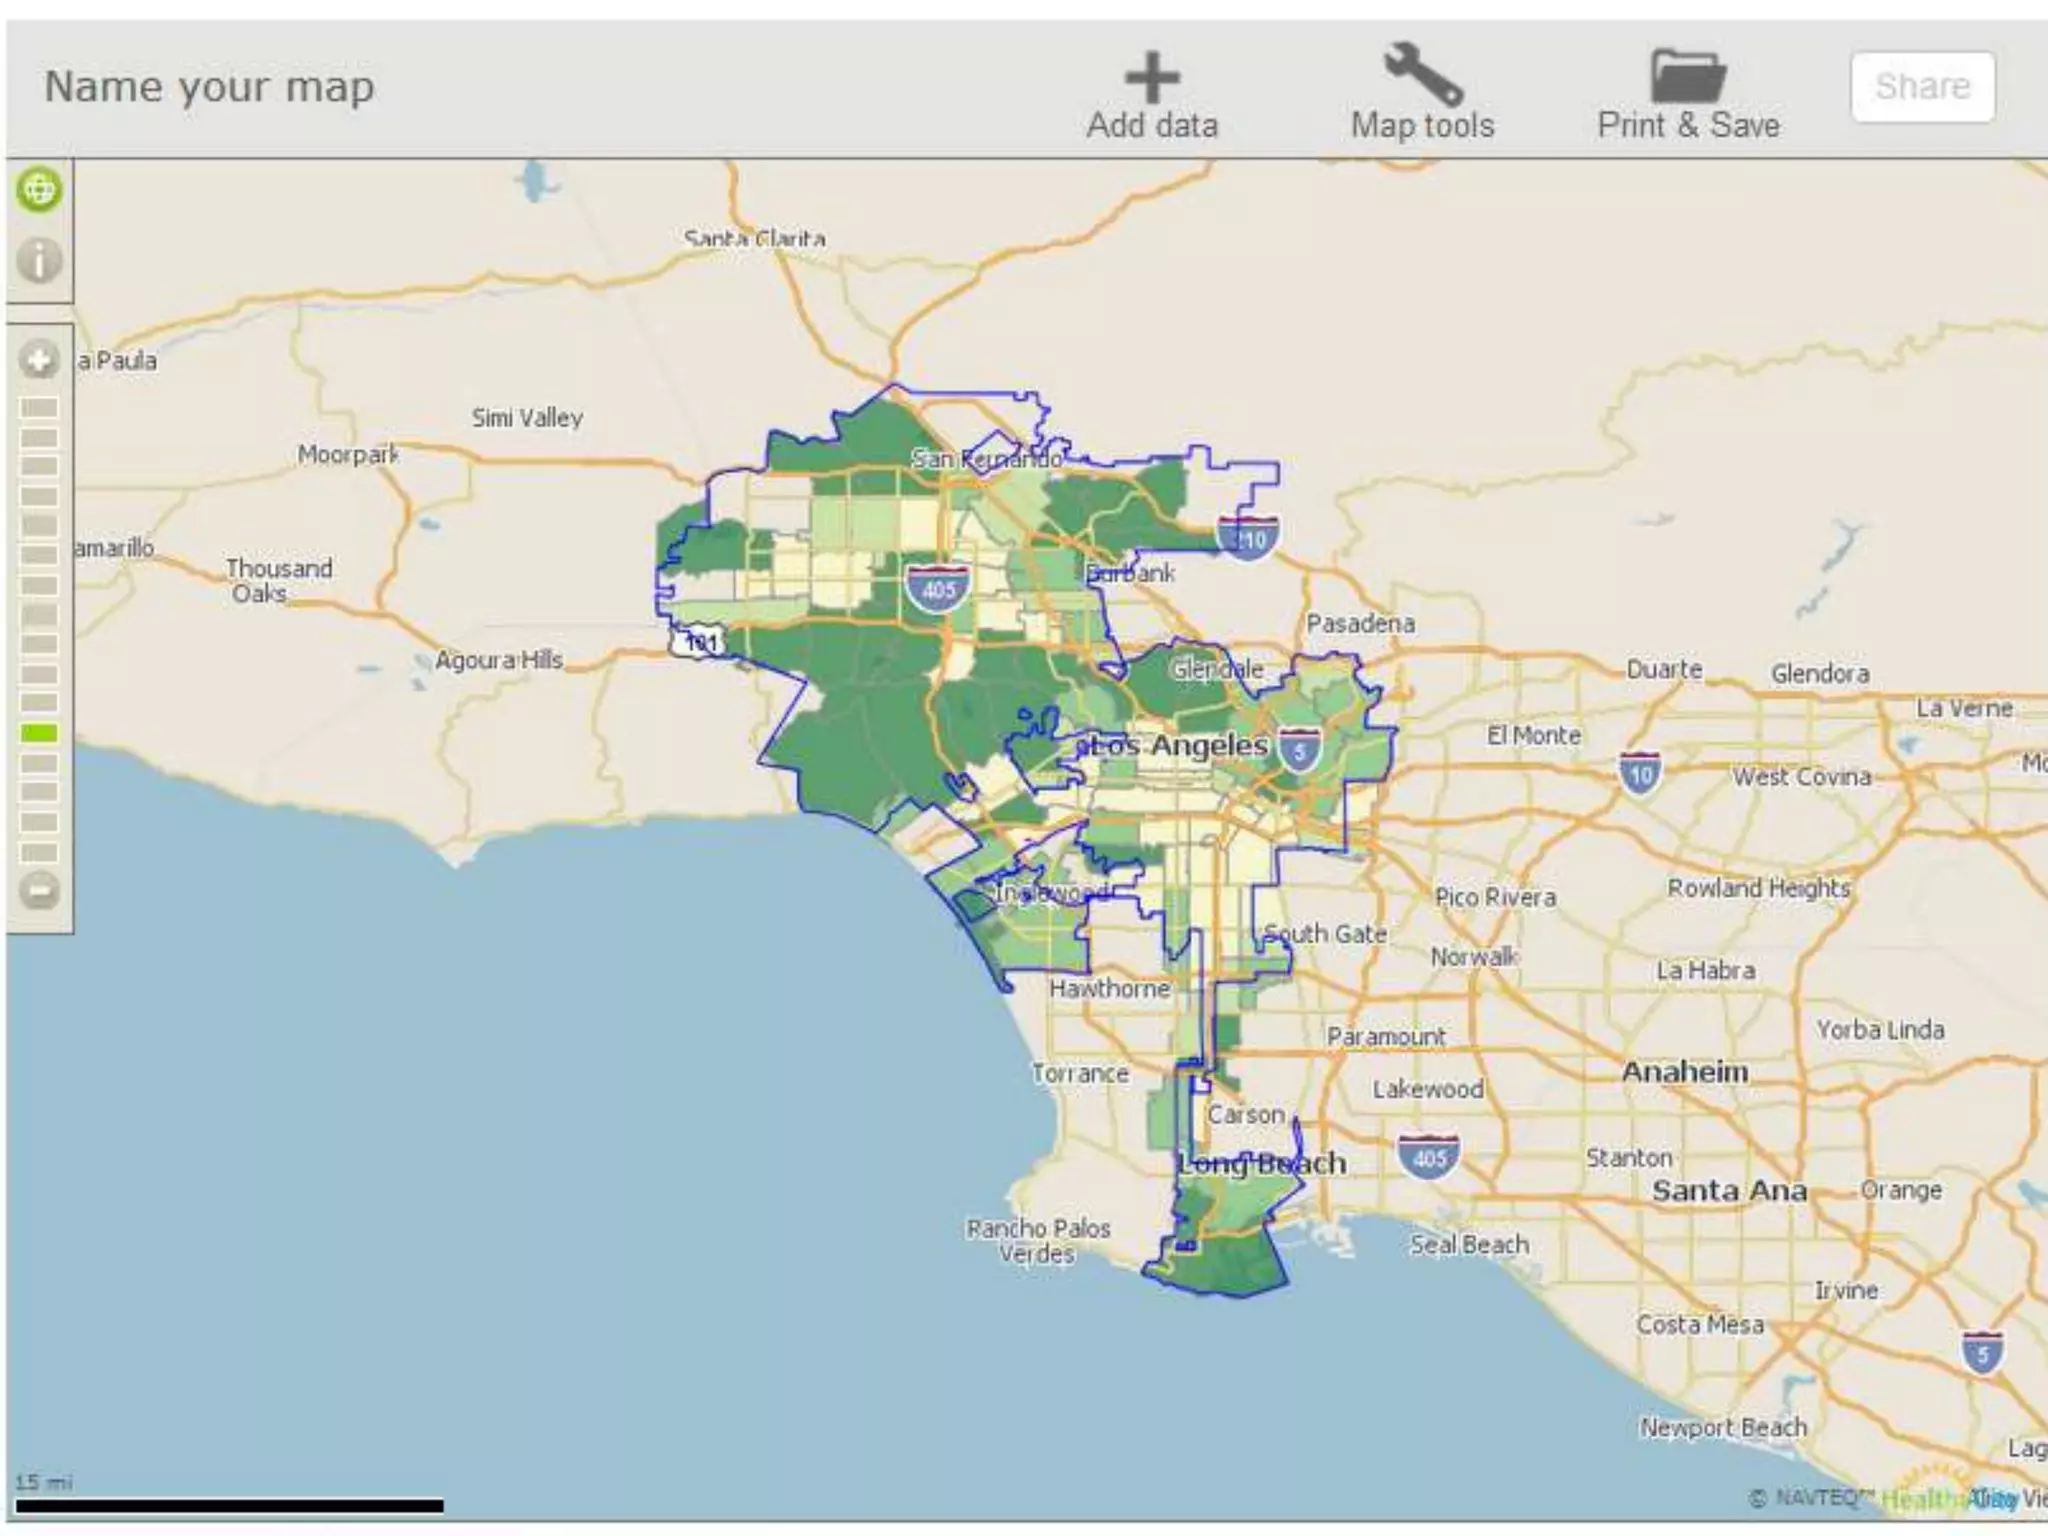
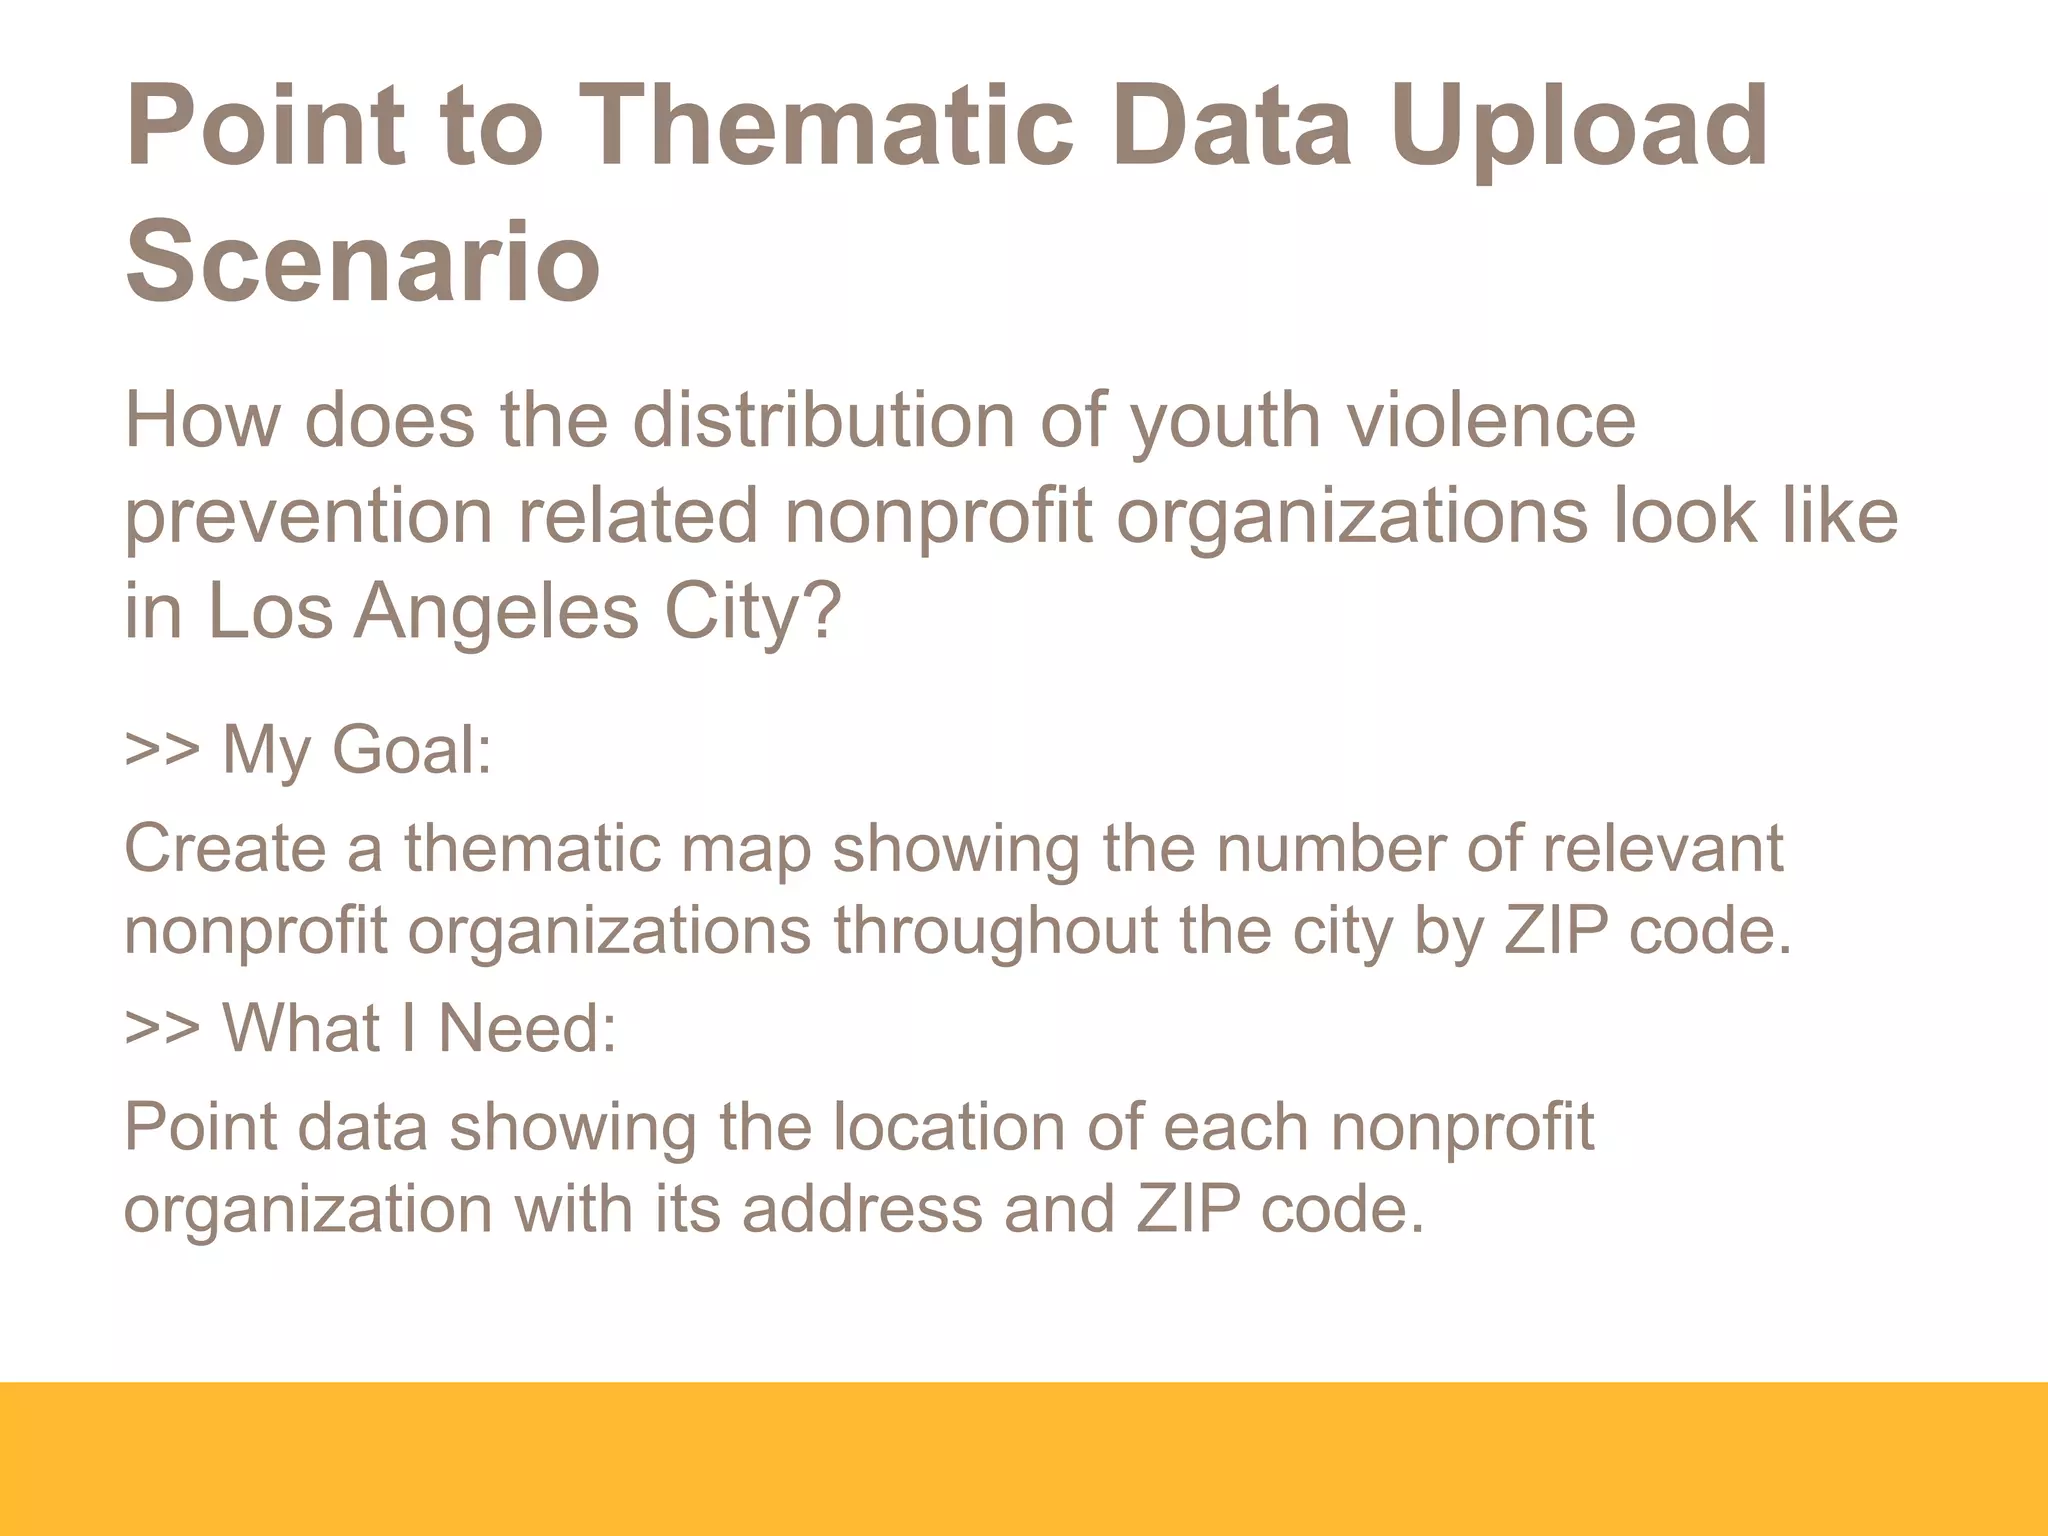
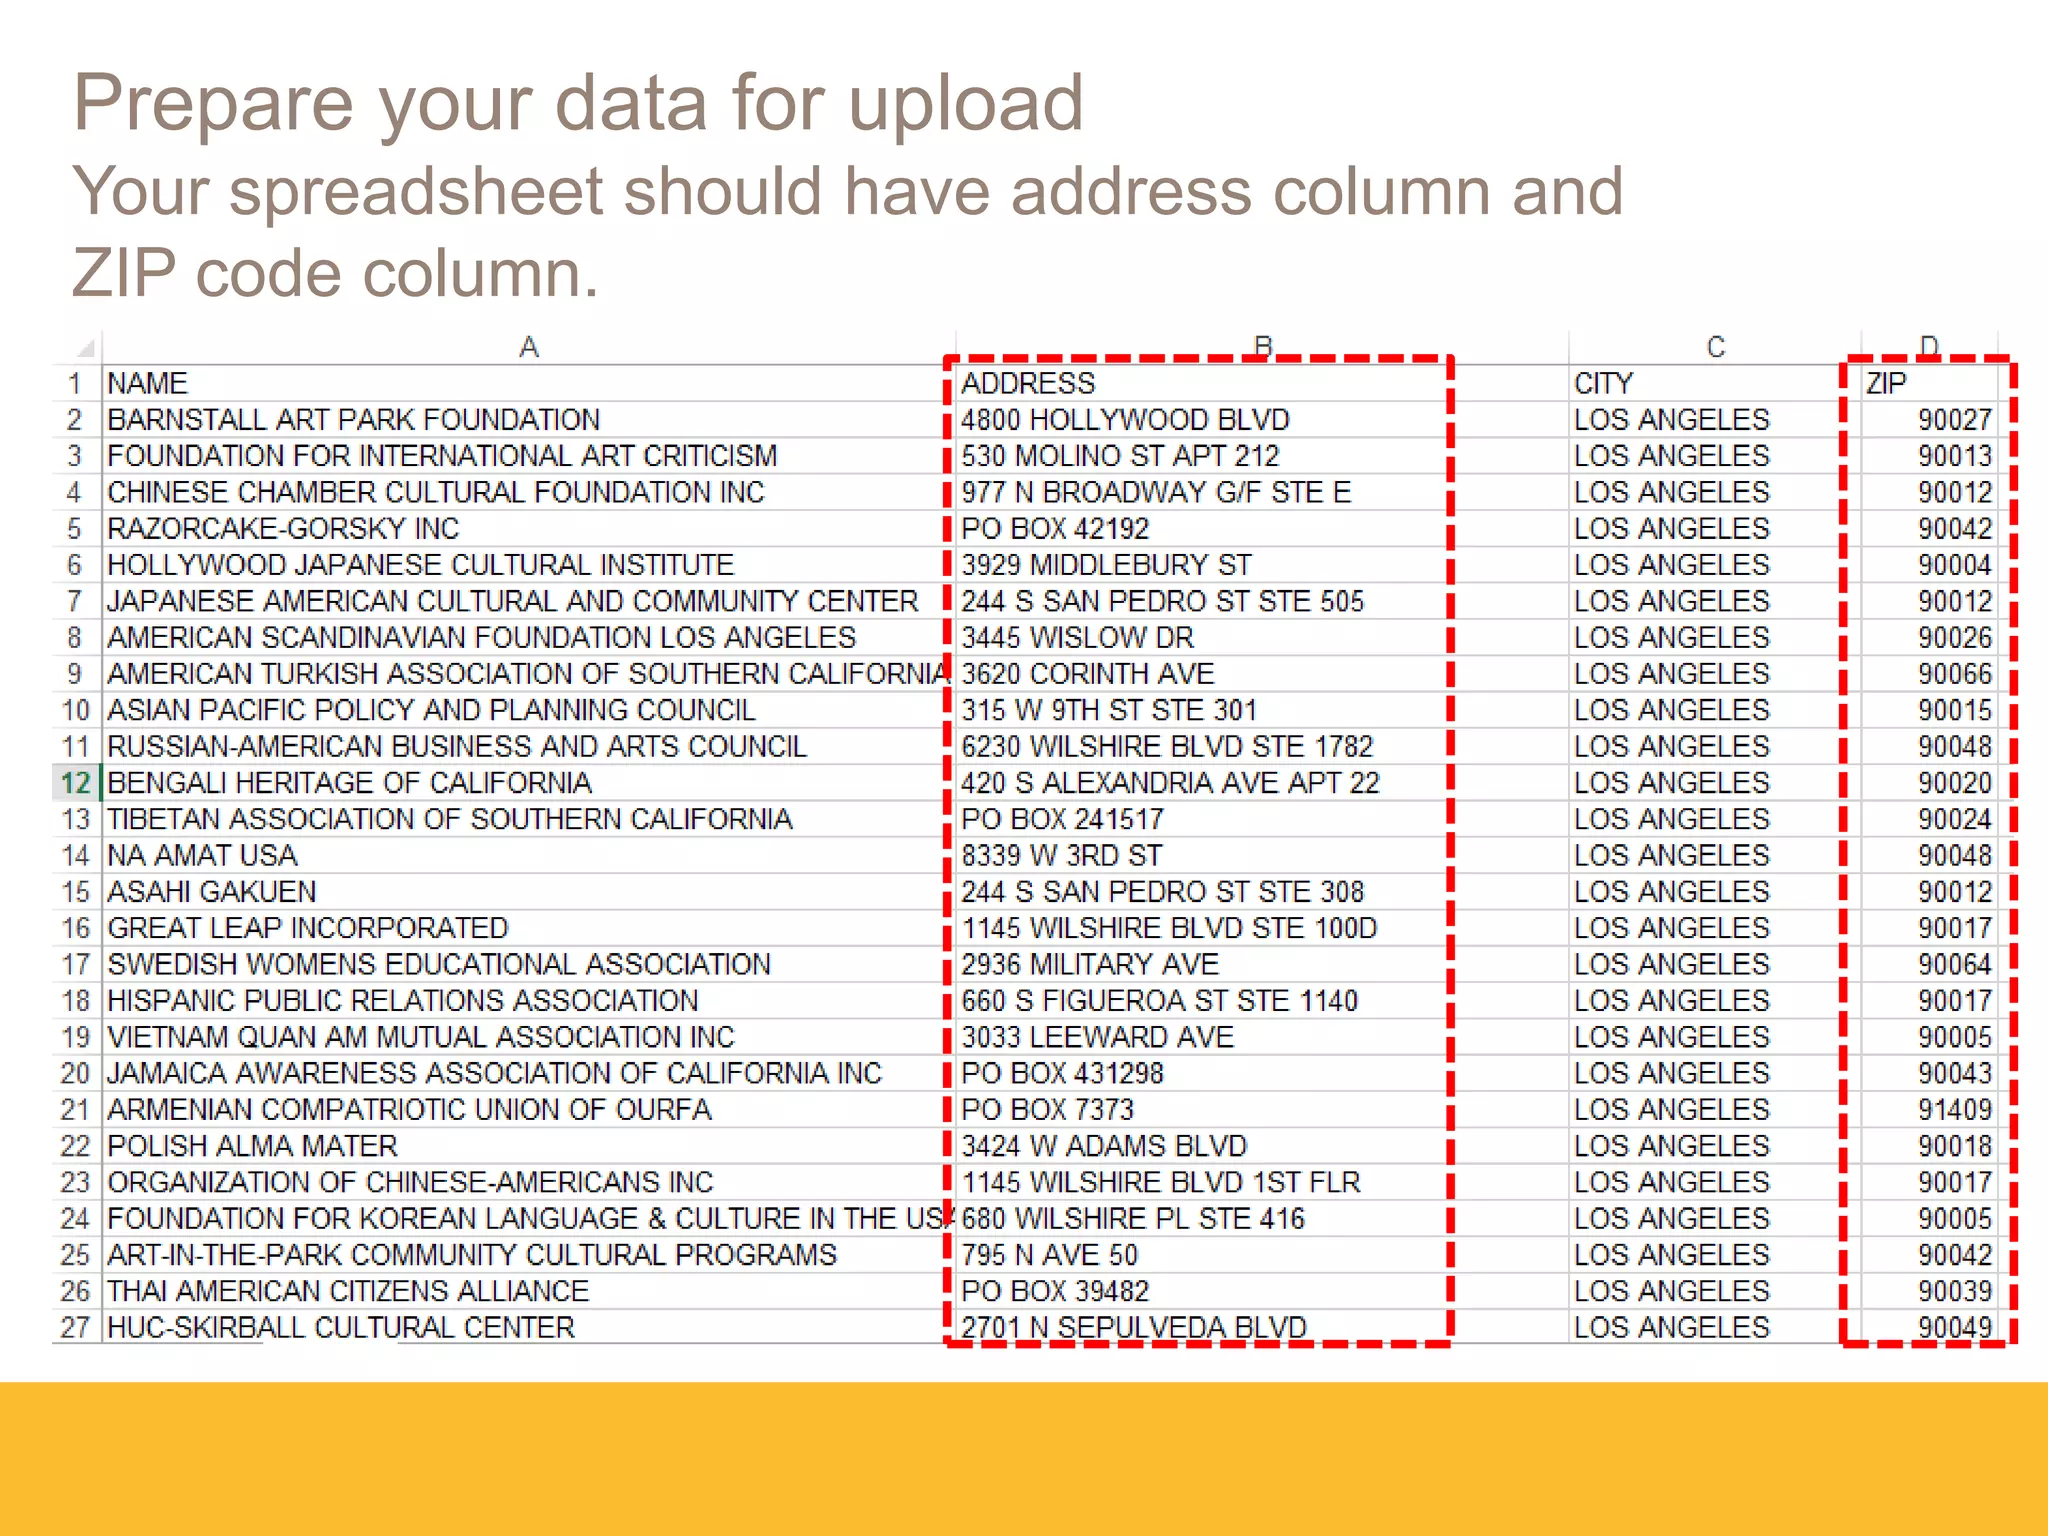
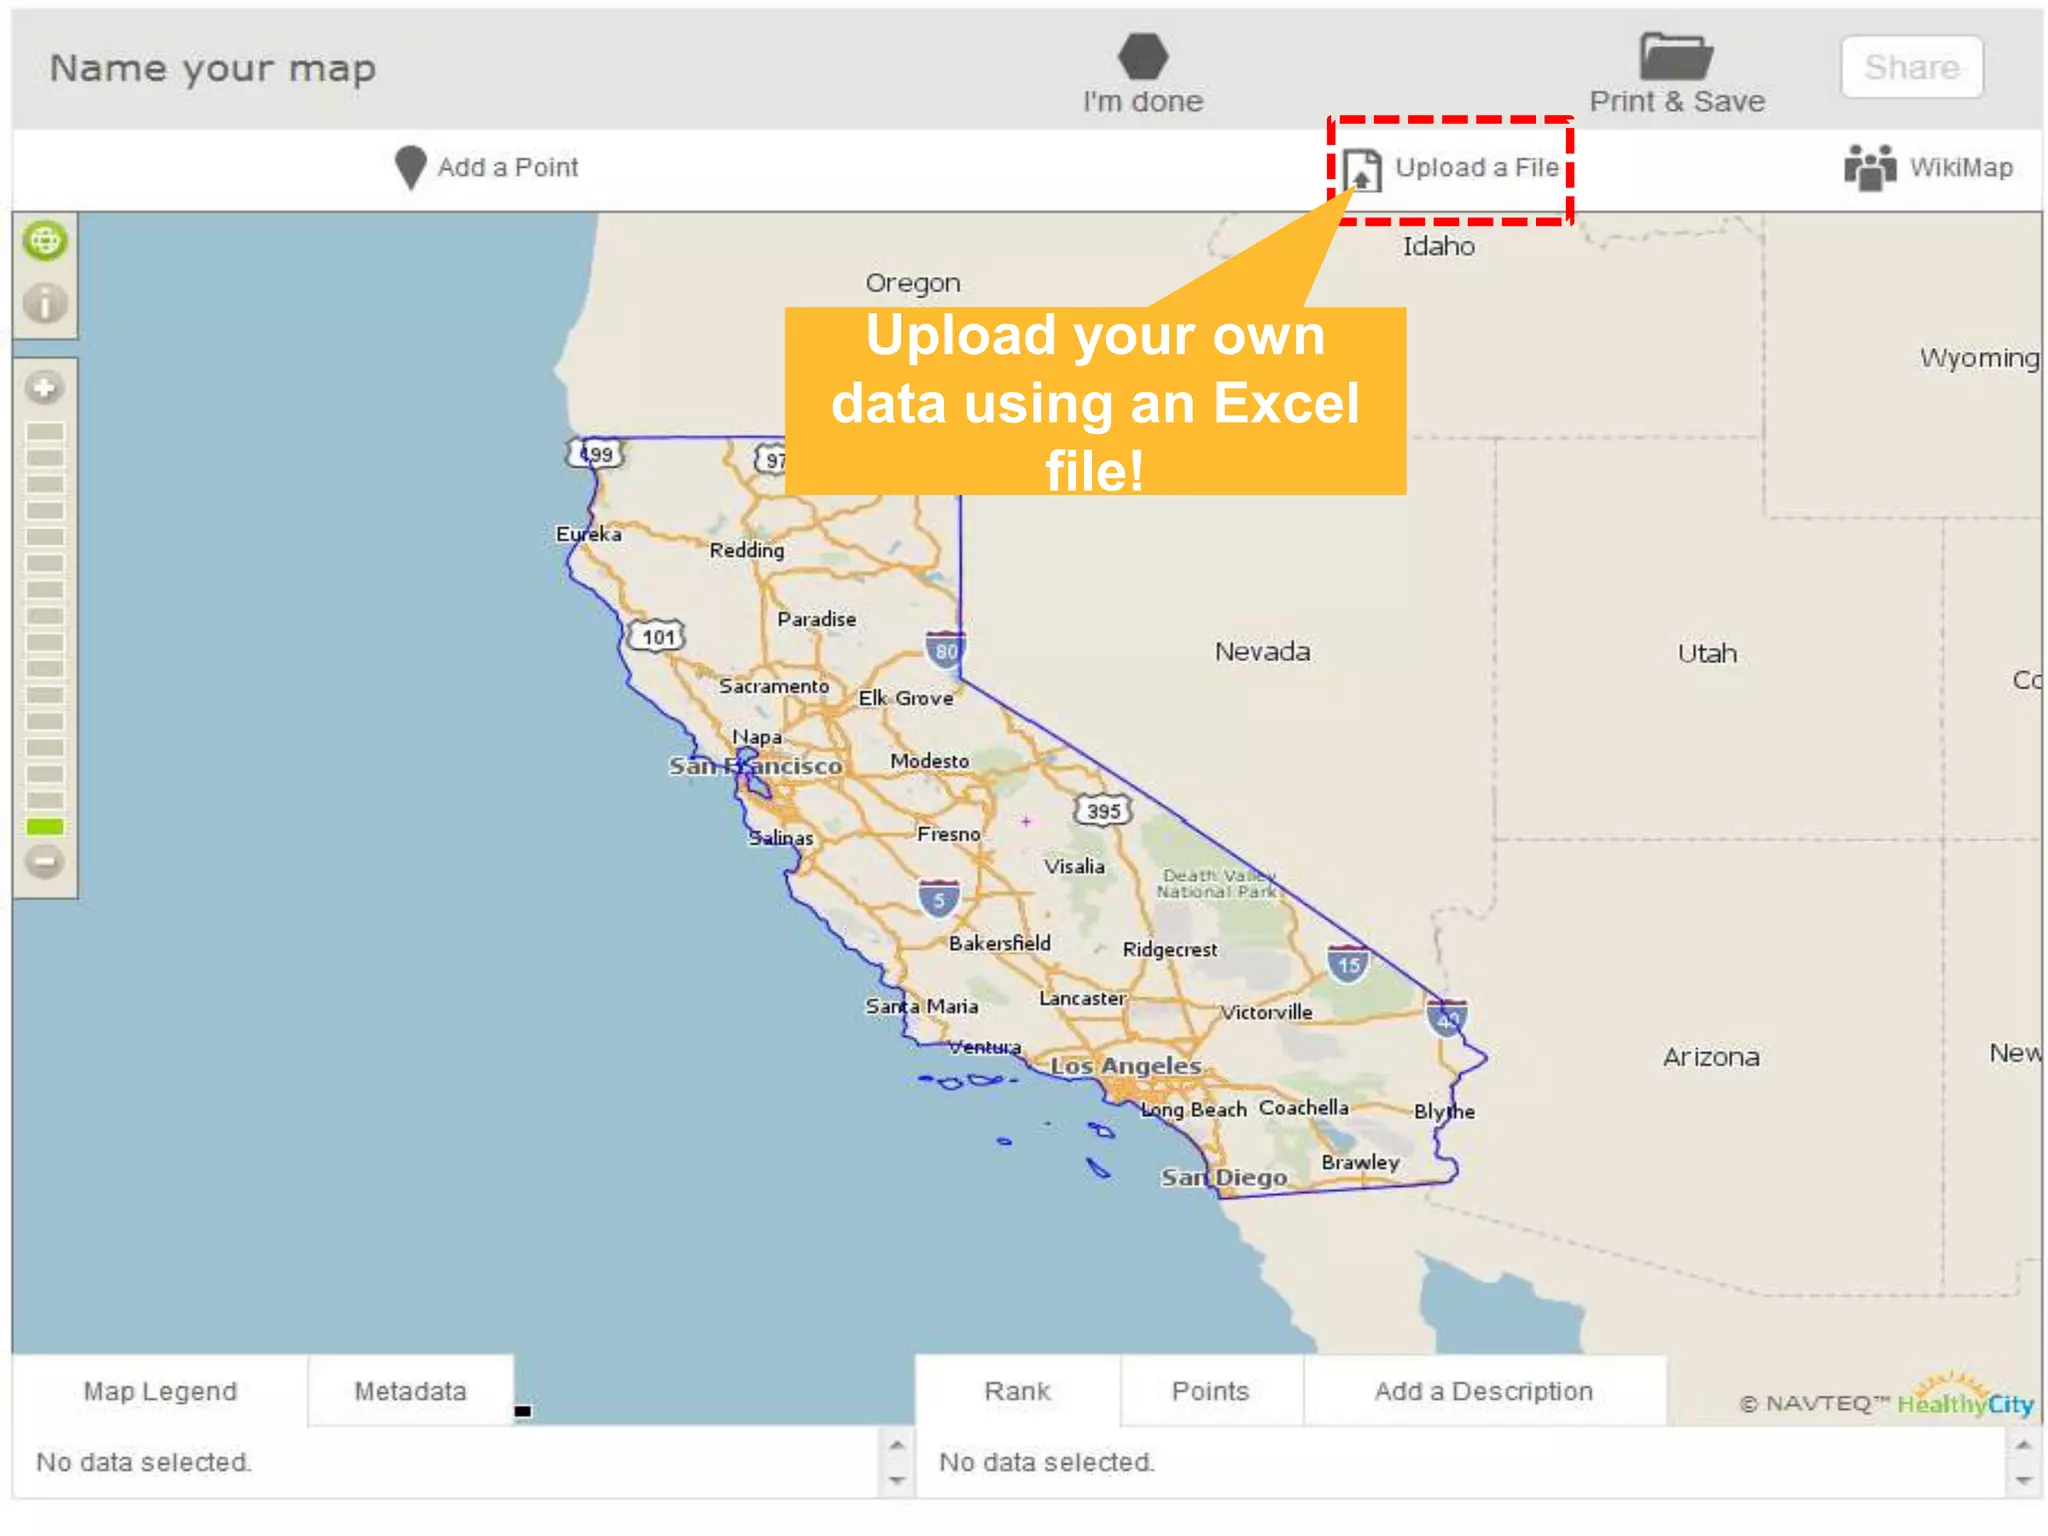
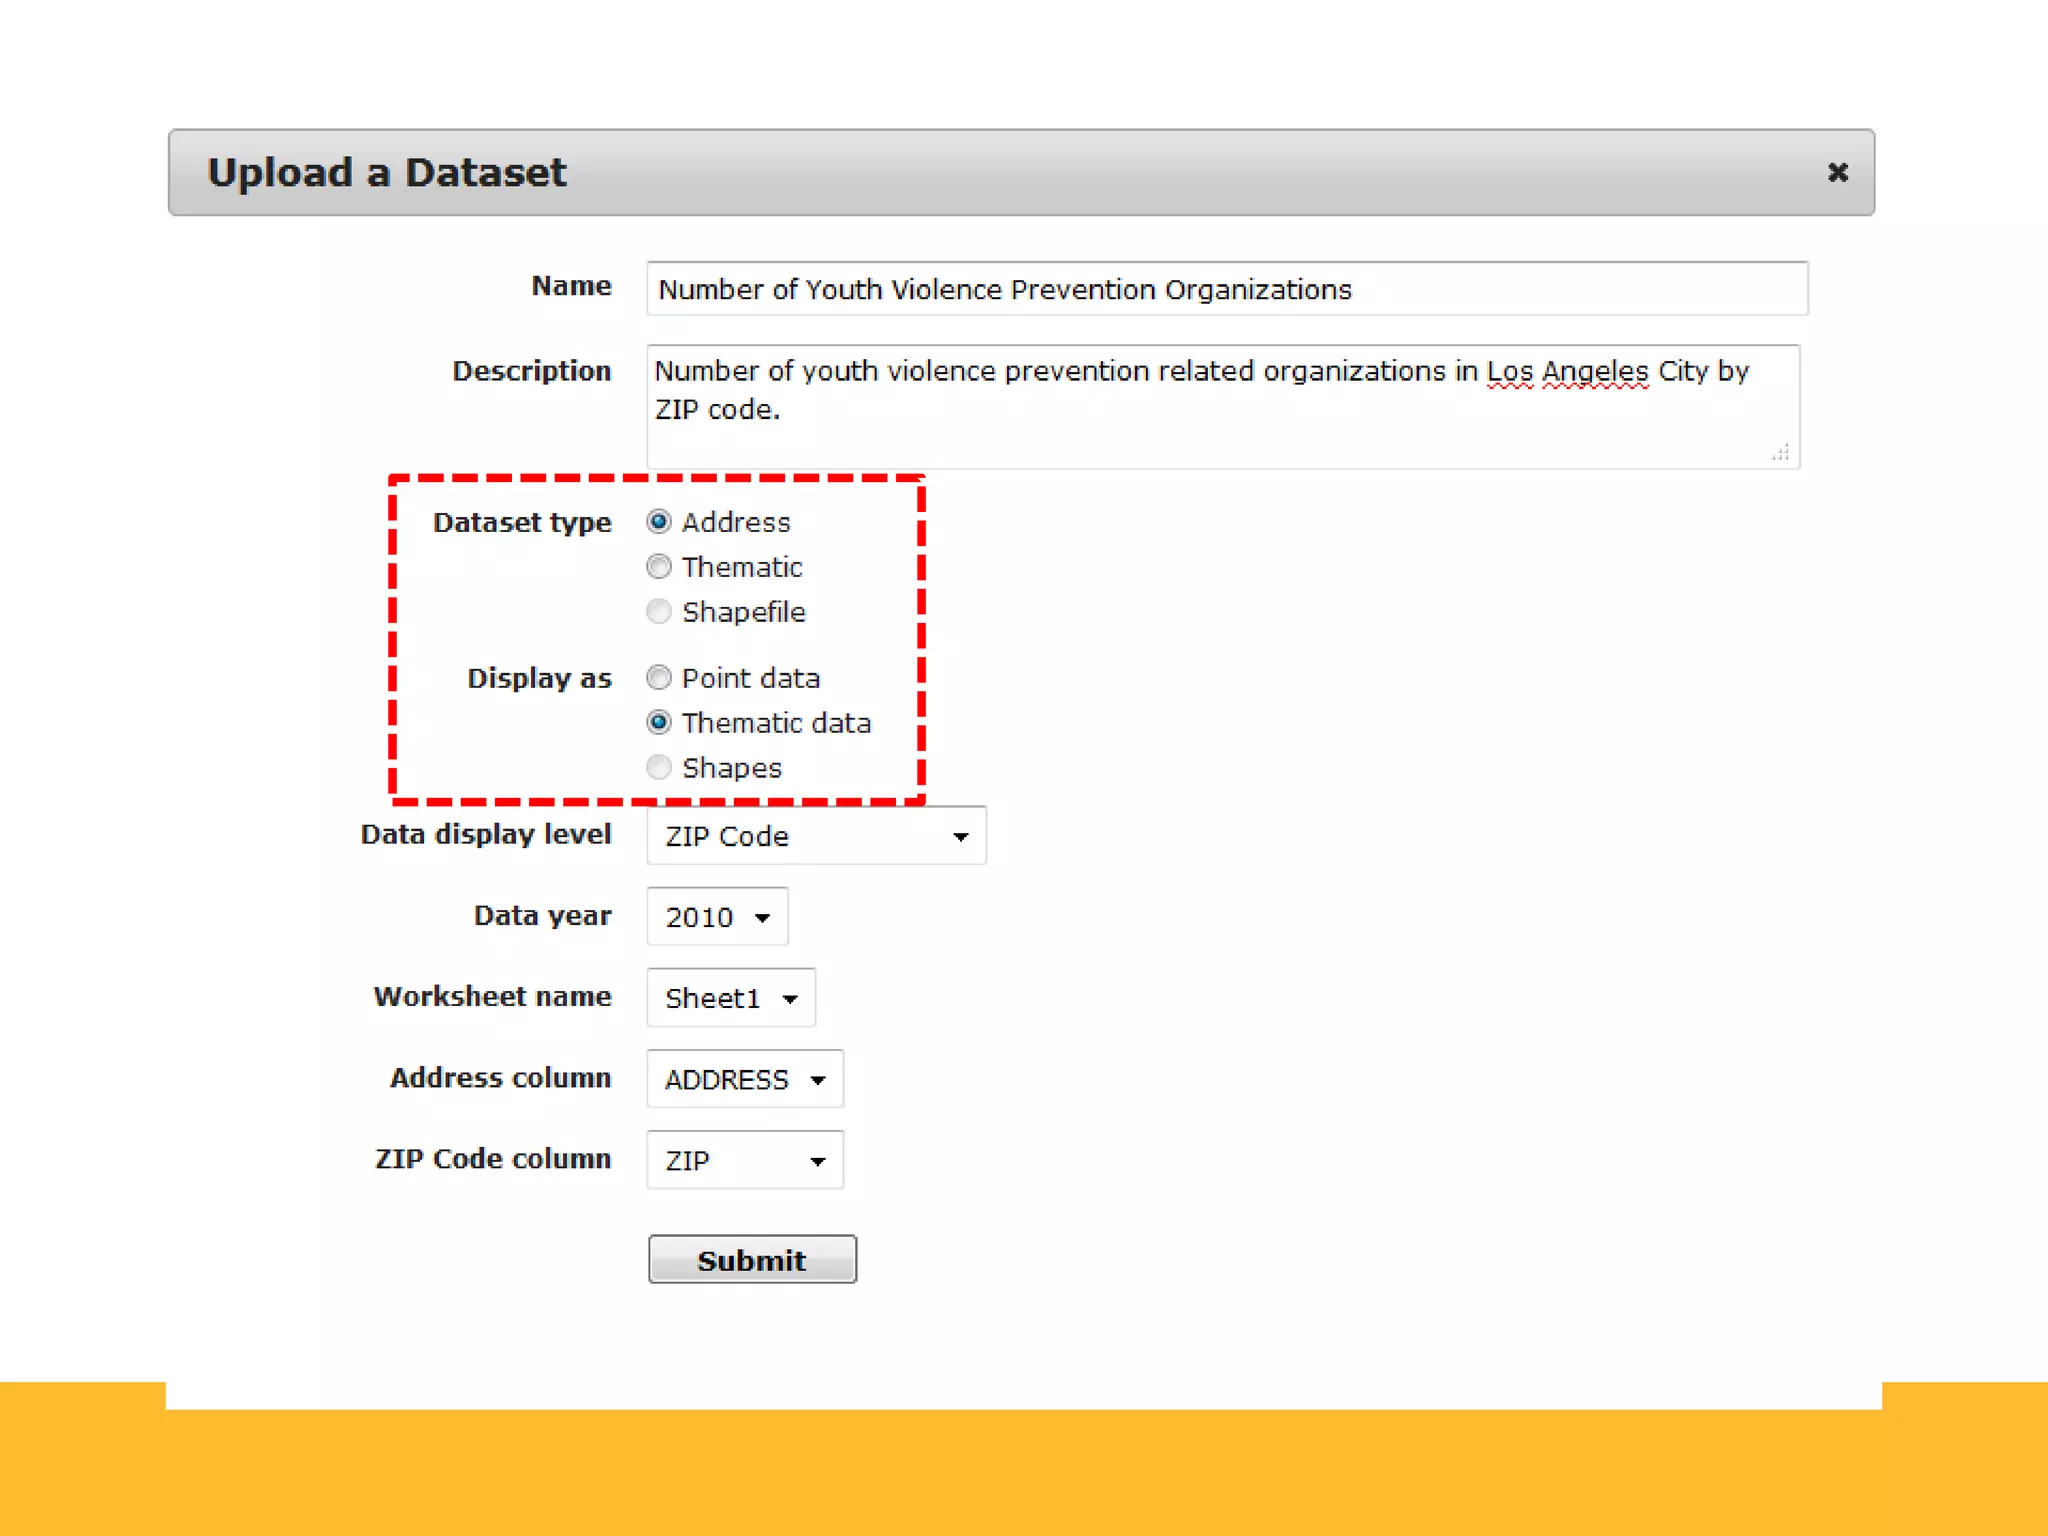

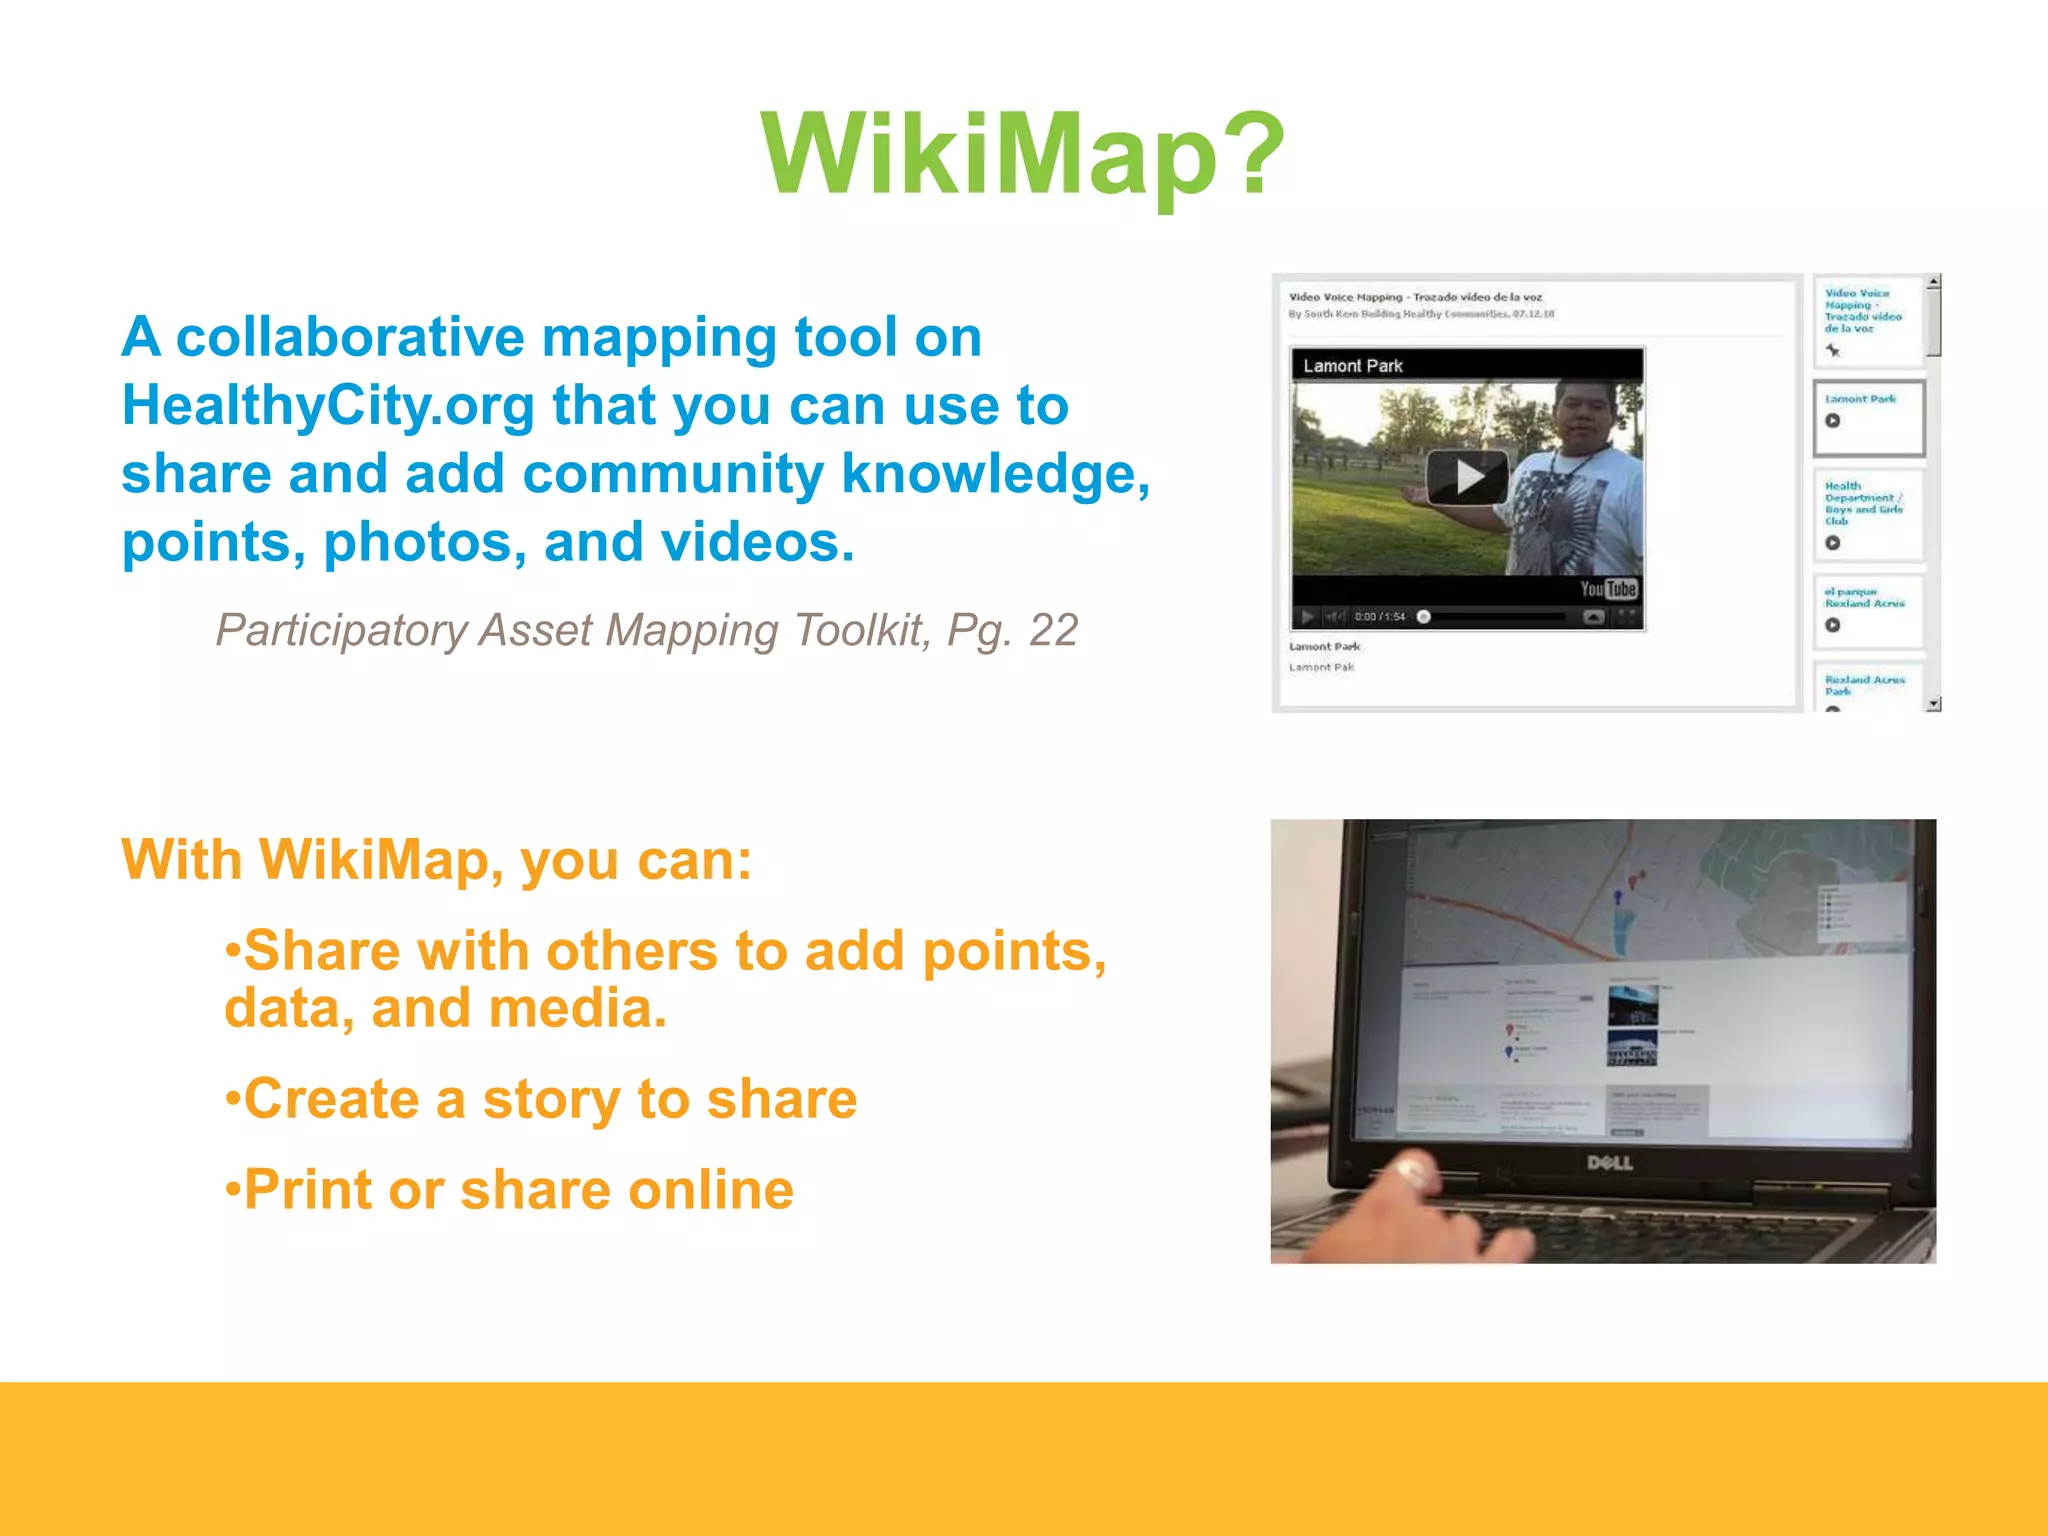

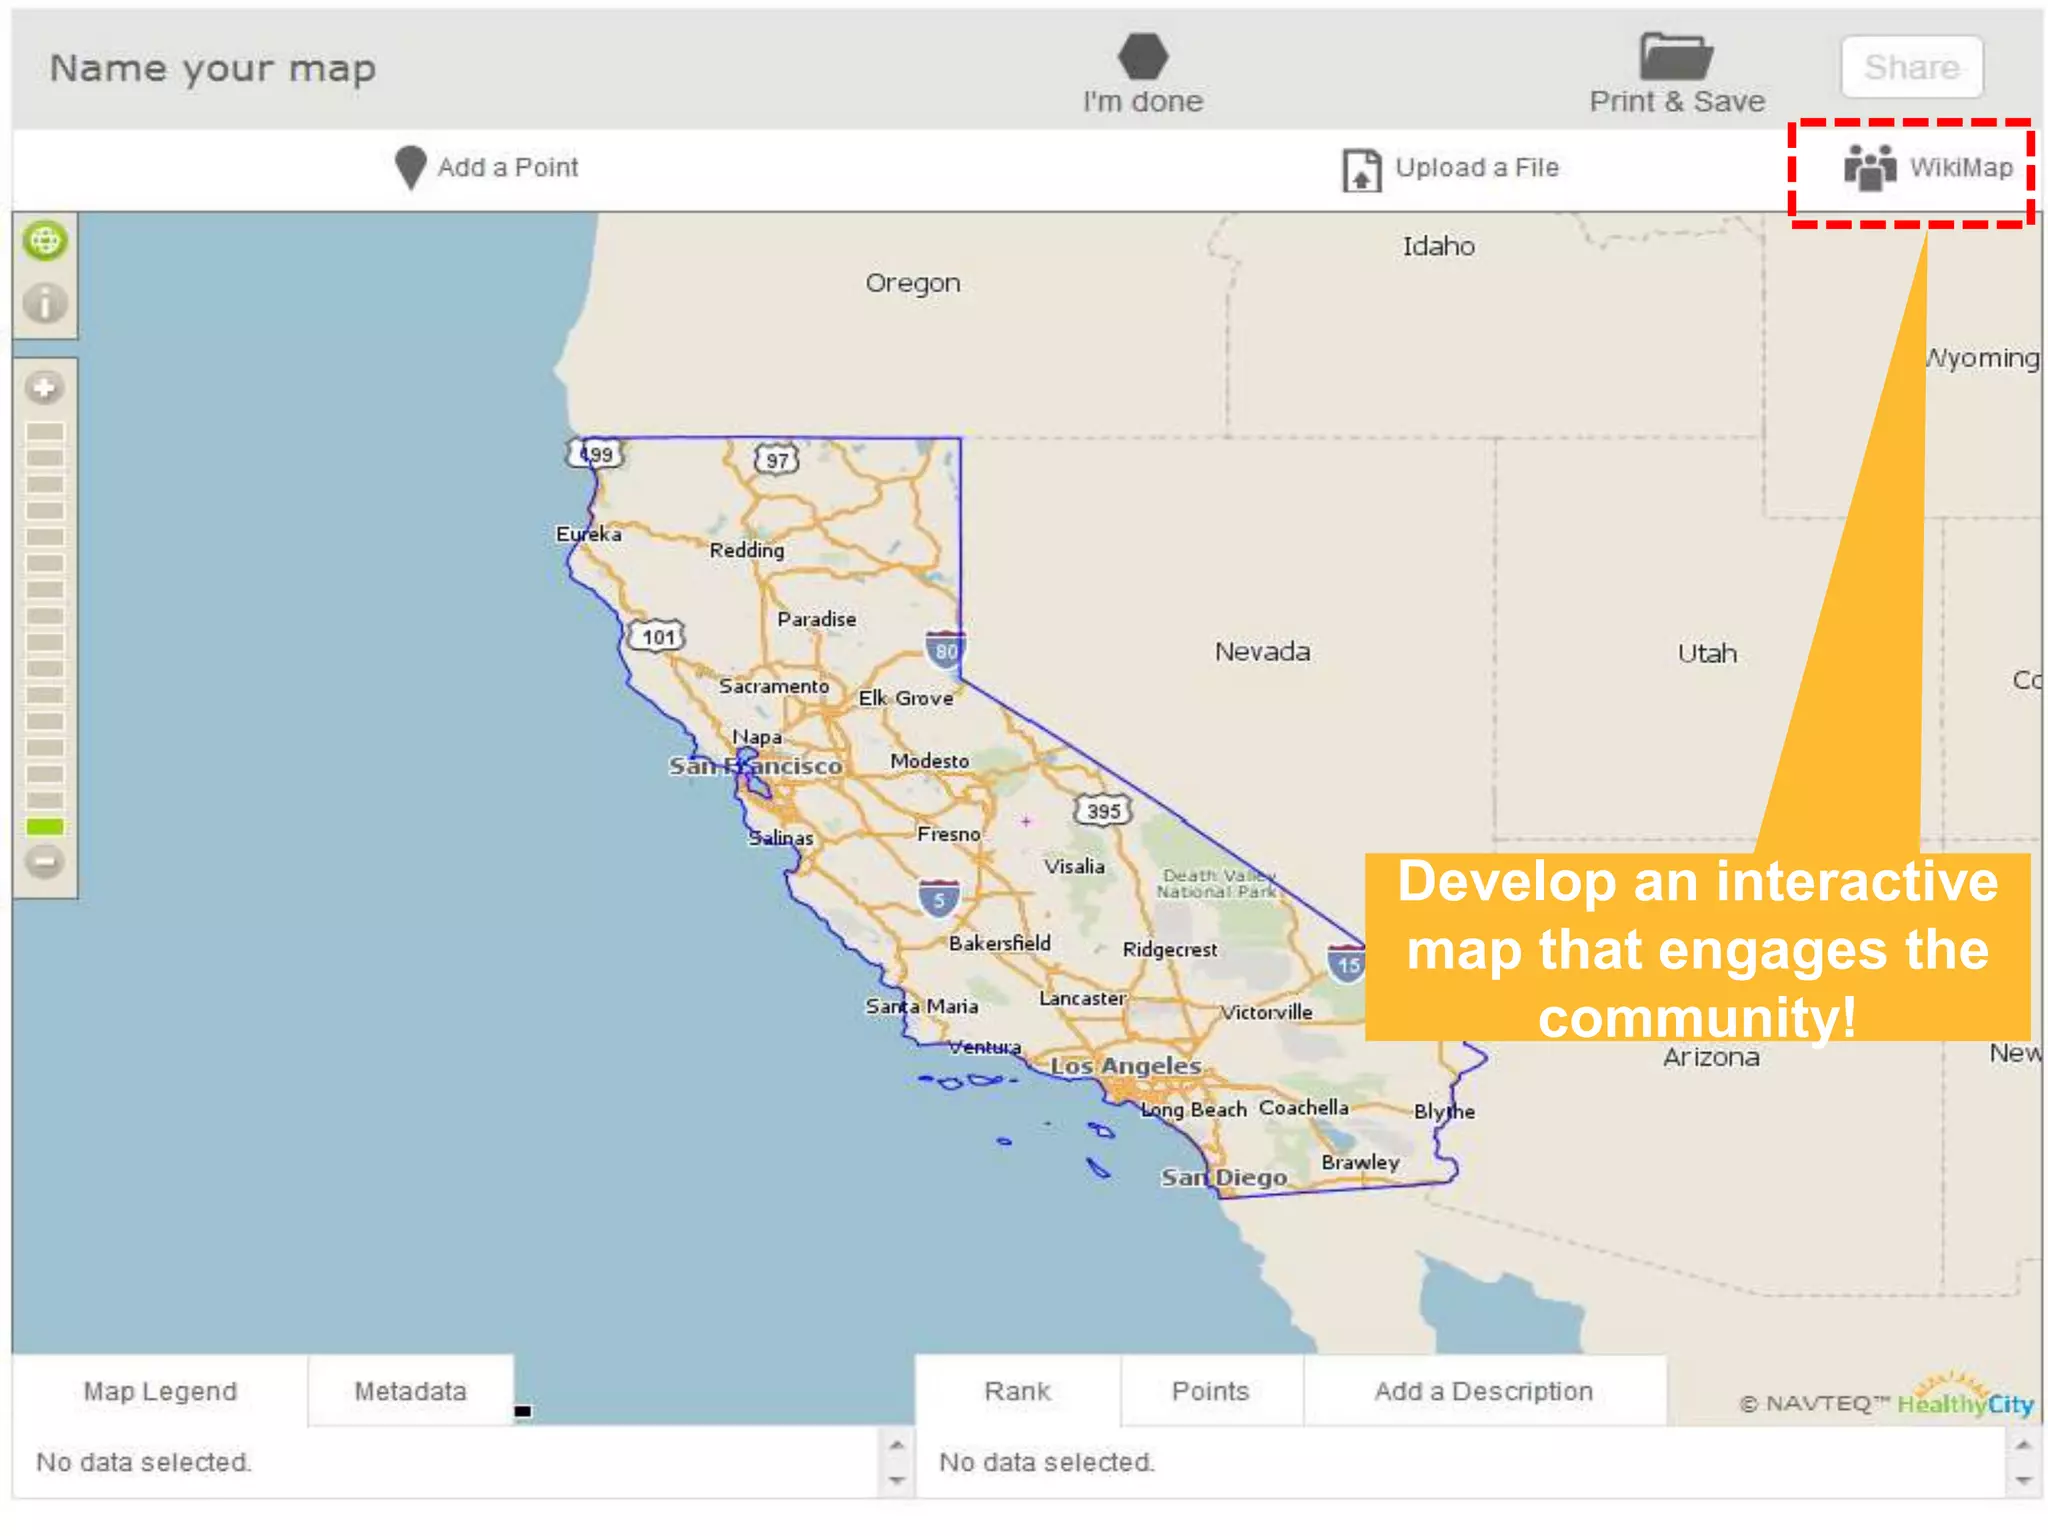


This document provides information and instructions for uploading data to the HealthyCity.org website. It describes the types of geographies and over 2,500 indicators available on the site. It then outlines a training for how to create maps using the site's existing data, upload your own point and thematic data from Excel files and shapefiles, and collect community data using WikiMaps. The training is intended to help users leverage the site's mapping tools and data for community research, planning, and advocacy.


![Tugas pw [10]](https://cdn.slidesharecdn.com/ss_thumbnails/tugaspw10-100316082209-phpapp01-thumbnail.jpg?width=640&height=640&fit=bounds)


