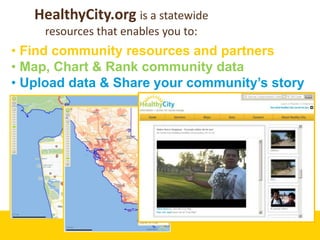
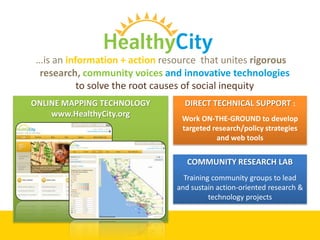
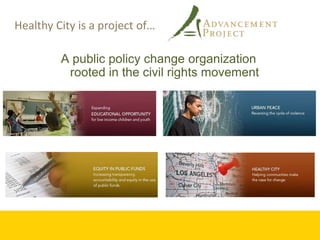
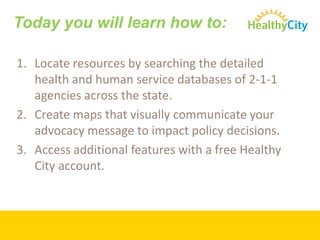
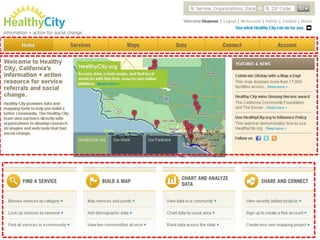
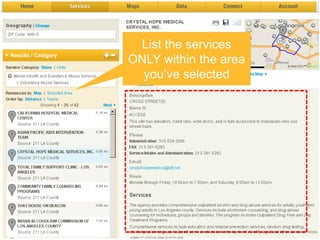
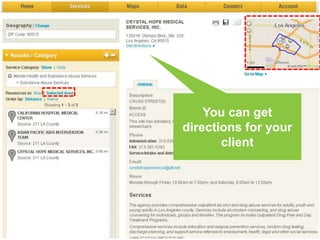
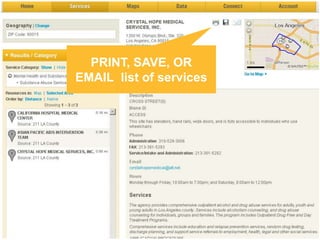
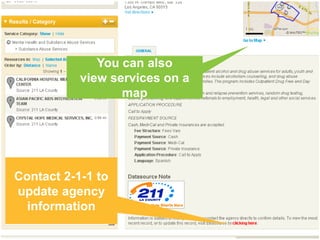
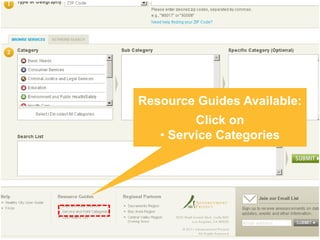
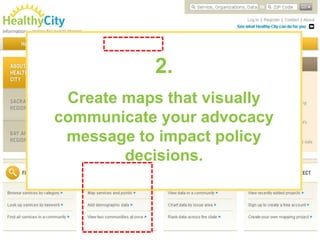
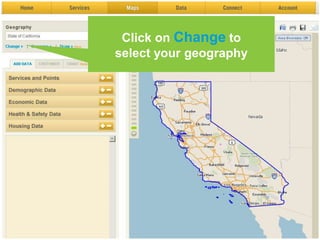
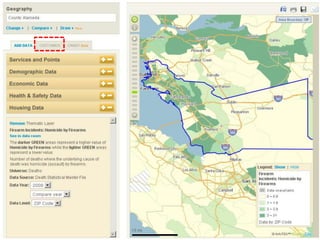
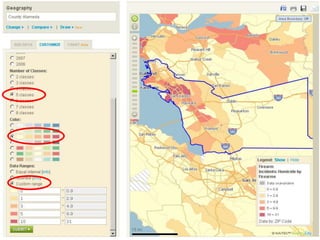
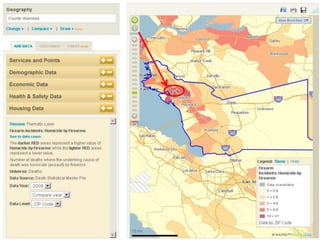
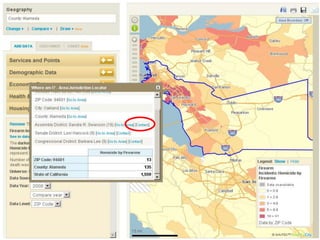
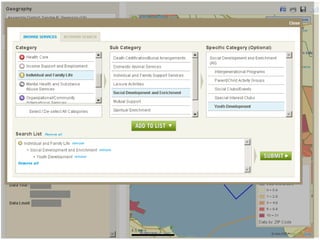
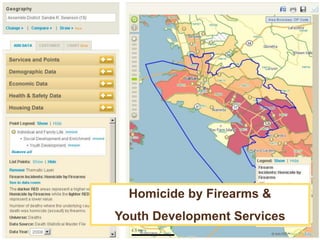
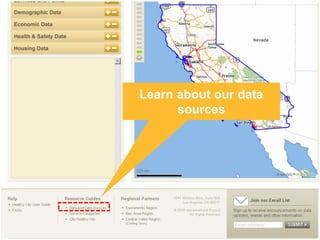
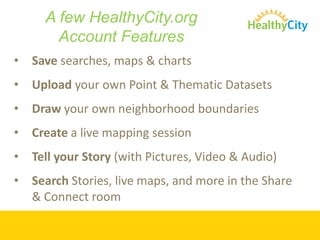
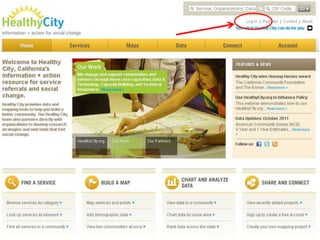
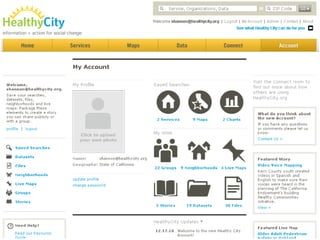
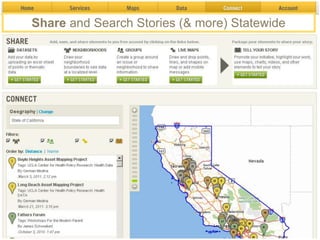
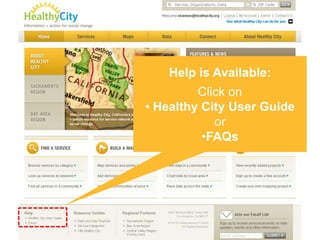
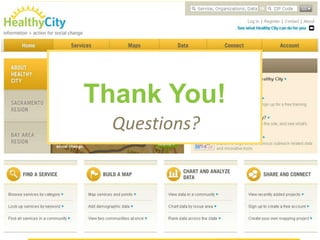
Information + action for social change


   Moreno Valley Towngate Community Center
   Chris Ringewald, Research Mangager chris@healthycity.org
                       January 25th, 2012
Question for Participants

 How do you use maps, charts
 or other data visualization in
 your work?
HealthyCity.org is a statewide
     resources that enables you to:
• Find community resources and partners
• Map, Chart & Rank community data
• Upload data & Share your community’s story
…is an information + action resource that unites rigorous
  research, community voices and innovative technologies
           to solve the root causes of social inequity
ONLINE MAPPING TECHNOLOGY         DIRECT TECHNICAL SUPPORT :
    www.HealthyCity.org
                                 Work ON-THE-GROUND to develop
                                 targeted research/policy strategies
                                           and web tools


                                   COMMUNITY RESEARCH LAB
                                  Training community groups to lead
                                and sustain action-oriented research &
                                          technology projects
Healthy City is a project of…

         A public policy change organization
          rooted in the civil rights movement
Partners
 Children’s Hospital Los Angeles         Oakland Progressive Empowerment
 Advancement Project                     Network
 USC School of Social Work               Contra Costa Crisis Center
 2-1-1 LA County                         United Way of Fresno/2-1-1
 United Ways of California
 Children Now                            2-1-1 San Diego
 California Pan-Ethnic Health Network    2-1-1 Monterey County
 Ella Baker Center for Human Rights      2-1-1 San Bernardino
 Prevention Institute                    Volunteer Center of Riverside County
 The California Endowment                United Way Bay Area/Helplink
 Legal Services of No. Cal.
 California Rural Legal Assistance       Community Service Planning Council – 2-1-1
 Sacramento Housing Alliance             Sacramento
 UC Davis – Center for Regional Change   UW Silicon Valley/Santa Clara
 Community Services Planning Council     Eden I & R – 211 Alameda
 United Way Bay Area                     Interface Children Family Services – 2-1-1
 Santa Clara Comm. Benefits Coalition    Ventura
 Urban Strategies Council                Volunteer Center of Sonoma County
 San Mateo Healthy Communities
 Collaborative
Today you will learn how to:

1. Locate resources by searching the detailed
   health and human service databases of 2-1-1
   agencies across the state.
2. Create maps that visually communicate your
   advocacy message to impact policy decisions.
3. Access additional features with a free Healthy
   City account.
1.
  Find a Service:
You’re a case manager in Los
Angeles looking for substance
 abuse services for a client.
 They live in ZIP code 90015
*ZIP code 90015
*Substance Abuse
      Services
*Substance Abuse
      Services
List the services
ONLY within the area
  you’ve selected
You can get
directions for your
       client
PRINT, SAVE, OR
EMAIL list of services
You can also
           view services on a
                  map


Contact 2-1-1 to
update agency
  information
Resource Guides Available:
         Click on
   • Service Categories
Finding a Service
How might you use services or
  resources in your work?
2.
 Create maps that visually
communicate your advocacy
 message to impact policy
        decisions.
Click on Change to
select your geography
Click on this icon to
   export to Word
Add point data to
highlight resources
 (or show gaps in
     services)
Homicide by Firearms &
Youth Development Services
Learn about our data
      sources
Create maps to visually
  communicate your
       message
 How might you use maps to
 advocate for policy change?
3.
  Learn about
account features
A few HealthyCity.org
        Account Features
•   Save searches, maps & charts
•   Upload your own Point & Thematic Datasets
•   Draw your own neighborhood boundaries
•   Create a live mapping session
•   Tell your Story (with Pictures, Video & Audio)
•   Search Stories, live maps, and more in the Share
    & Connect room
Your Saved searches are
       stored here
Upload your own Point OR
   Thematic Datasets
Ex. LA Best Babies Collaborative Point Data
Ex. LA Best Babies
Covered to ensure
                        Collaborative
confidentiality        Thematic Data
Births to Mothers under 20 Years of Age Receiving Late or No
    Prenatal Care & Total SLABBC Participants 2007 - 2010
Draw your own neighborhood boundaries
Map or Chart data within your new boundary
Create Live Mapping Sessions
 (with Pictures, Video & Audio)


A Live Map enables multiple people
              to :

 • Draw and drop points, lines, and shapes
 on a shared map
 • Attach photos & video
Create a a Story
              Create   Story to:
   Promote your initiative or highlight your work!
       Package your saved maps, live mapping
sessions, reports, multi-media and more into a “story”
                   that you can share
Share and Search Stories (& more) Statewide
Help is Available:
         Click on
• Healthy City User Guide
            or
          •FAQs
Thank You!
  Questions?

Moreno valley introductory training_01.25.12

  • 1.
    Information + actionfor social change Moreno Valley Towngate Community Center Chris Ringewald, Research Mangager chris@healthycity.org January 25th, 2012
  • 2.
    Question for Participants How do you use maps, charts or other data visualization in your work?
  • 3.
    HealthyCity.org is astatewide resources that enables you to: • Find community resources and partners • Map, Chart & Rank community data • Upload data & Share your community’s story
  • 4.
    …is an information+ action resource that unites rigorous research, community voices and innovative technologies to solve the root causes of social inequity ONLINE MAPPING TECHNOLOGY DIRECT TECHNICAL SUPPORT : www.HealthyCity.org Work ON-THE-GROUND to develop targeted research/policy strategies and web tools COMMUNITY RESEARCH LAB Training community groups to lead and sustain action-oriented research & technology projects
  • 5.
    Healthy City isa project of… A public policy change organization rooted in the civil rights movement
  • 6.
    Partners Children’s HospitalLos Angeles Oakland Progressive Empowerment Advancement Project Network USC School of Social Work Contra Costa Crisis Center 2-1-1 LA County United Way of Fresno/2-1-1 United Ways of California Children Now 2-1-1 San Diego California Pan-Ethnic Health Network 2-1-1 Monterey County Ella Baker Center for Human Rights 2-1-1 San Bernardino Prevention Institute Volunteer Center of Riverside County The California Endowment United Way Bay Area/Helplink Legal Services of No. Cal. California Rural Legal Assistance Community Service Planning Council – 2-1-1 Sacramento Housing Alliance Sacramento UC Davis – Center for Regional Change UW Silicon Valley/Santa Clara Community Services Planning Council Eden I & R – 211 Alameda United Way Bay Area Interface Children Family Services – 2-1-1 Santa Clara Comm. Benefits Coalition Ventura Urban Strategies Council Volunteer Center of Sonoma County San Mateo Healthy Communities Collaborative
  • 7.
    Today you willlearn how to: 1. Locate resources by searching the detailed health and human service databases of 2-1-1 agencies across the state. 2. Create maps that visually communicate your advocacy message to impact policy decisions. 3. Access additional features with a free Healthy City account.
  • 9.
    1. Finda Service: You’re a case manager in Los Angeles looking for substance abuse services for a client. They live in ZIP code 90015
  • 10.
  • 11.
  • 12.
  • 13.
    List the services ONLYwithin the area you’ve selected
  • 14.
    You can get directionsfor your client
  • 15.
    PRINT, SAVE, OR EMAILlist of services
  • 16.
    You can also view services on a map Contact 2-1-1 to update agency information
  • 17.
    Resource Guides Available: Click on • Service Categories
  • 18.
    Finding a Service Howmight you use services or resources in your work?
  • 19.
    2. Create mapsthat visually communicate your advocacy message to impact policy decisions.
  • 20.
    Click on Changeto select your geography
  • 31.
    Click on thisicon to export to Word
  • 32.
    Add point datato highlight resources (or show gaps in services)
  • 34.
    Homicide by Firearms& Youth Development Services
  • 35.
    Learn about ourdata sources
  • 36.
    Create maps tovisually communicate your message How might you use maps to advocate for policy change?
  • 37.
    3. Learnabout account features
  • 38.
    A few HealthyCity.org Account Features • Save searches, maps & charts • Upload your own Point & Thematic Datasets • Draw your own neighborhood boundaries • Create a live mapping session • Tell your Story (with Pictures, Video & Audio) • Search Stories, live maps, and more in the Share & Connect room
  • 41.
    Your Saved searchesare stored here
  • 42.
    Upload your ownPoint OR Thematic Datasets
  • 43.
    Ex. LA BestBabies Collaborative Point Data
  • 45.
    Ex. LA BestBabies Covered to ensure Collaborative confidentiality Thematic Data
  • 46.
    Births to Mothersunder 20 Years of Age Receiving Late or No Prenatal Care & Total SLABBC Participants 2007 - 2010
  • 47.
    Draw your ownneighborhood boundaries
  • 48.
    Map or Chartdata within your new boundary
  • 49.
    Create Live MappingSessions (with Pictures, Video & Audio) A Live Map enables multiple people to : • Draw and drop points, lines, and shapes on a shared map • Attach photos & video
  • 50.
    Create a aStory Create Story to: Promote your initiative or highlight your work! Package your saved maps, live mapping sessions, reports, multi-media and more into a “story” that you can share
  • 51.
    Share and SearchStories (& more) Statewide
  • 52.
    Help is Available: Click on • Healthy City User Guide or •FAQs
  • 53.
    Thank You! Questions?

Editor's Notes

  • #11 Fresno Food and shelterZIP code 93710
  • #20 2nd – Now that you’ve explored data for your org/network to demonstrate need across CA. You are now planning to organize legislative visits for your organization and network members. One key area you know you want to focus on is Alameda county, where you have key orgs in the network who can support advocacy in the area as well as data to demonstrate the need for funding to support youth violence prevention. Therefore, your next step would be to drill down to Alameda county, to find additional data that might be helpful and persuasive to lawmakers (might help them make the case for more/priority funding as well)
  • #25 Look at homicide by Firearms to demonstrate exposure to violence within communities.
  • #35 You might also want to assess types of resources or gaps in resources that exist within this area of high need.
  • #43 In order to provide funders with information about the number and geographic location of participants in the program, SLABBC could upload their participant data, and view it along with other data available on HealthyCity.org