Download to read offline
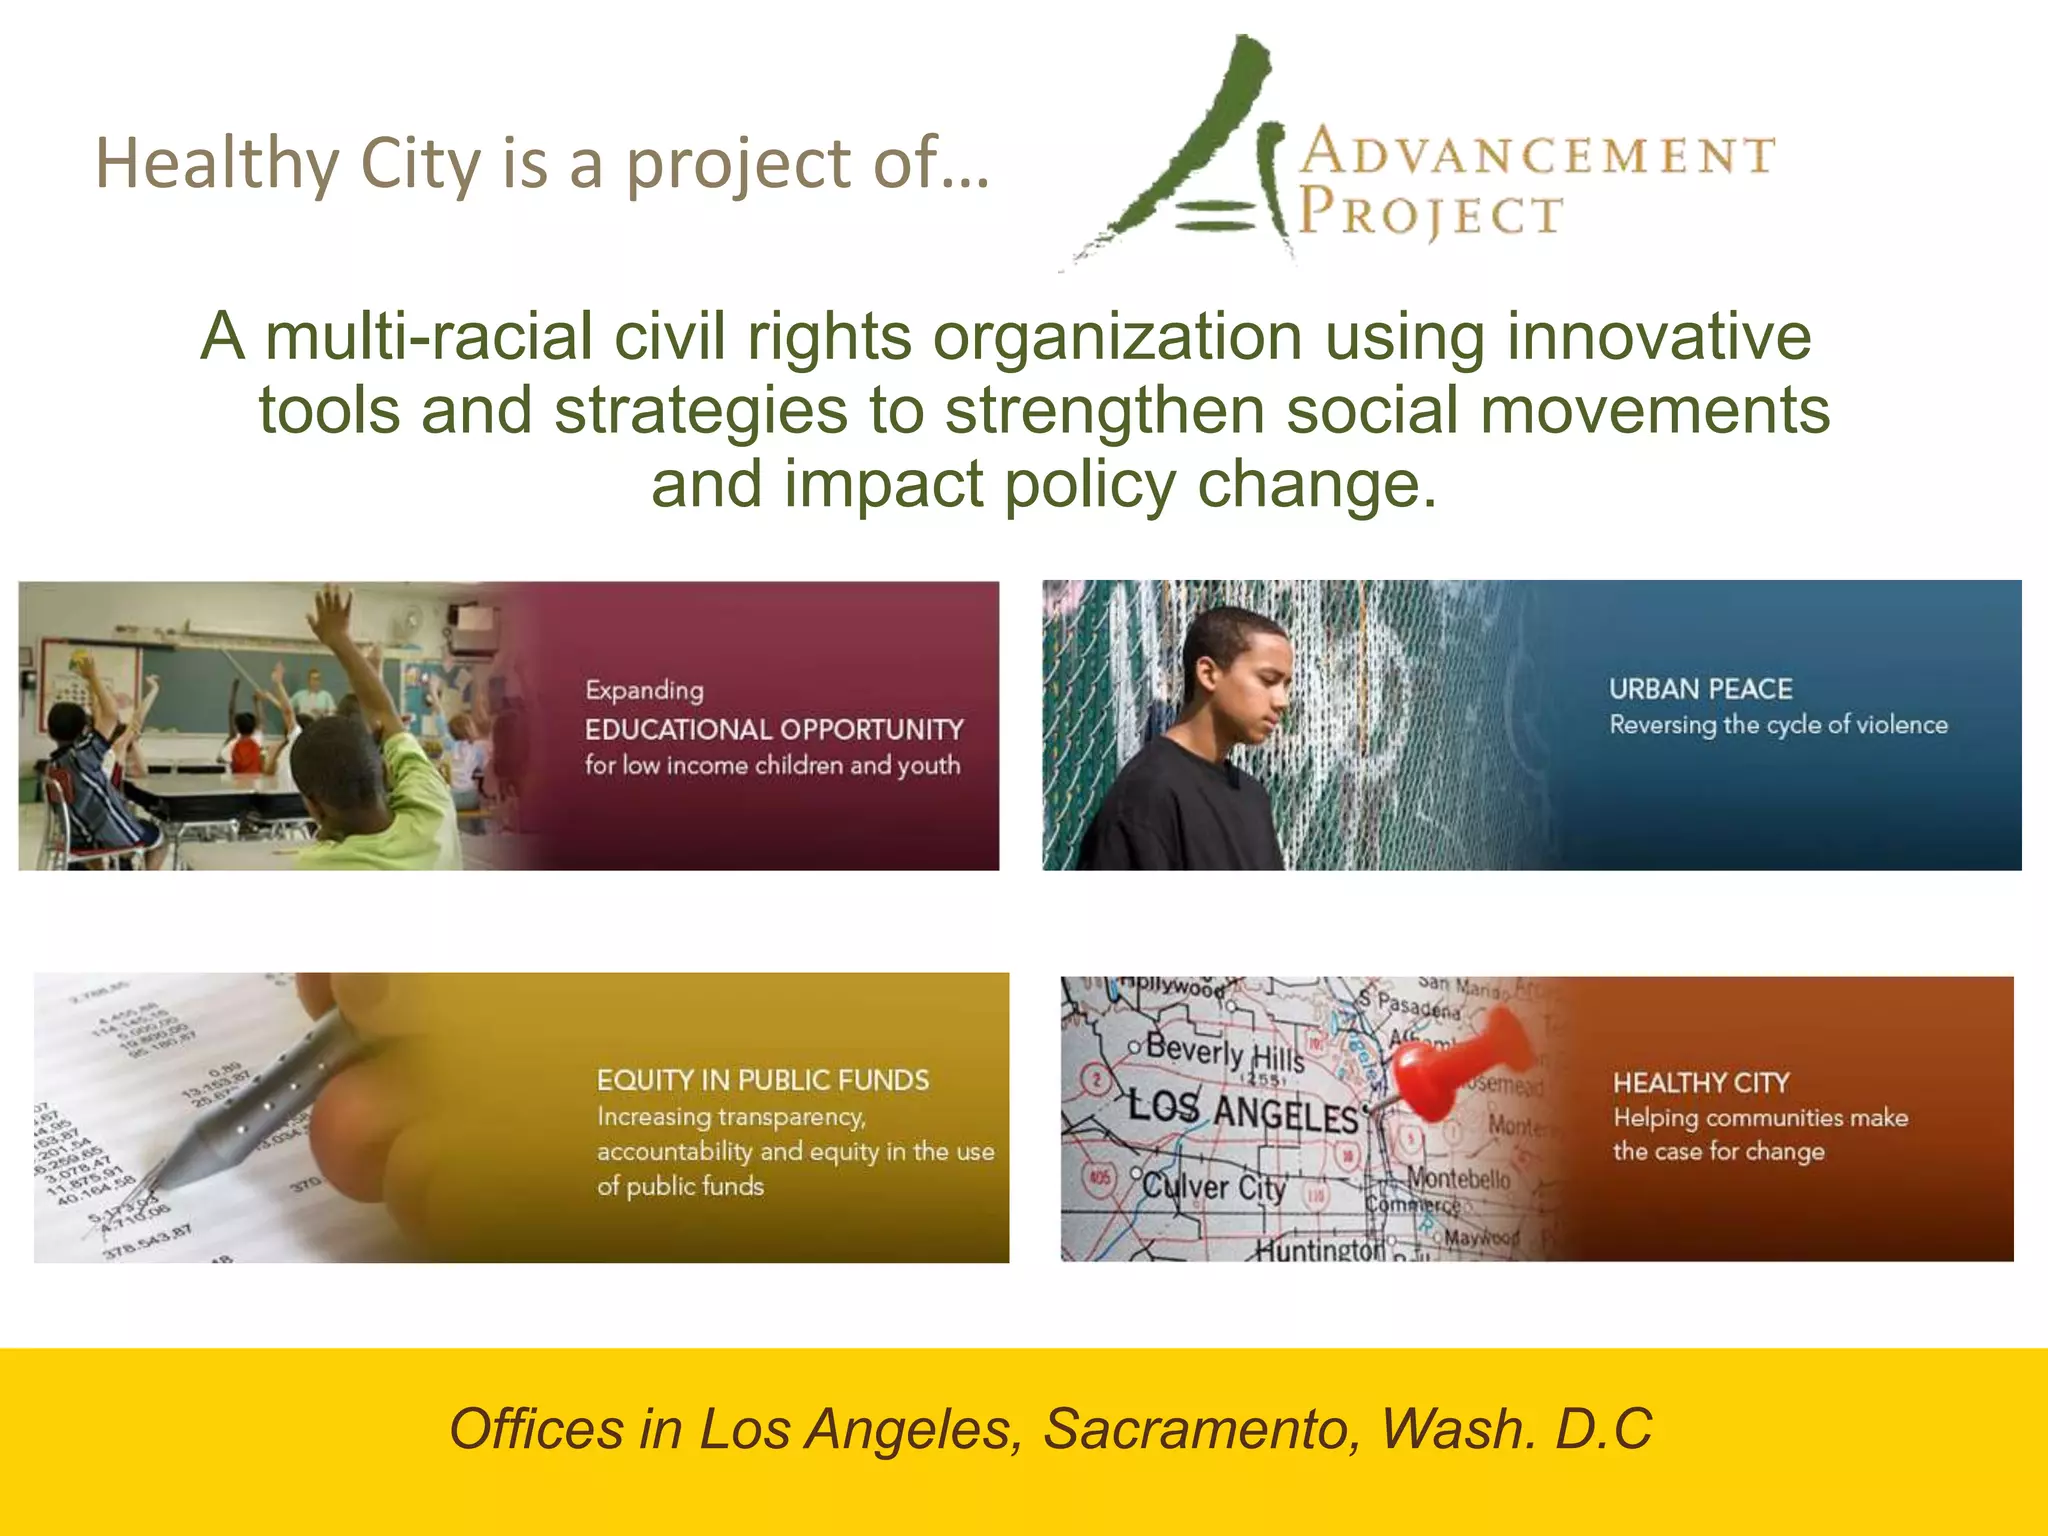
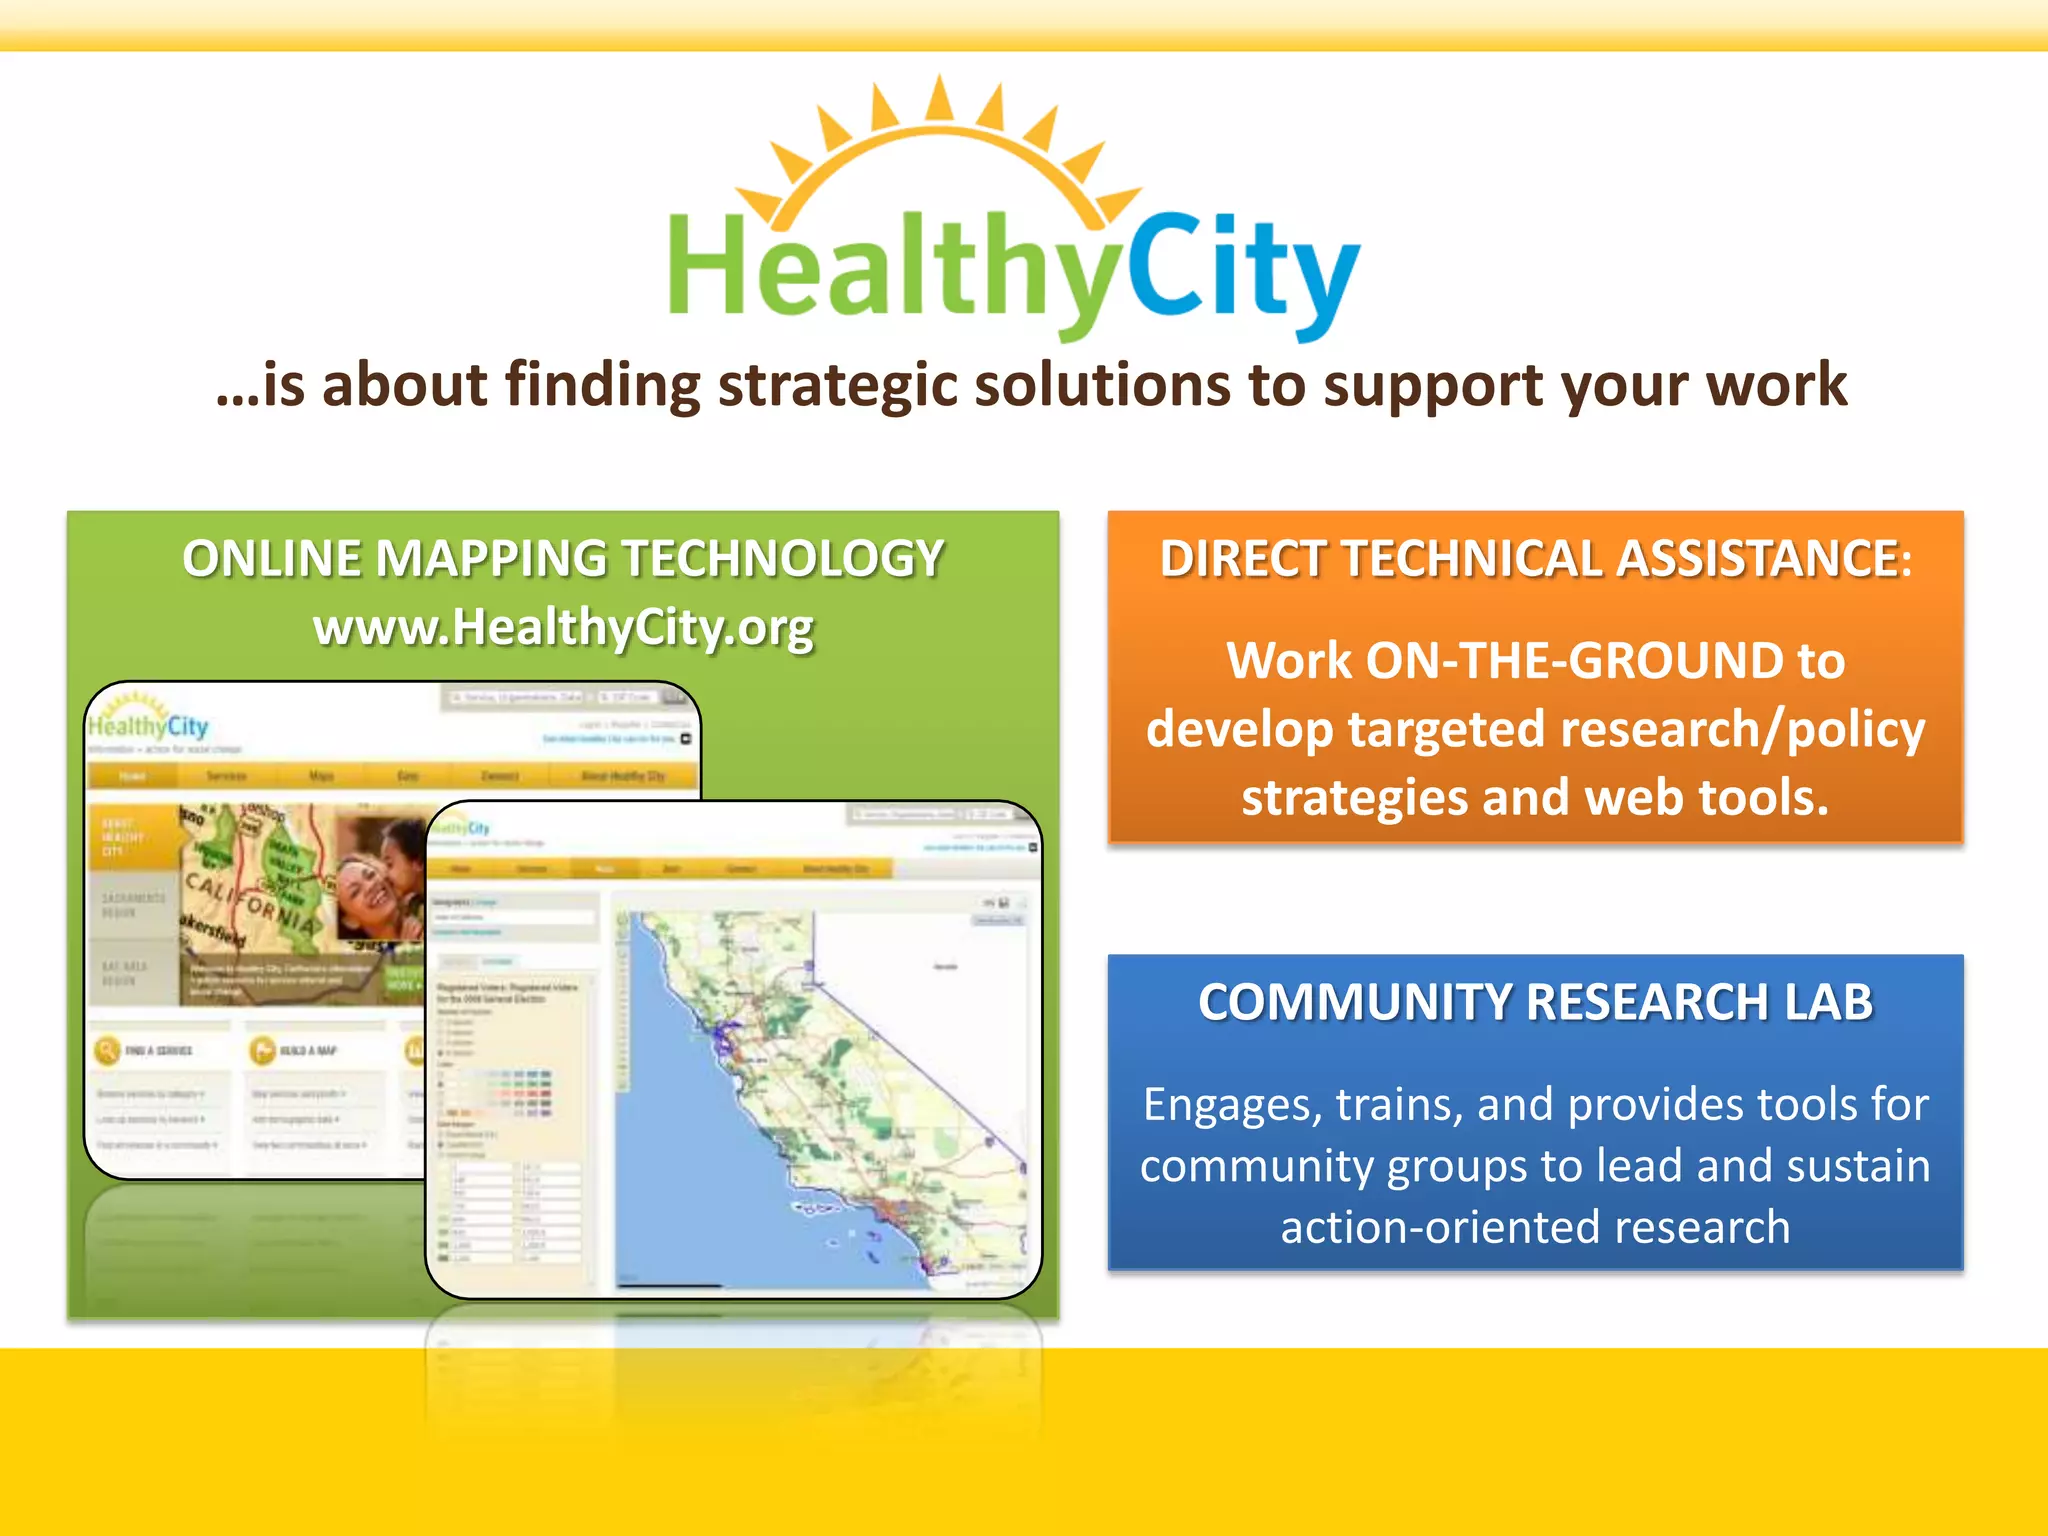
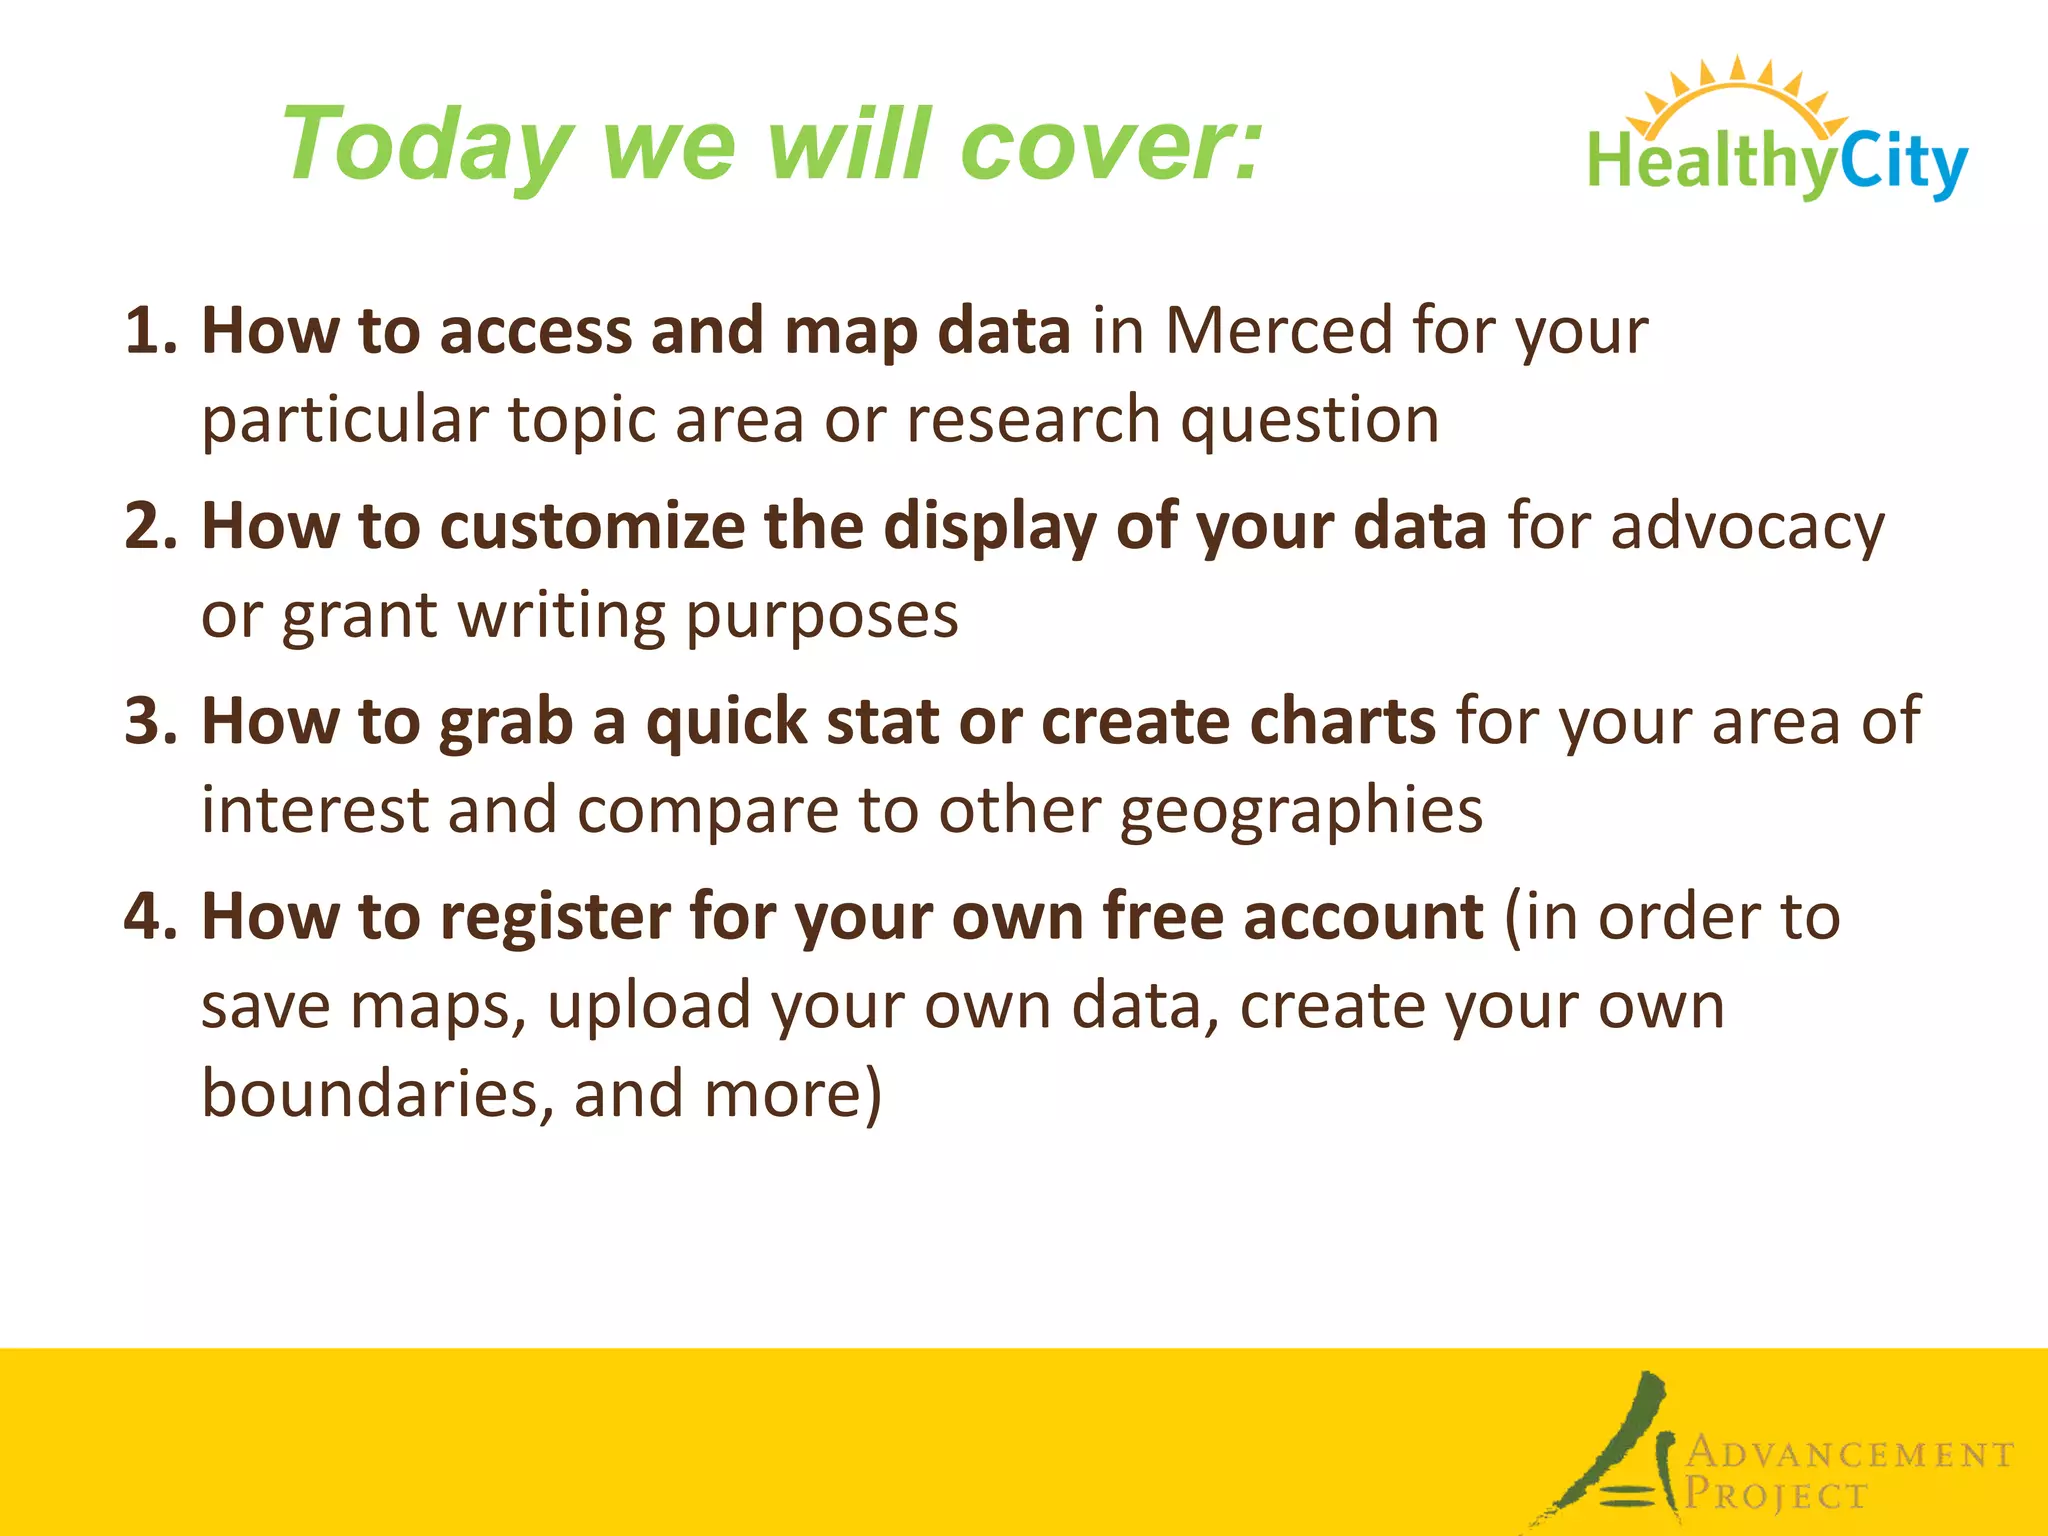
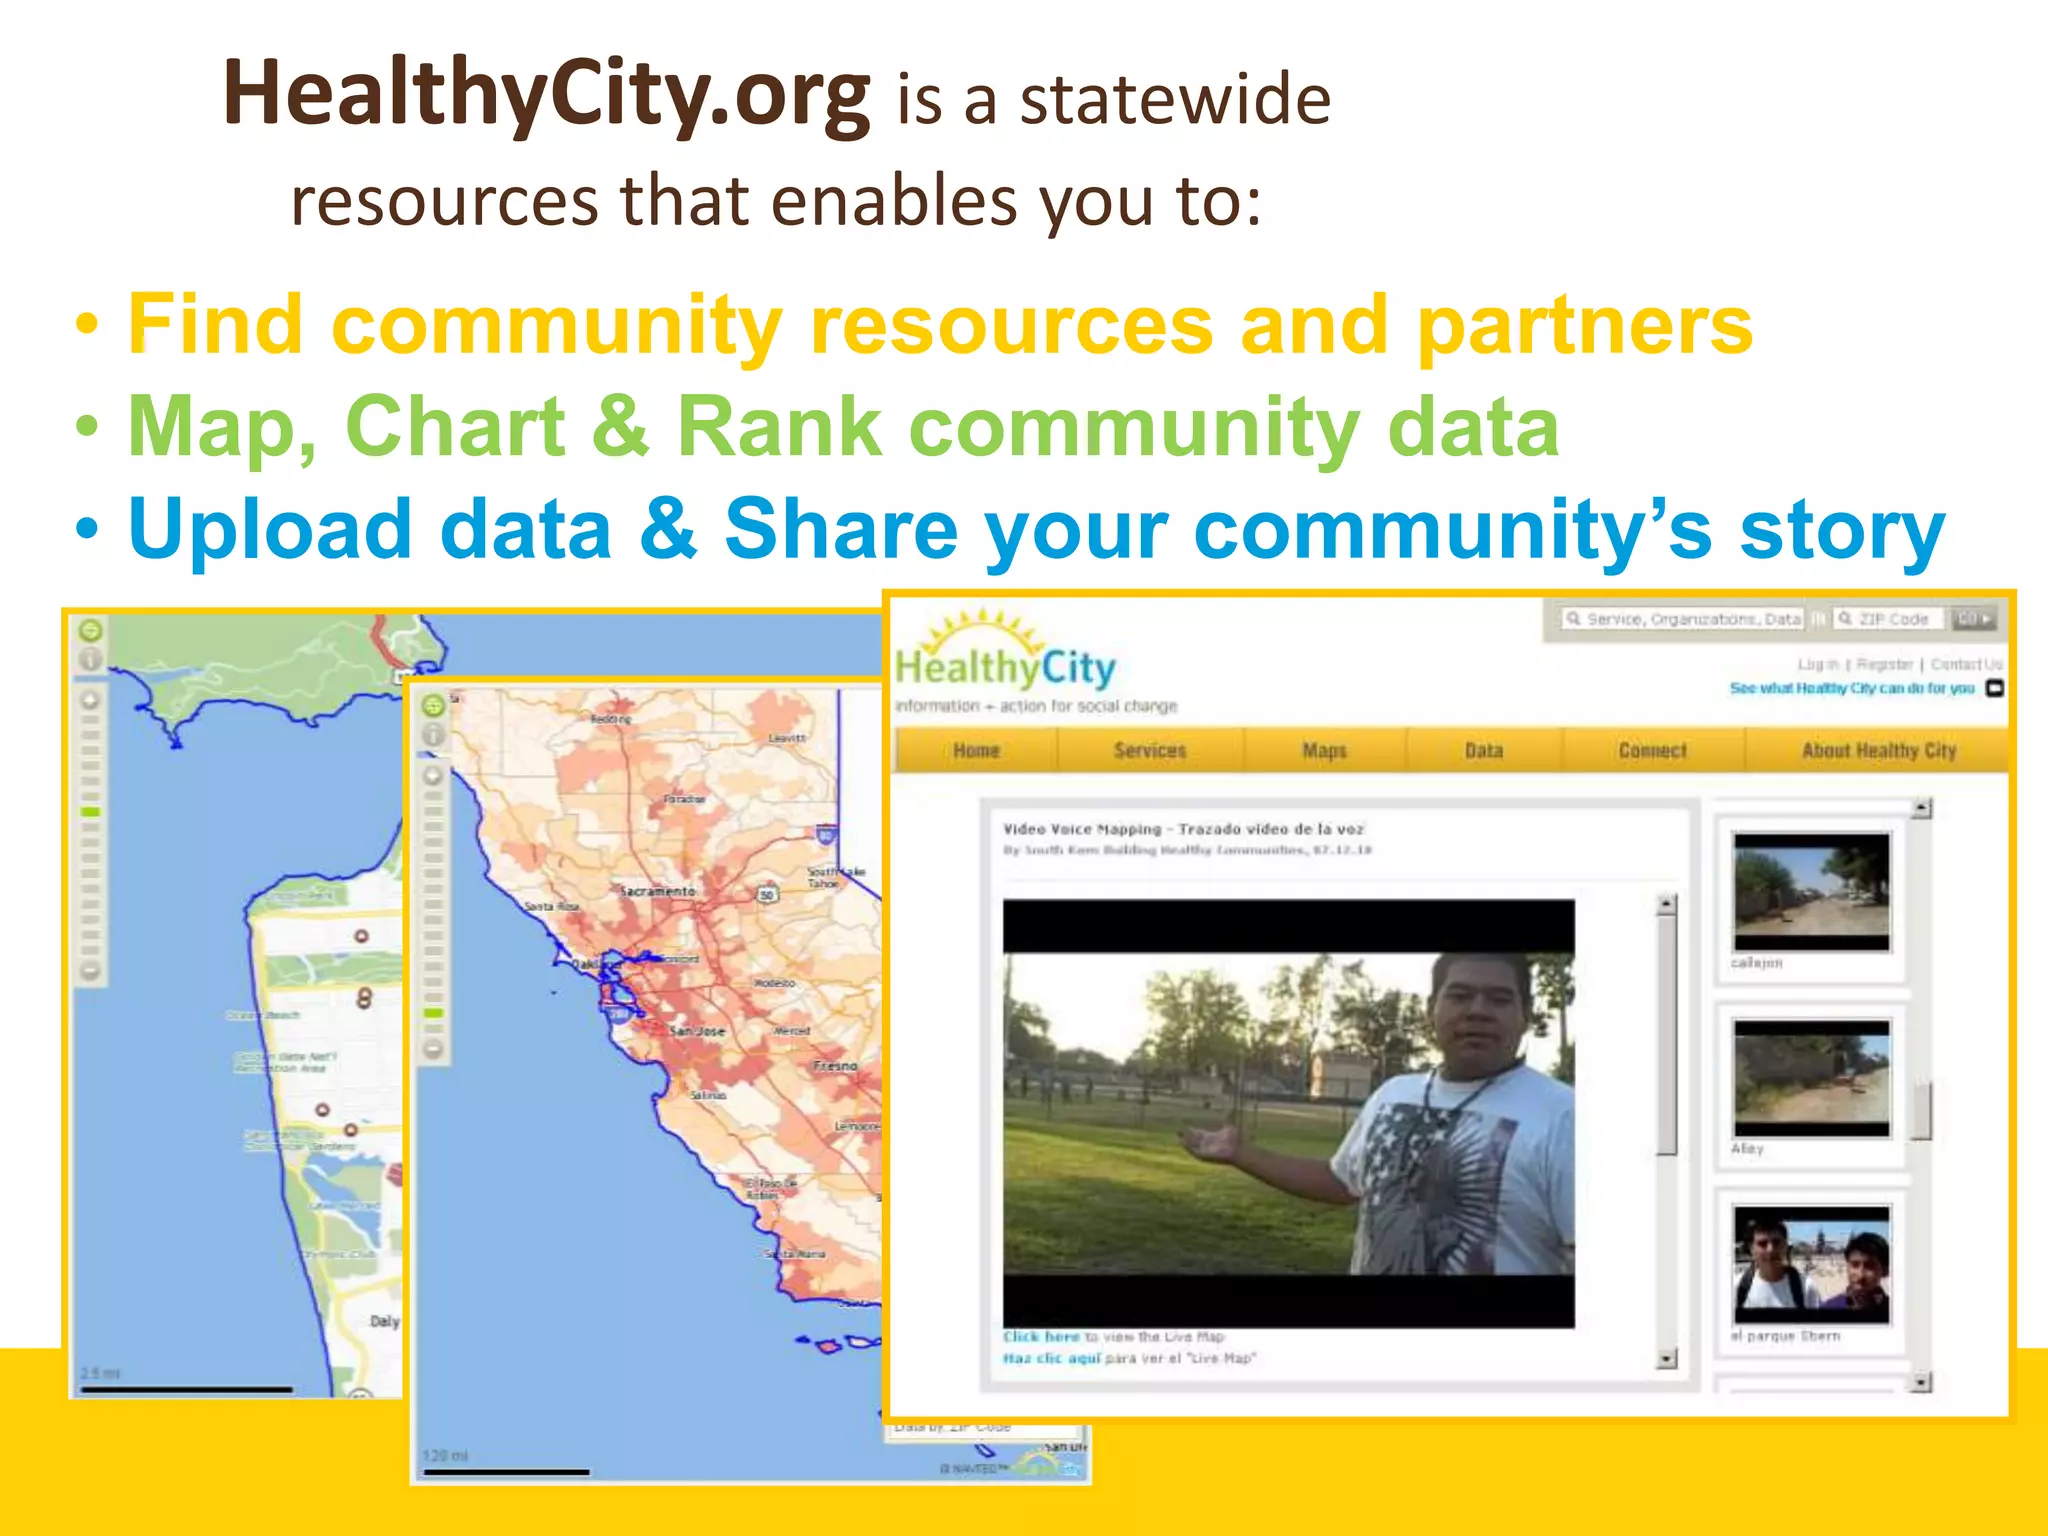
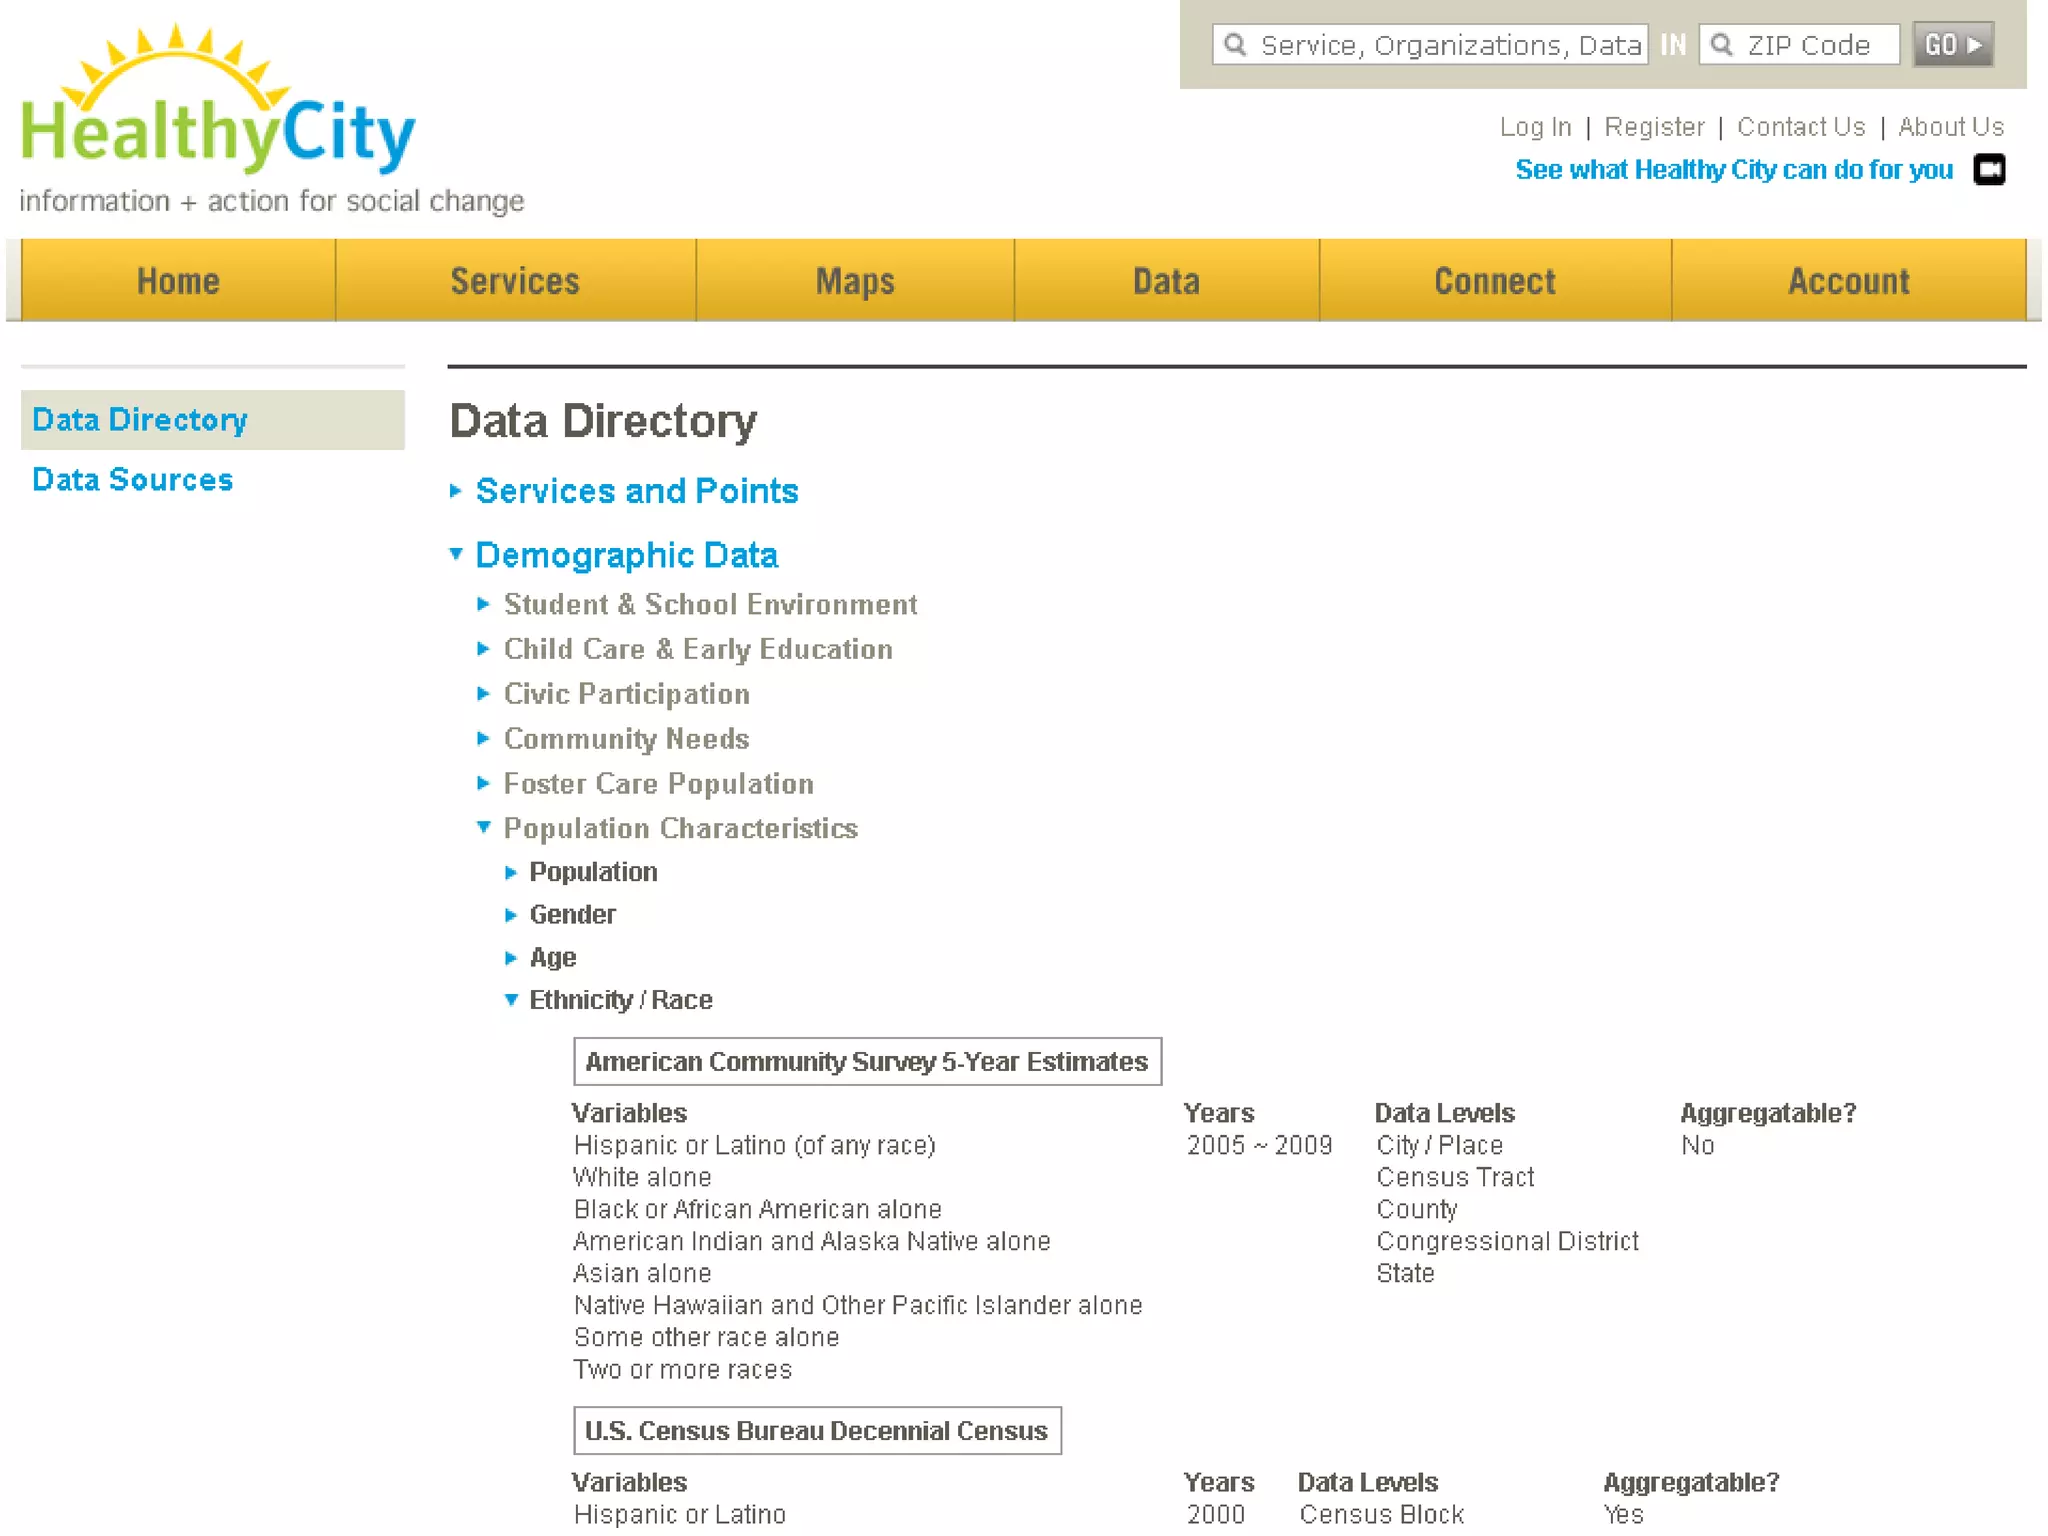
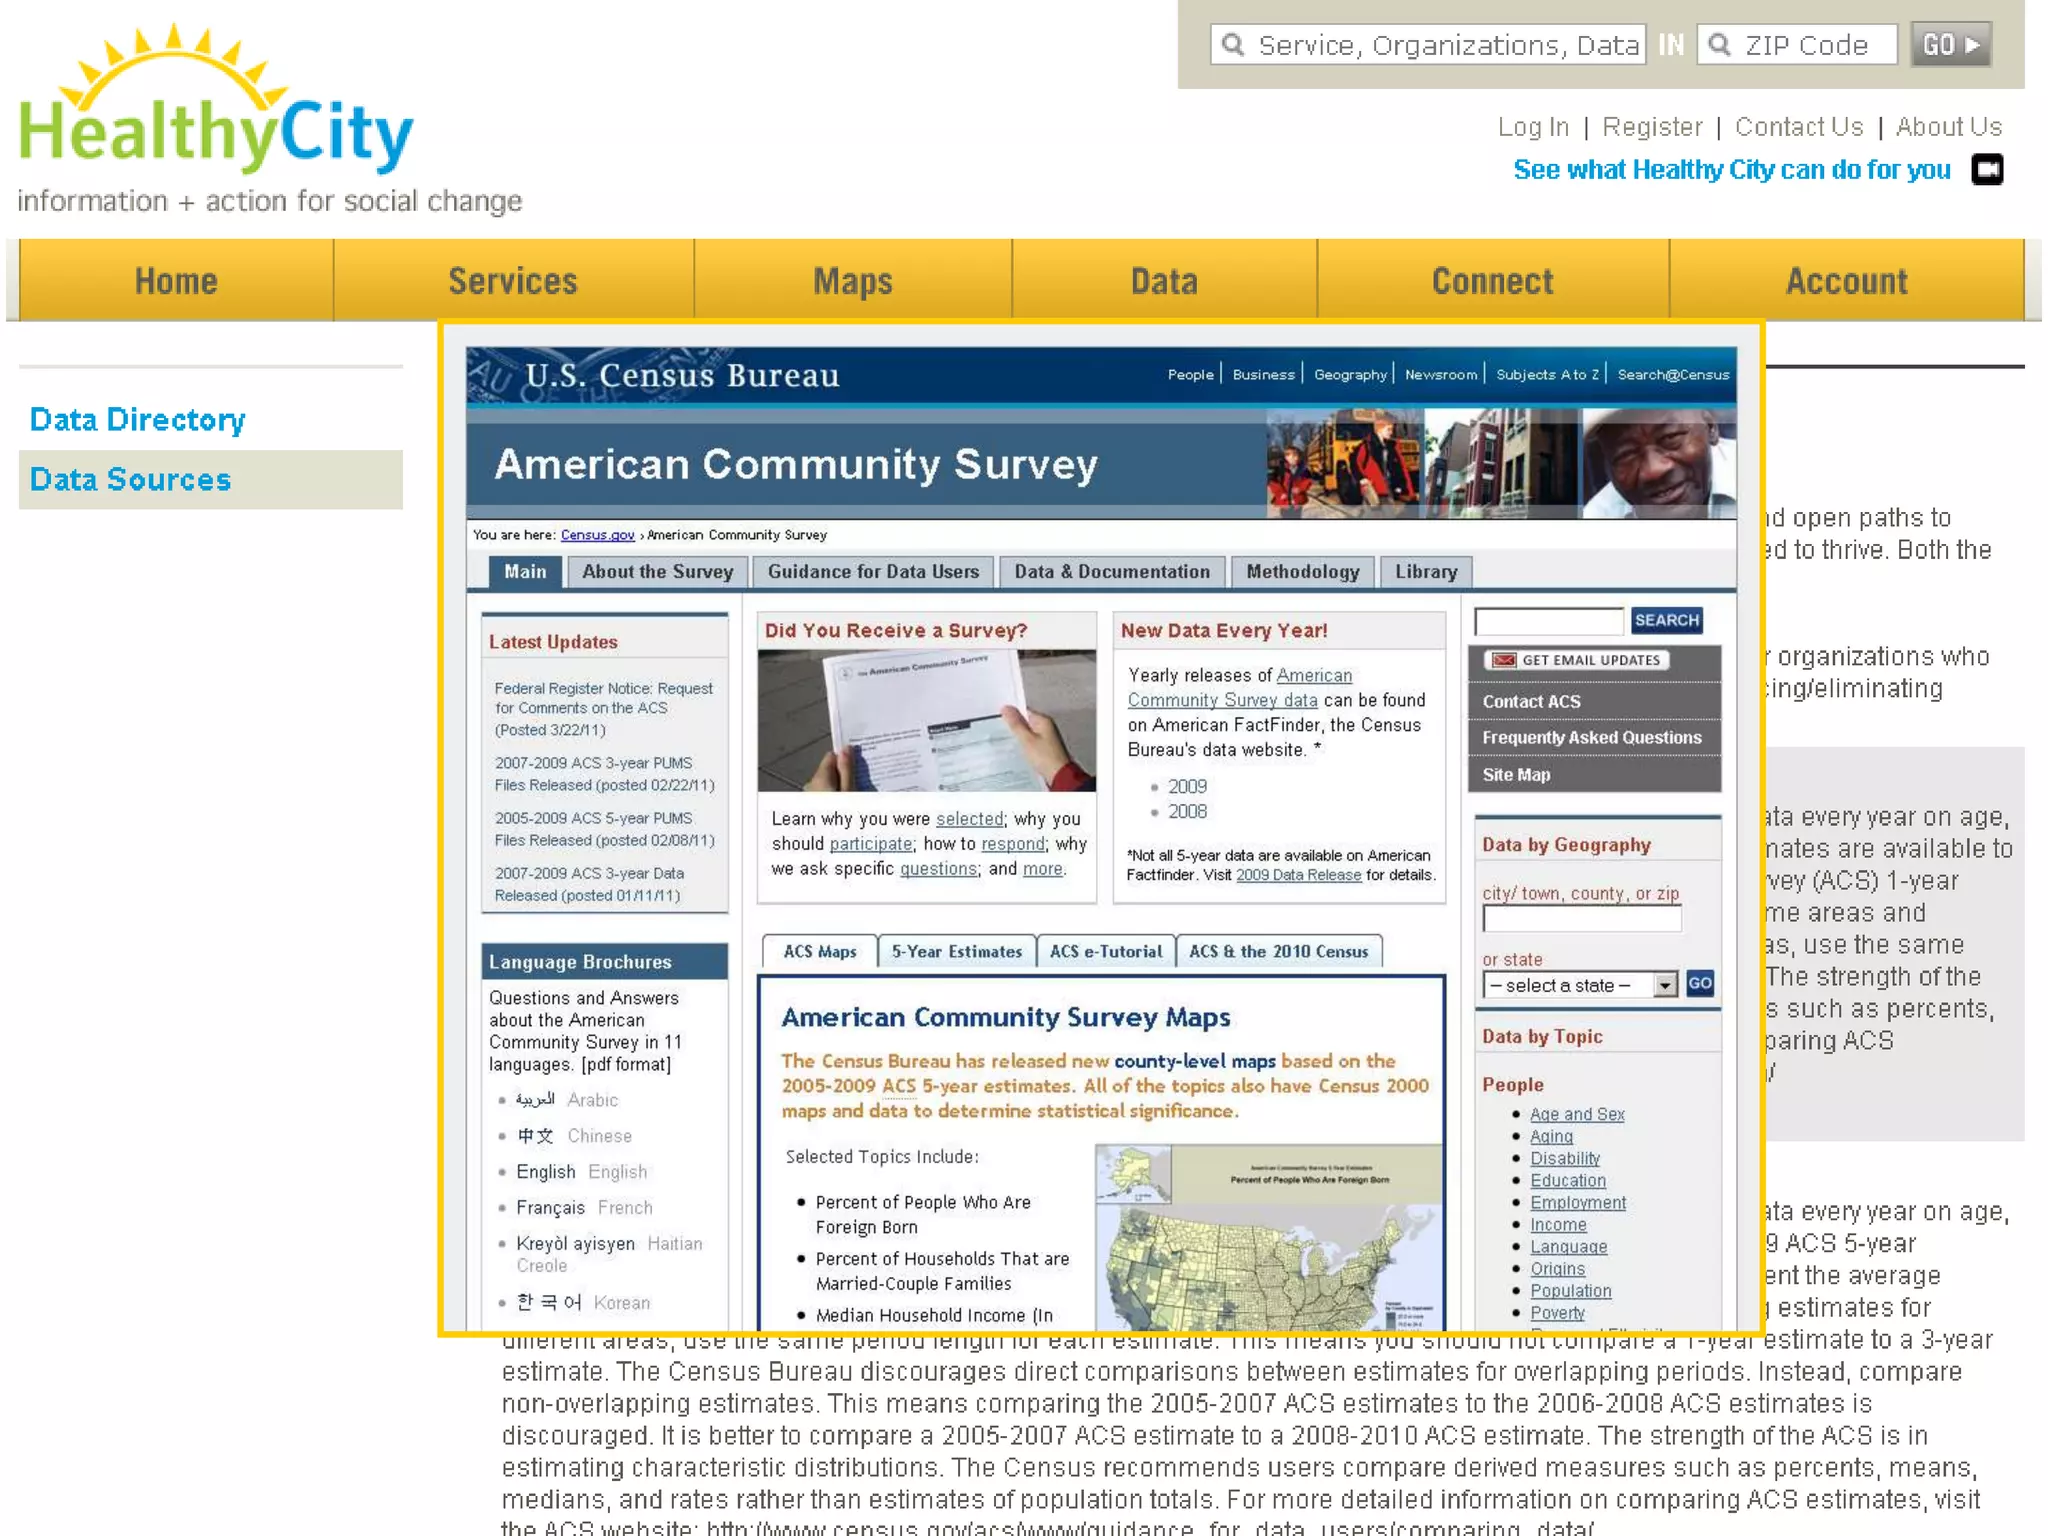
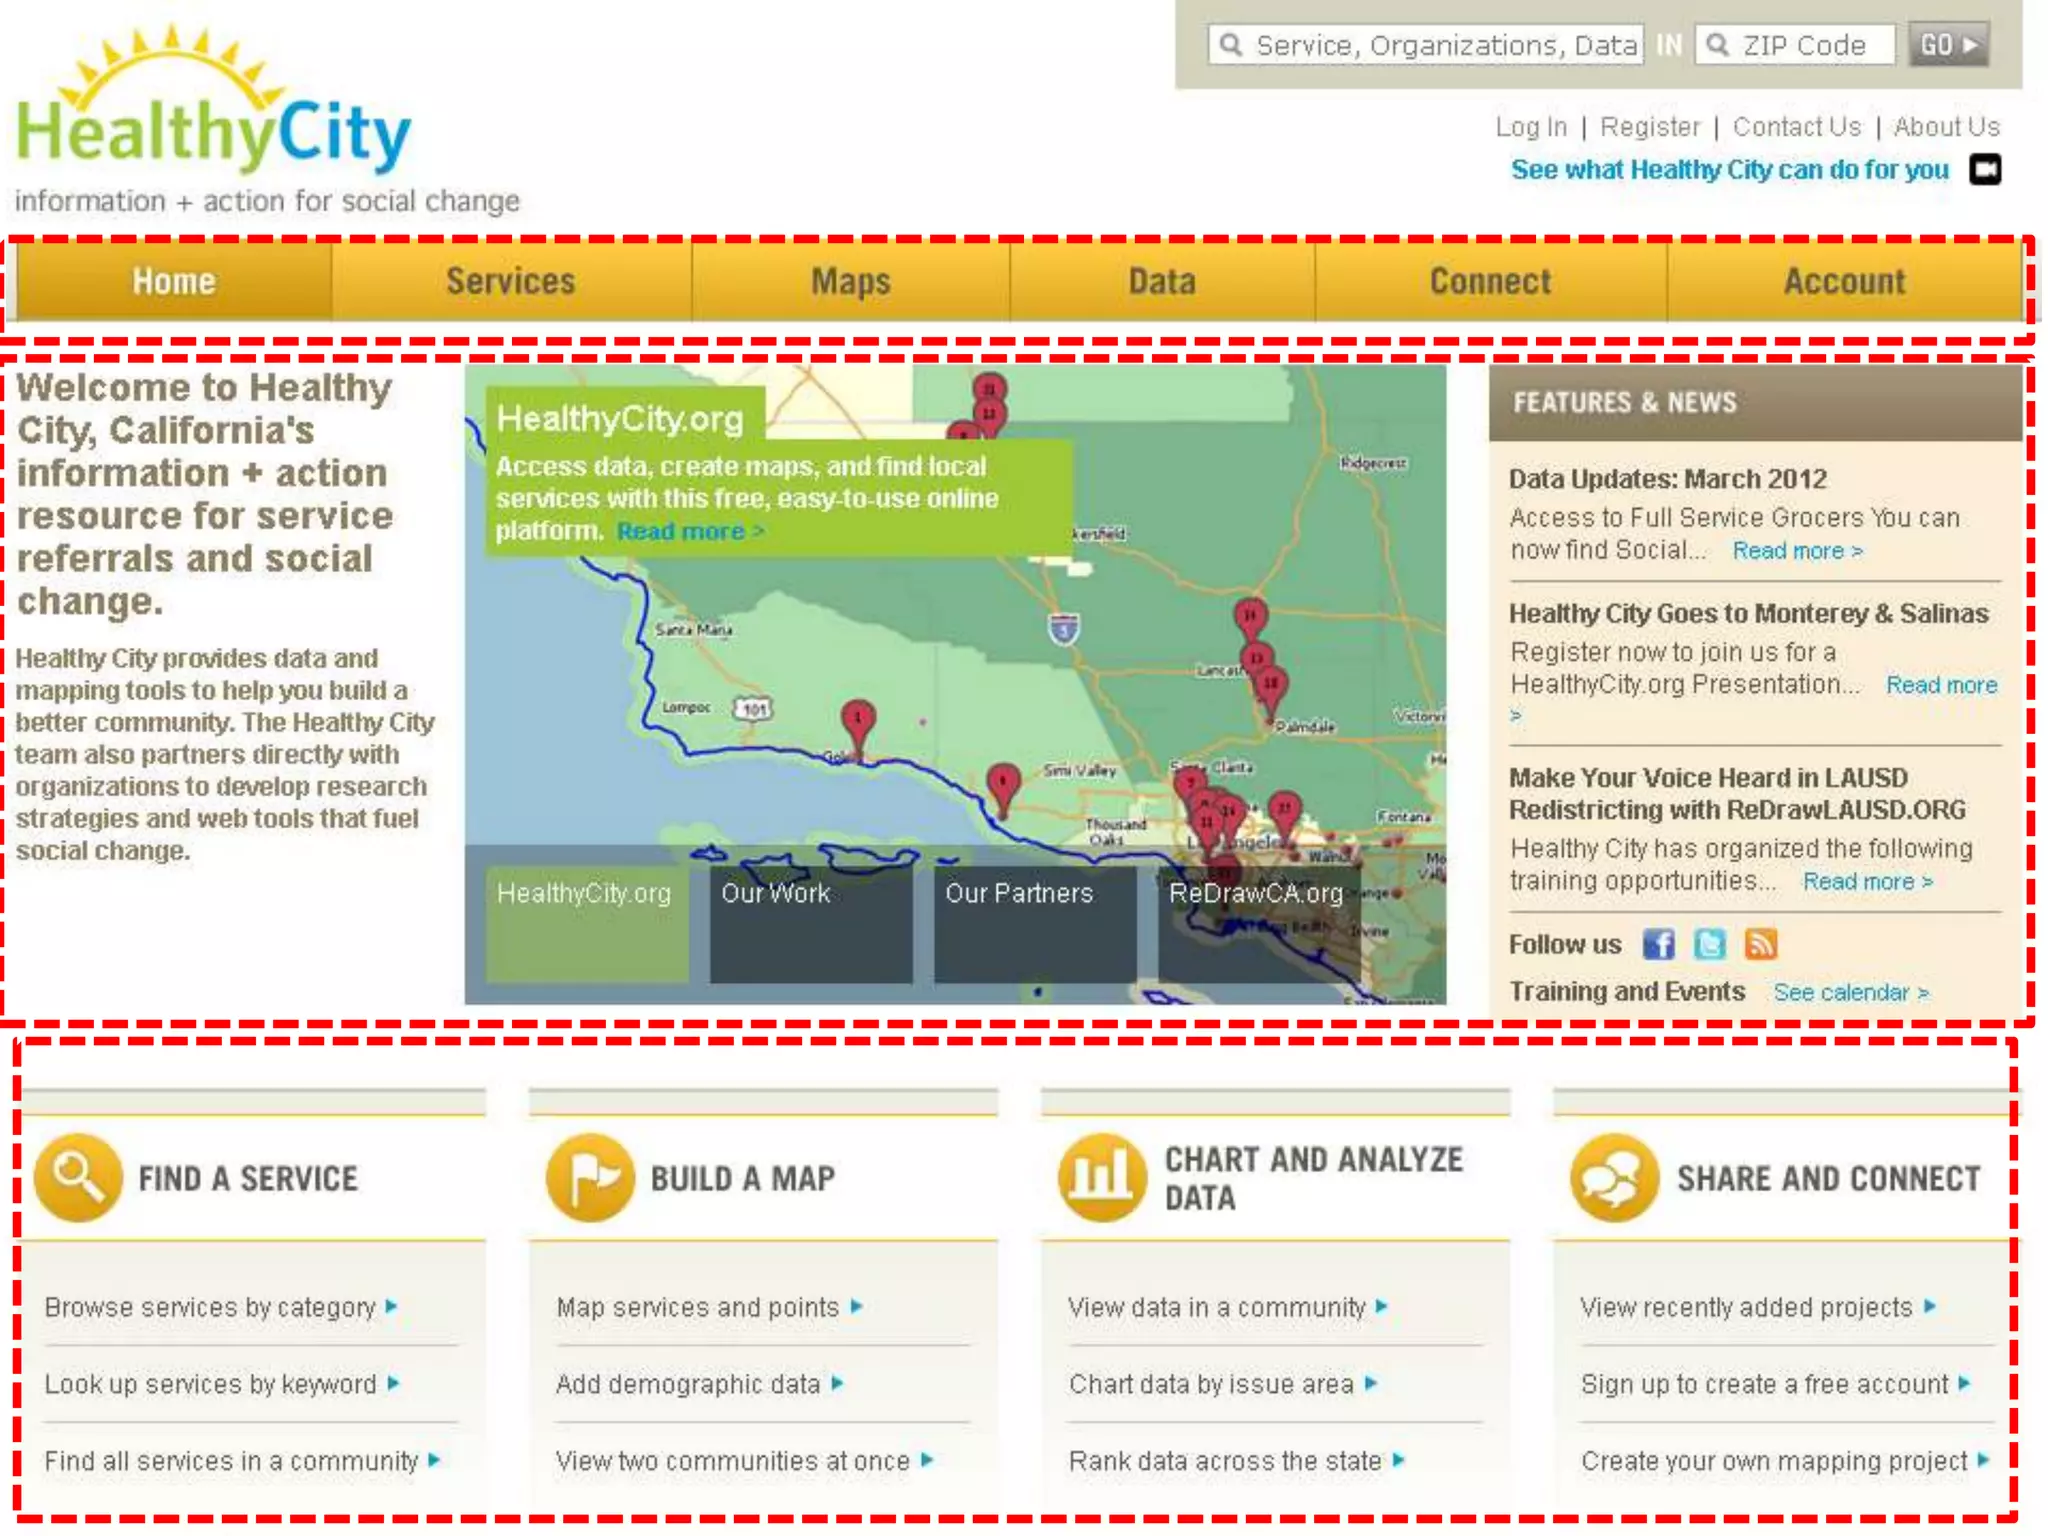
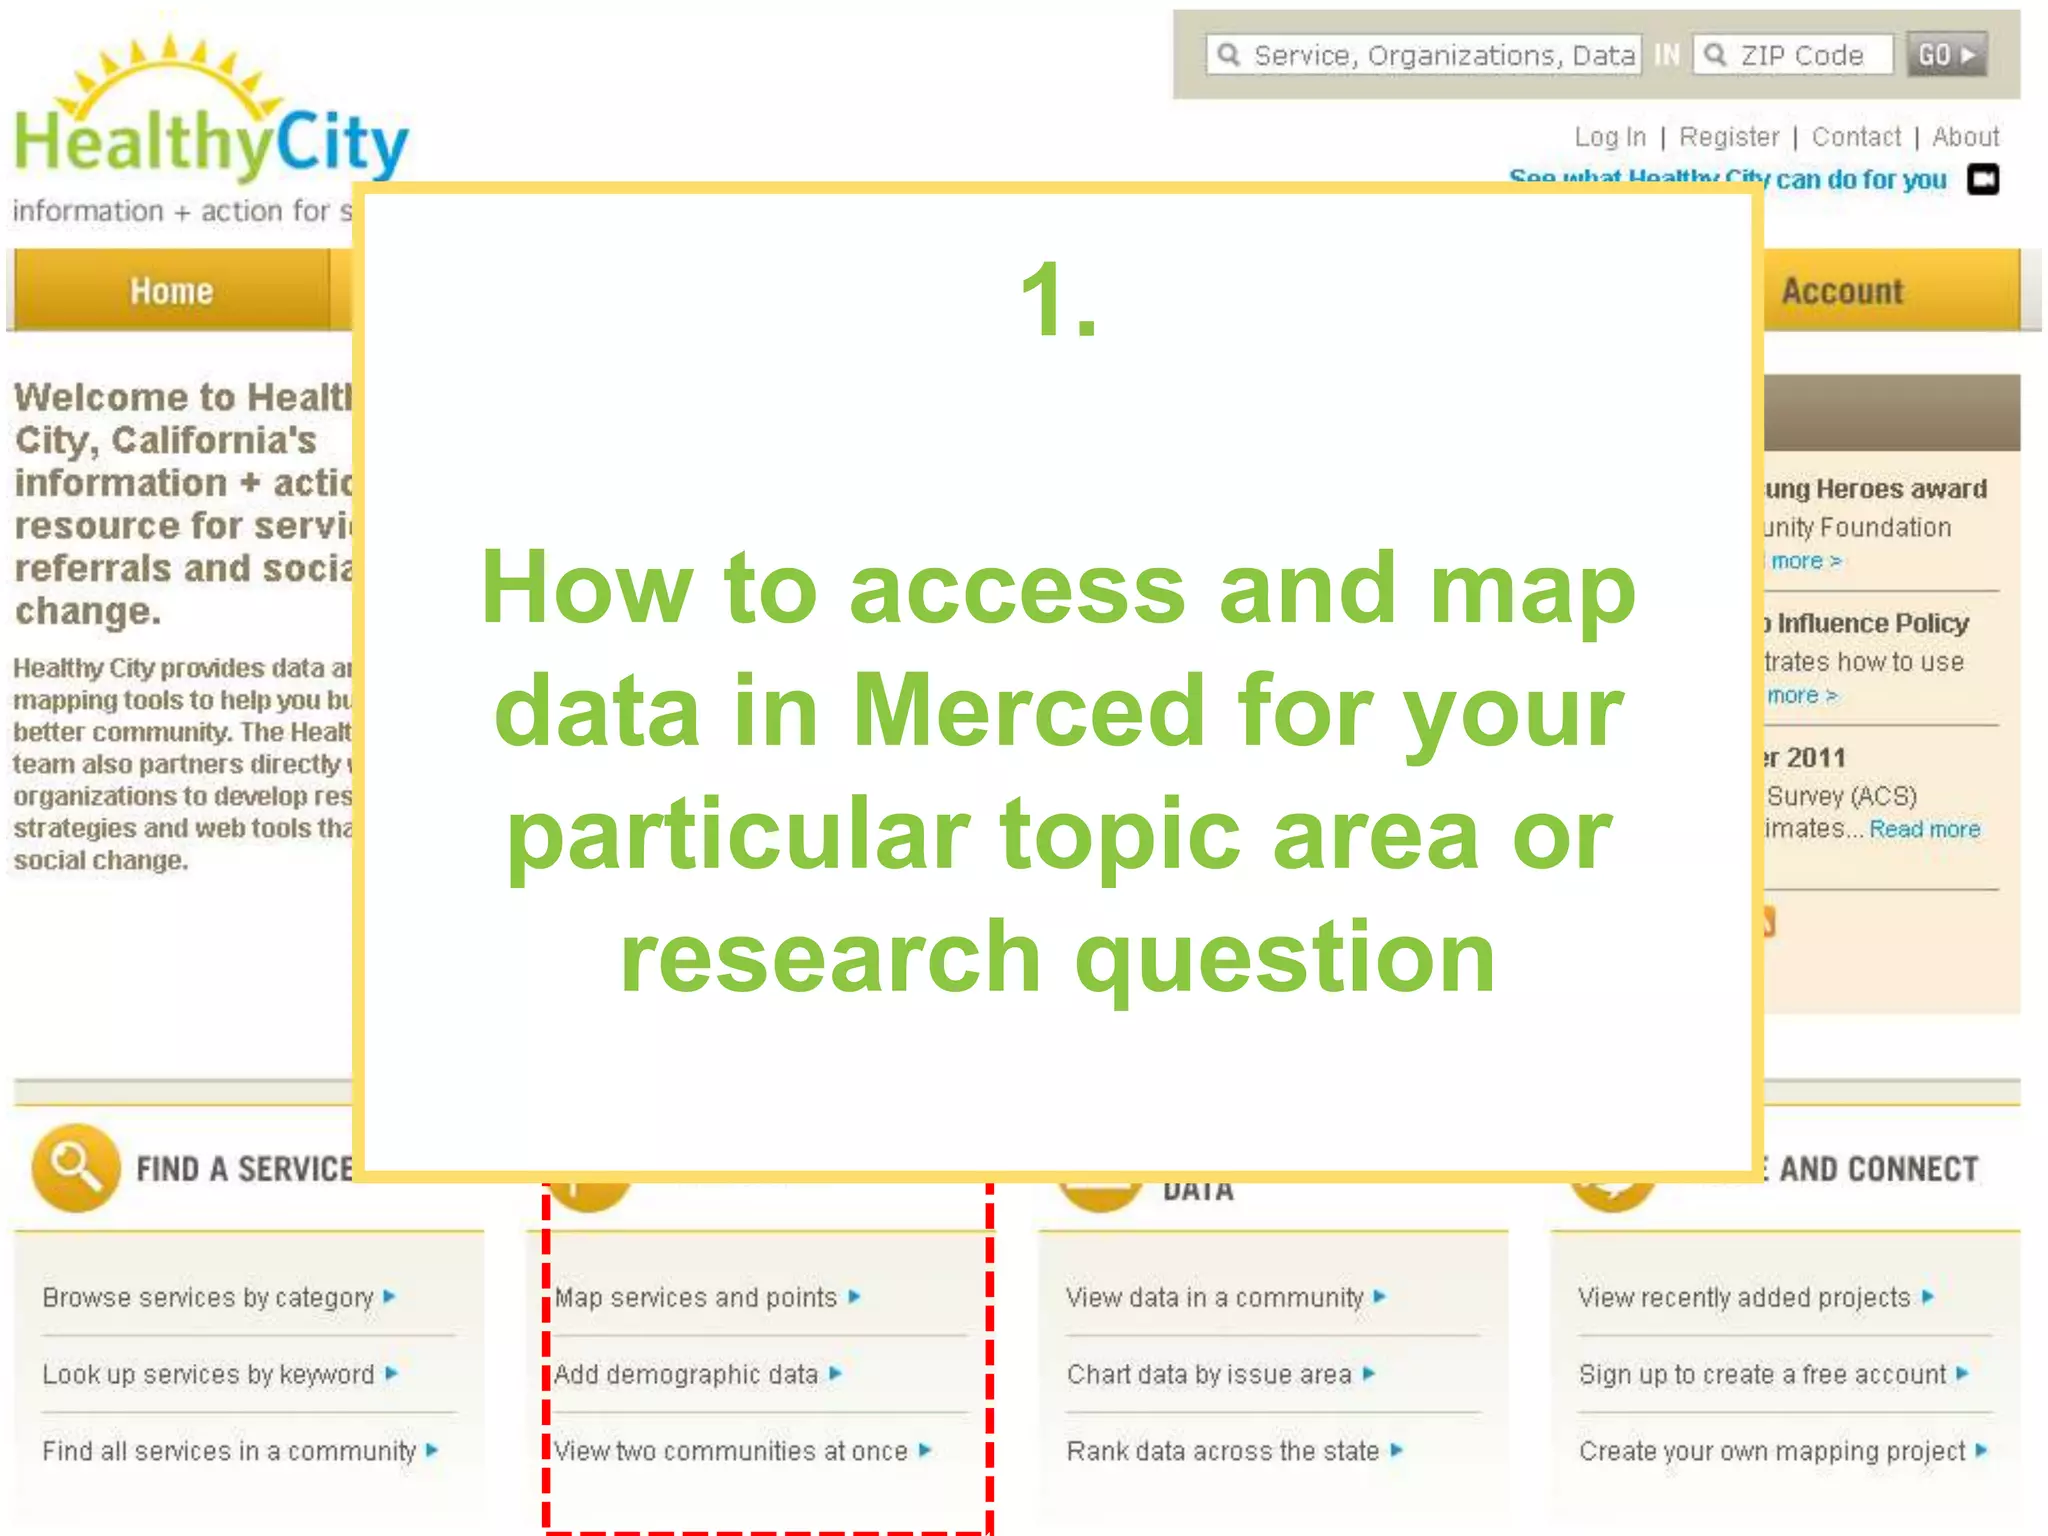
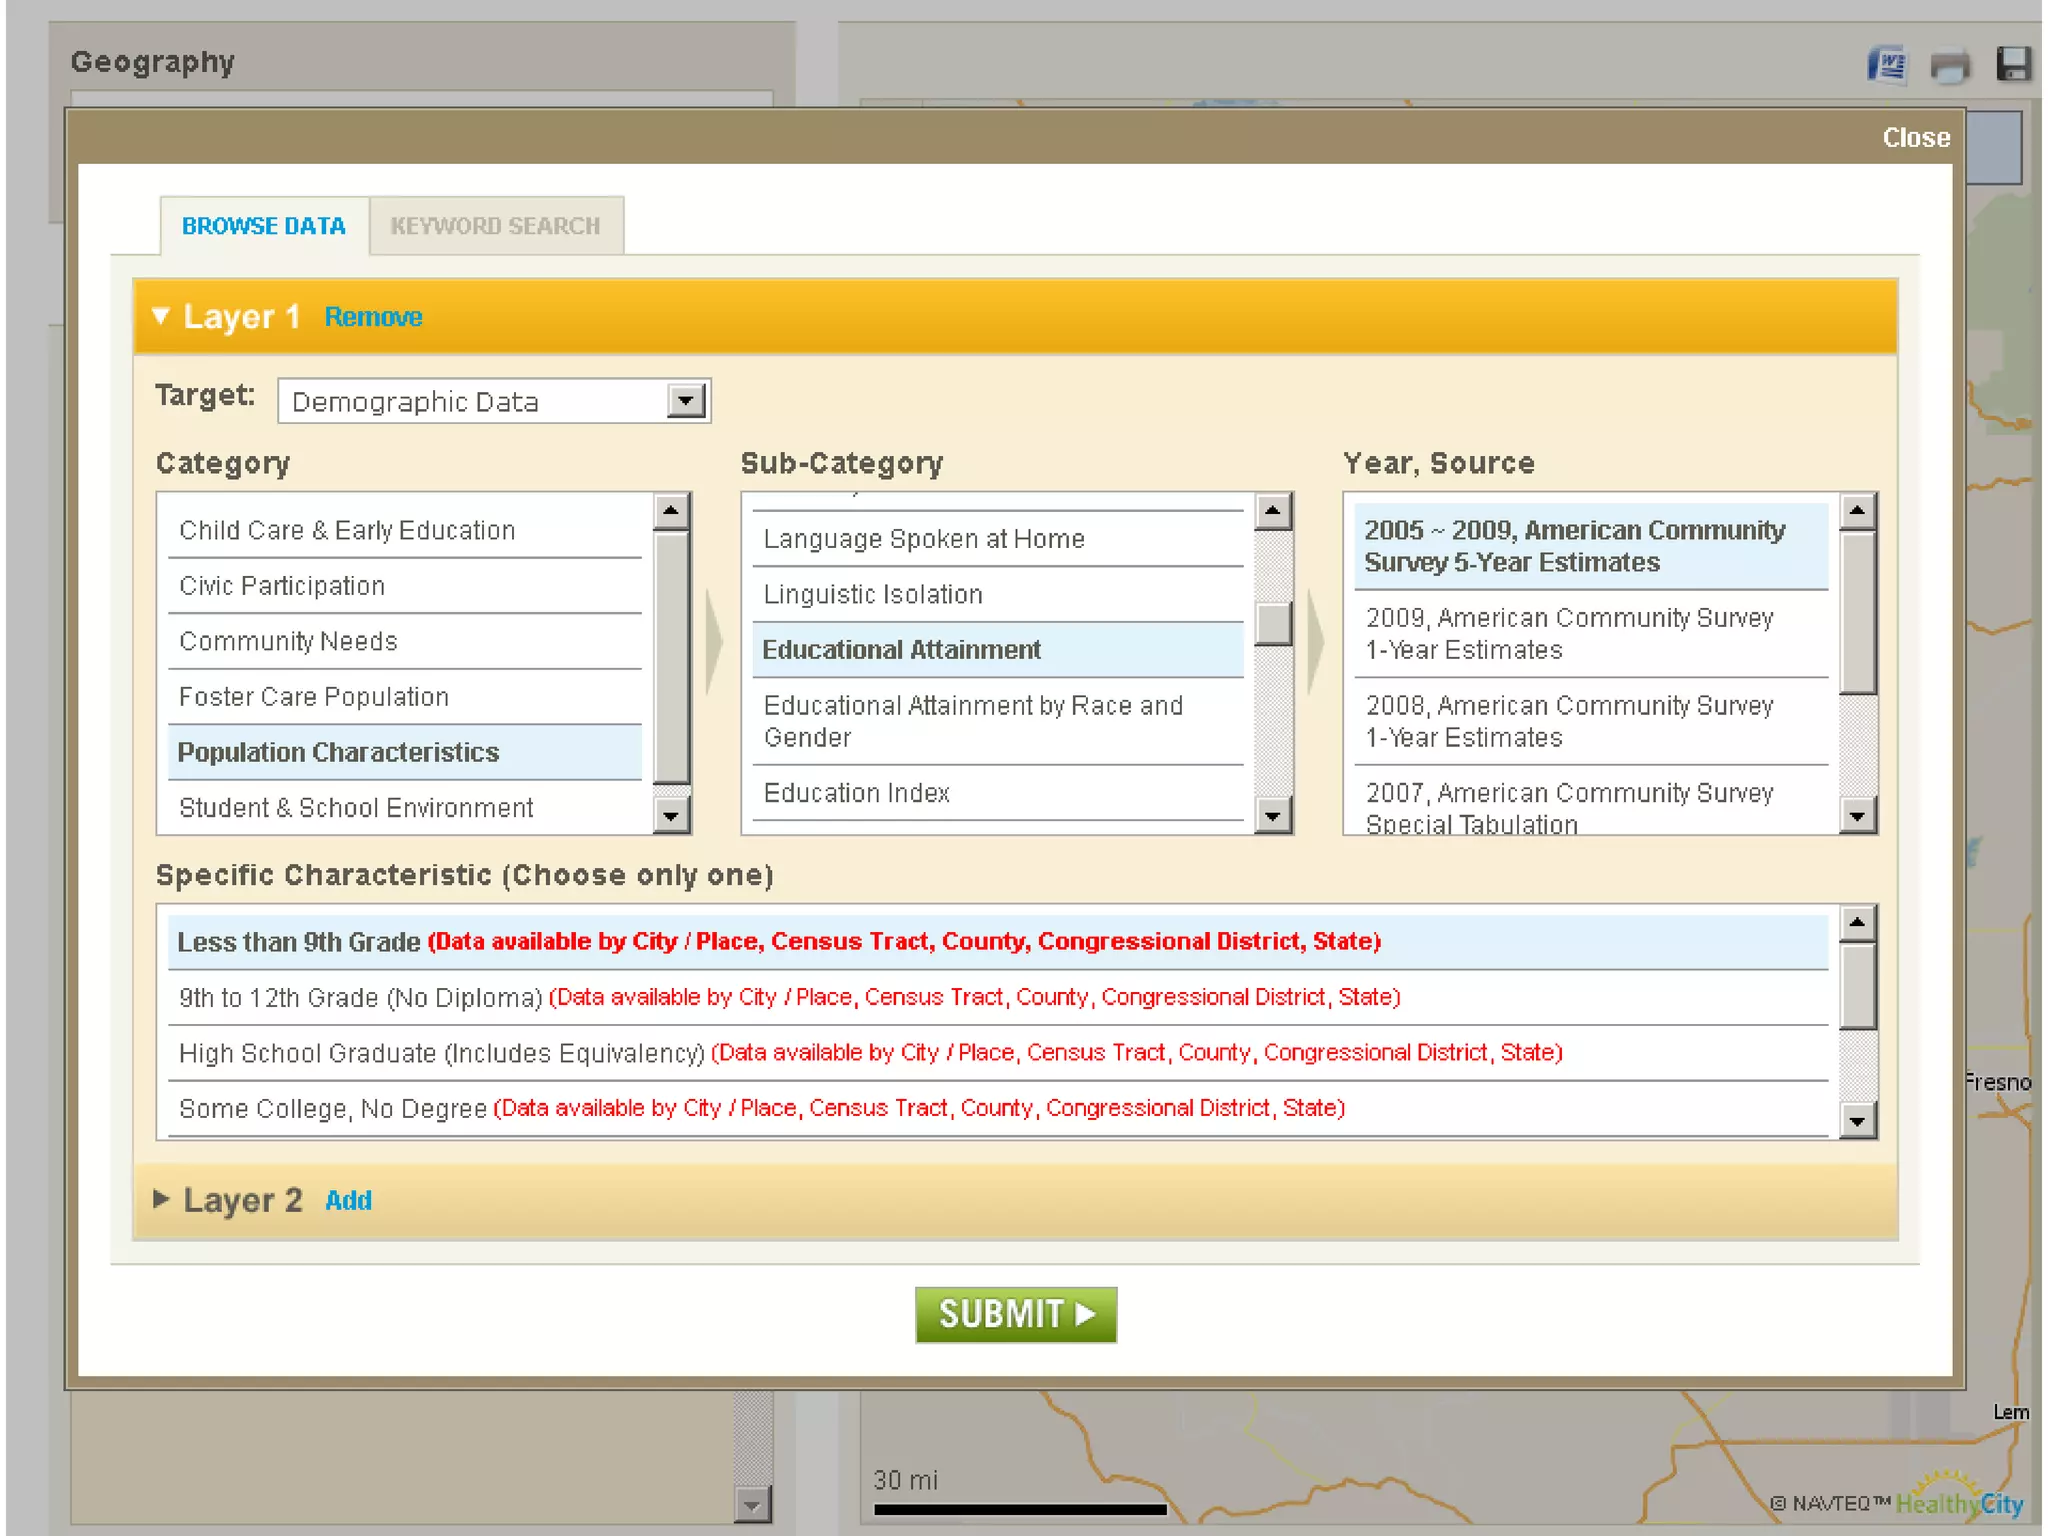
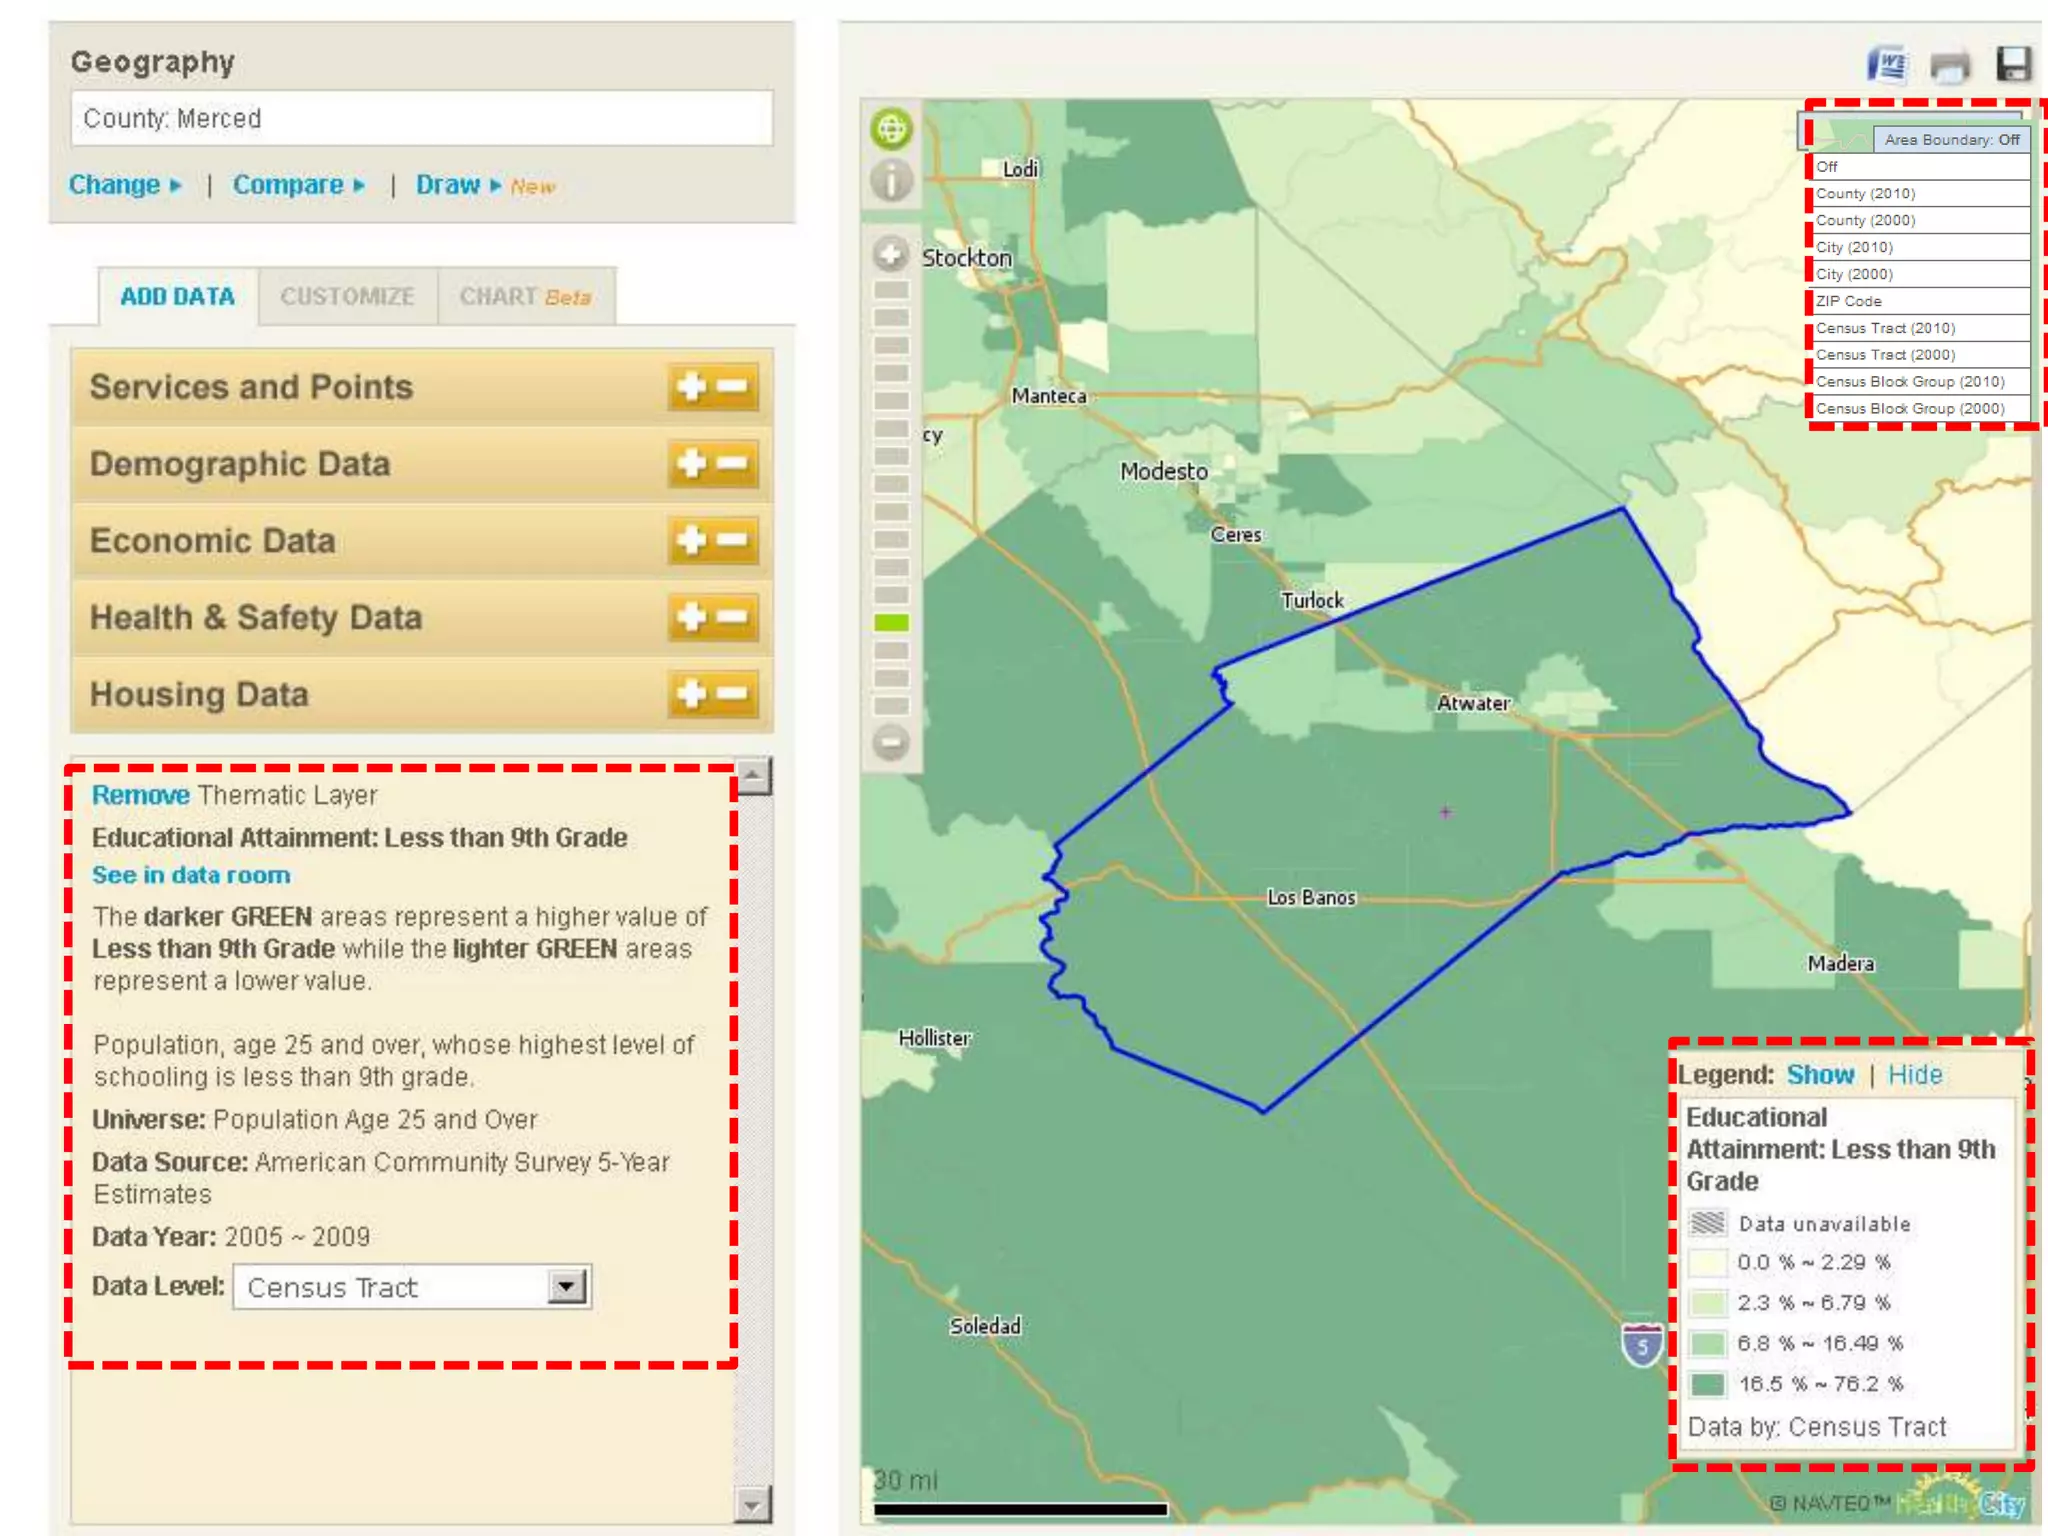
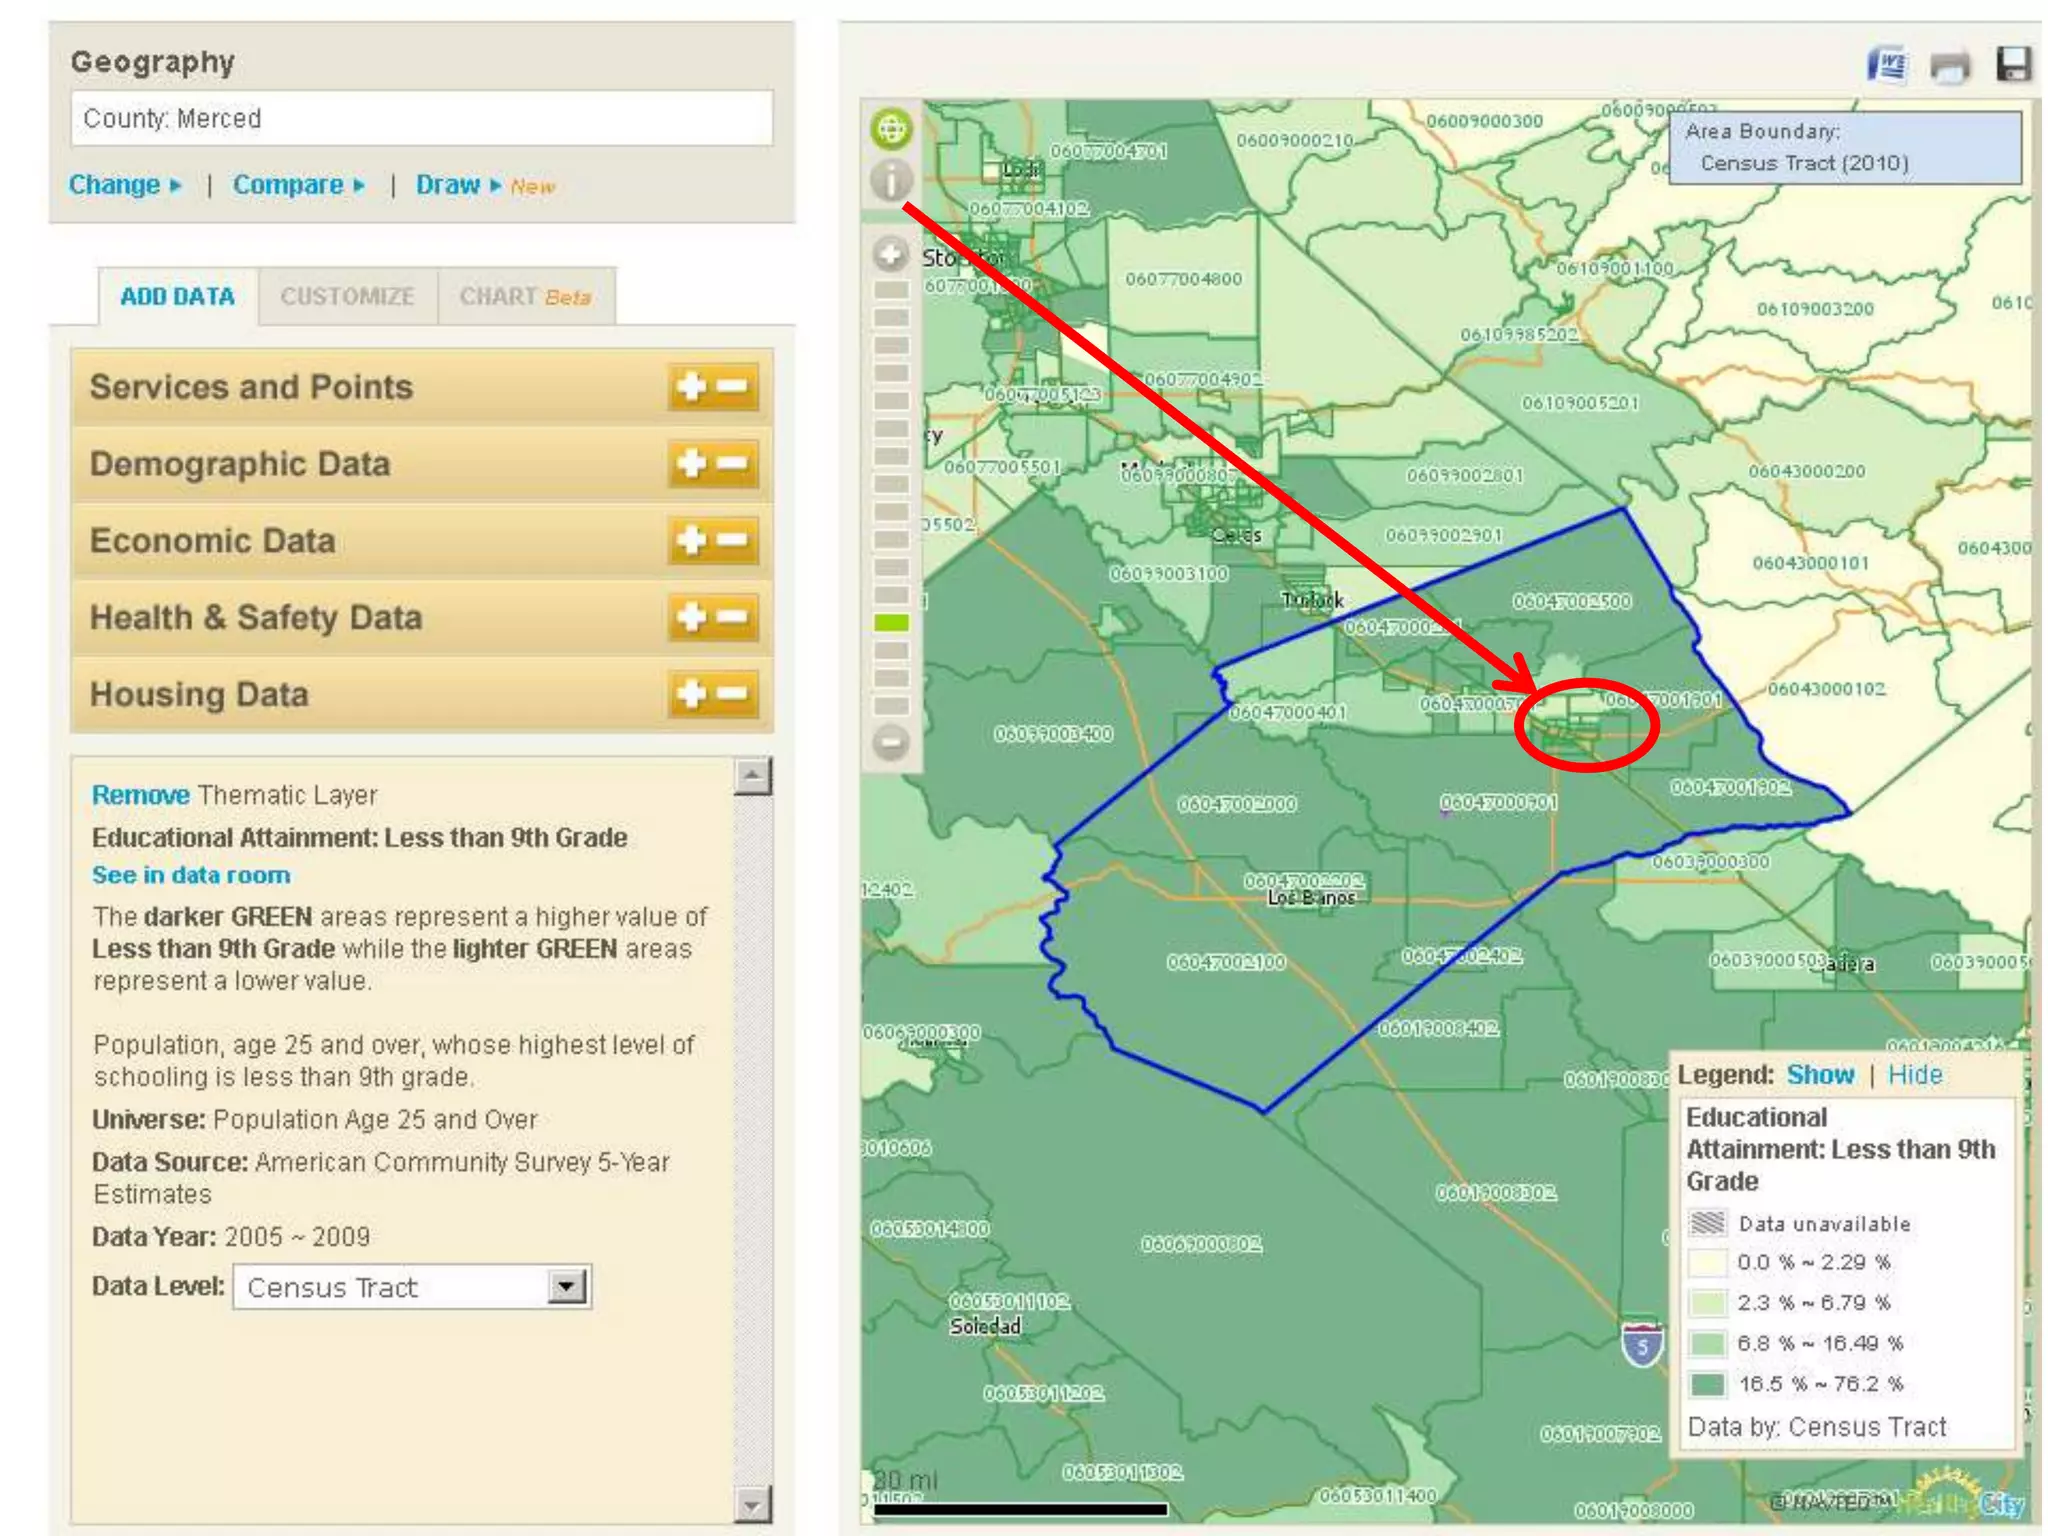
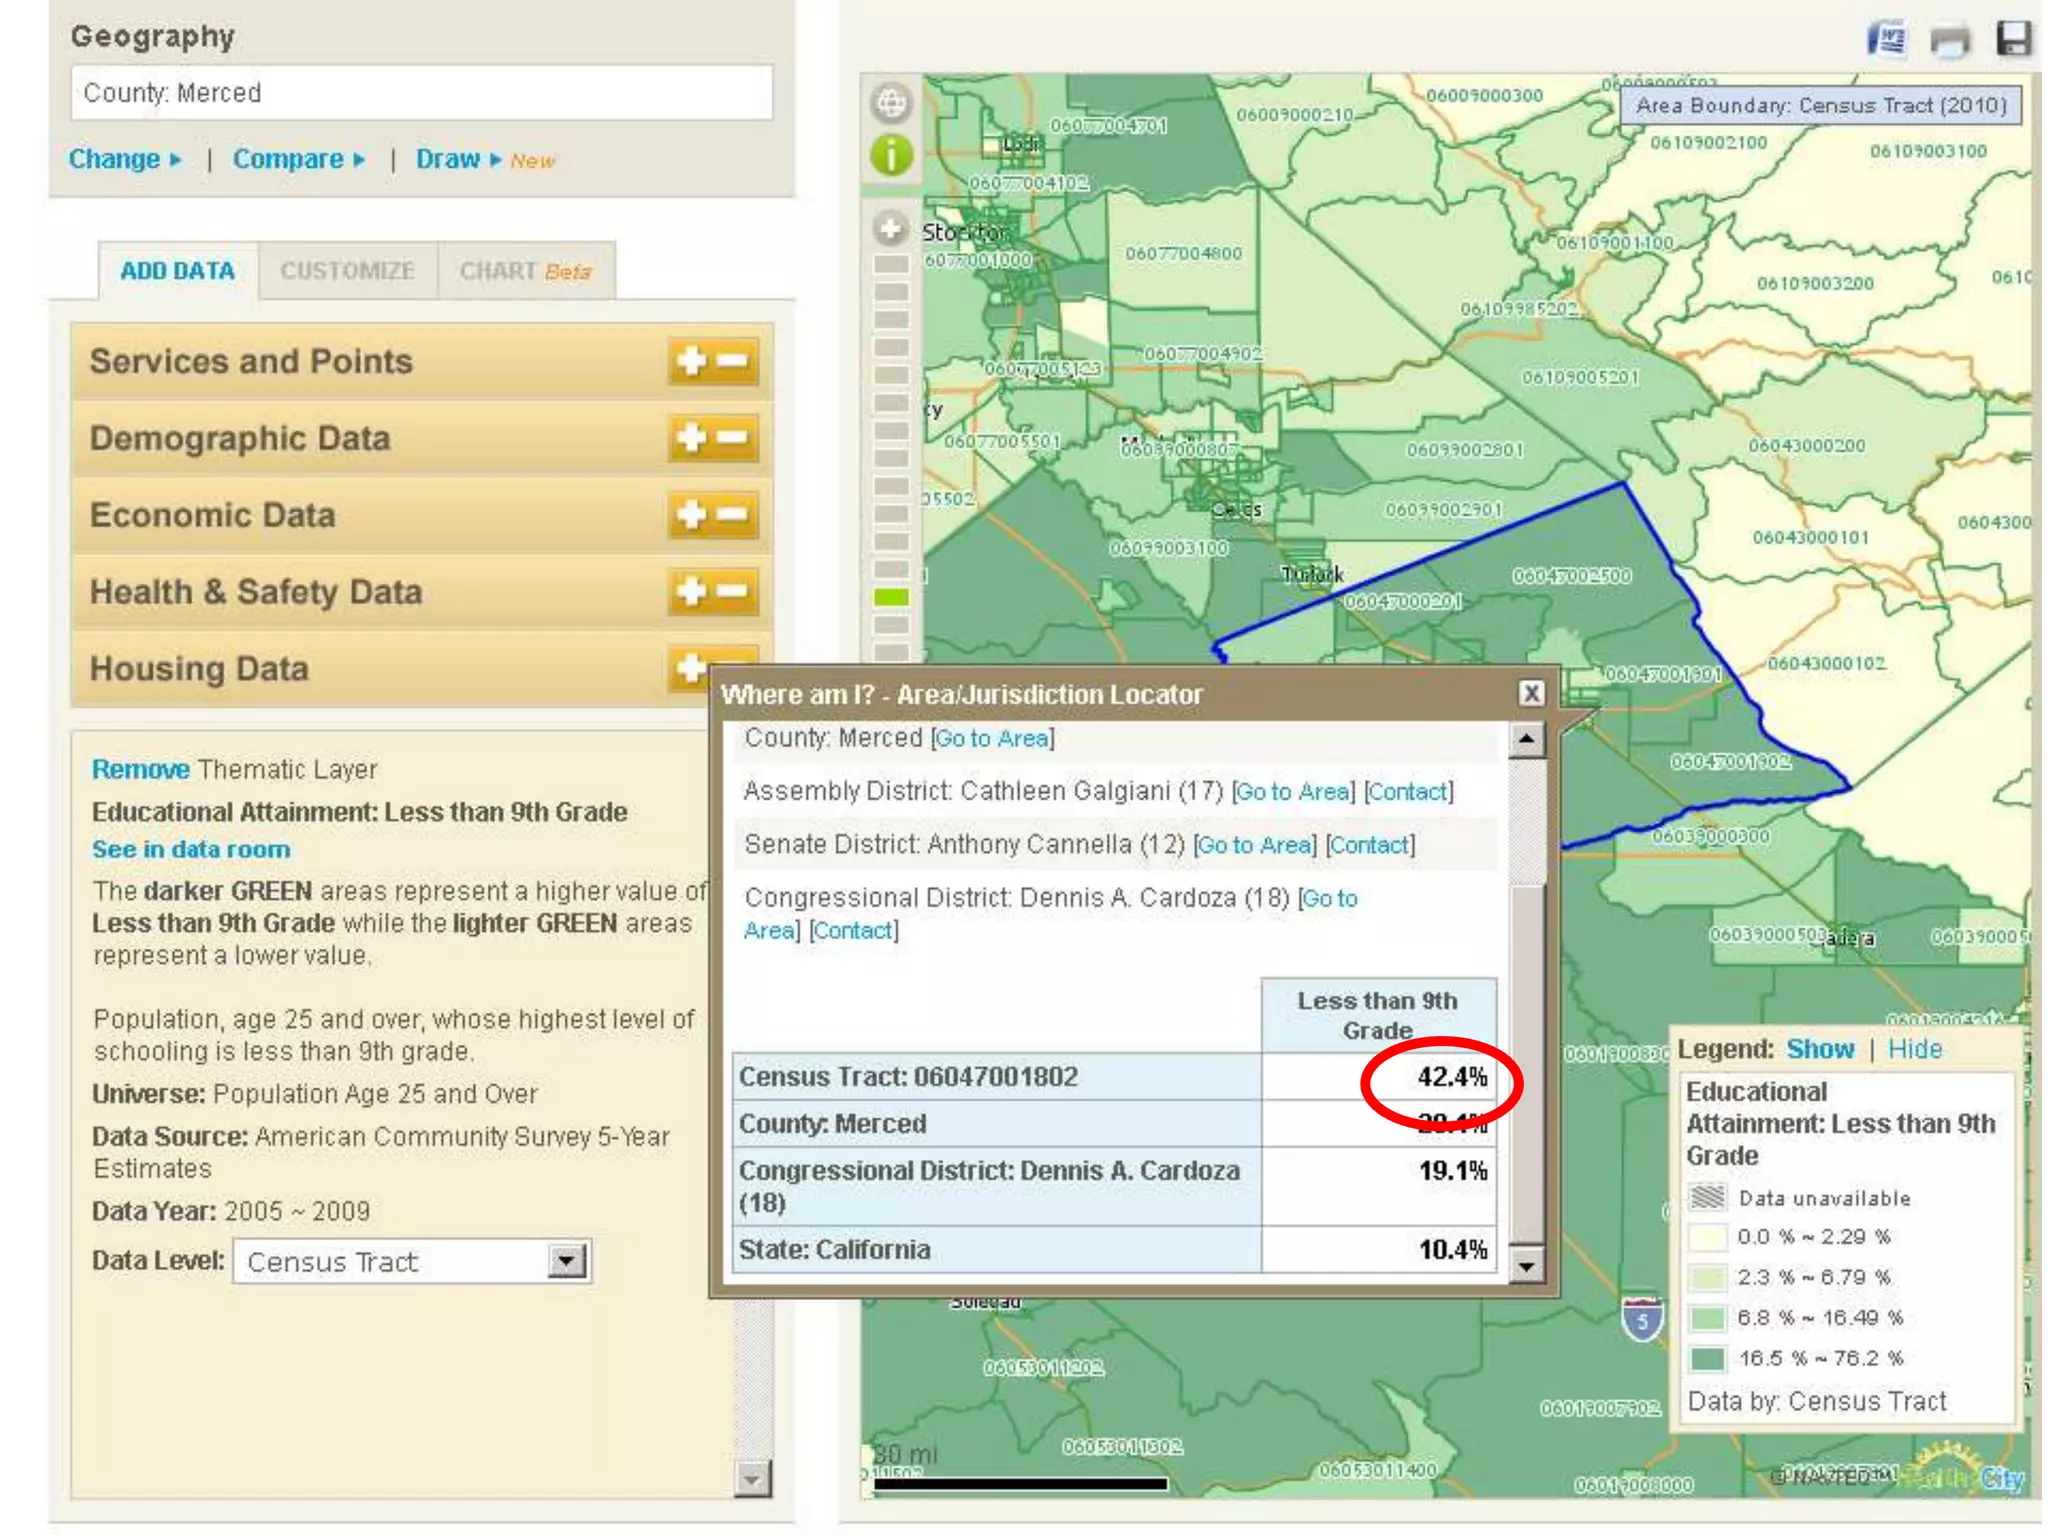

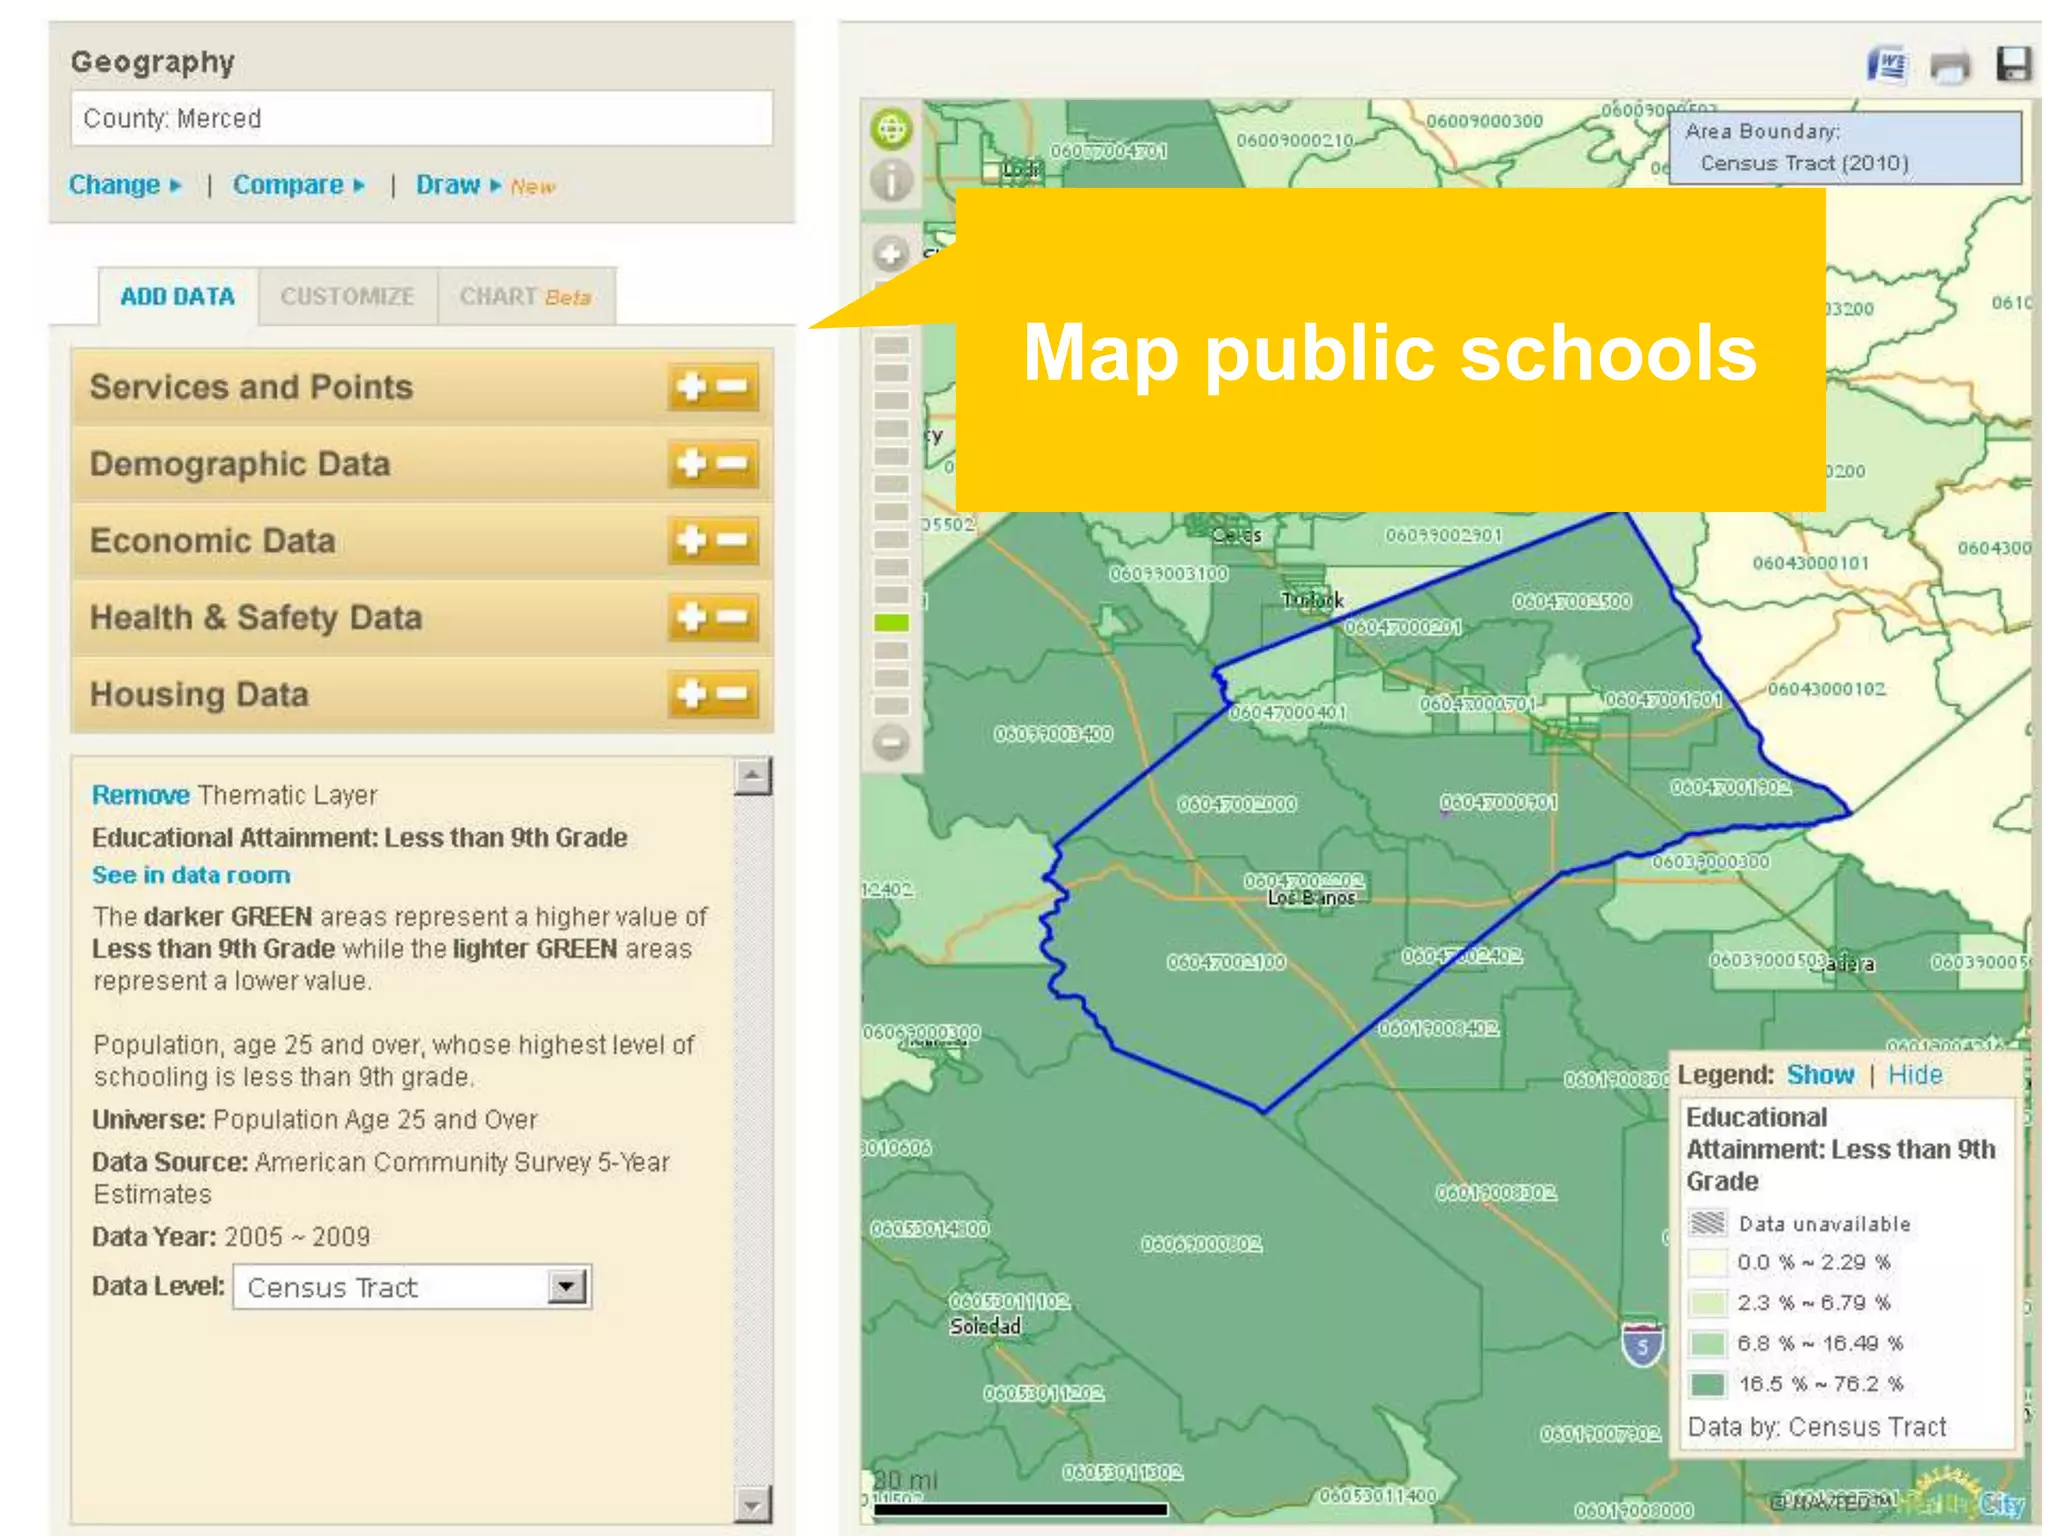
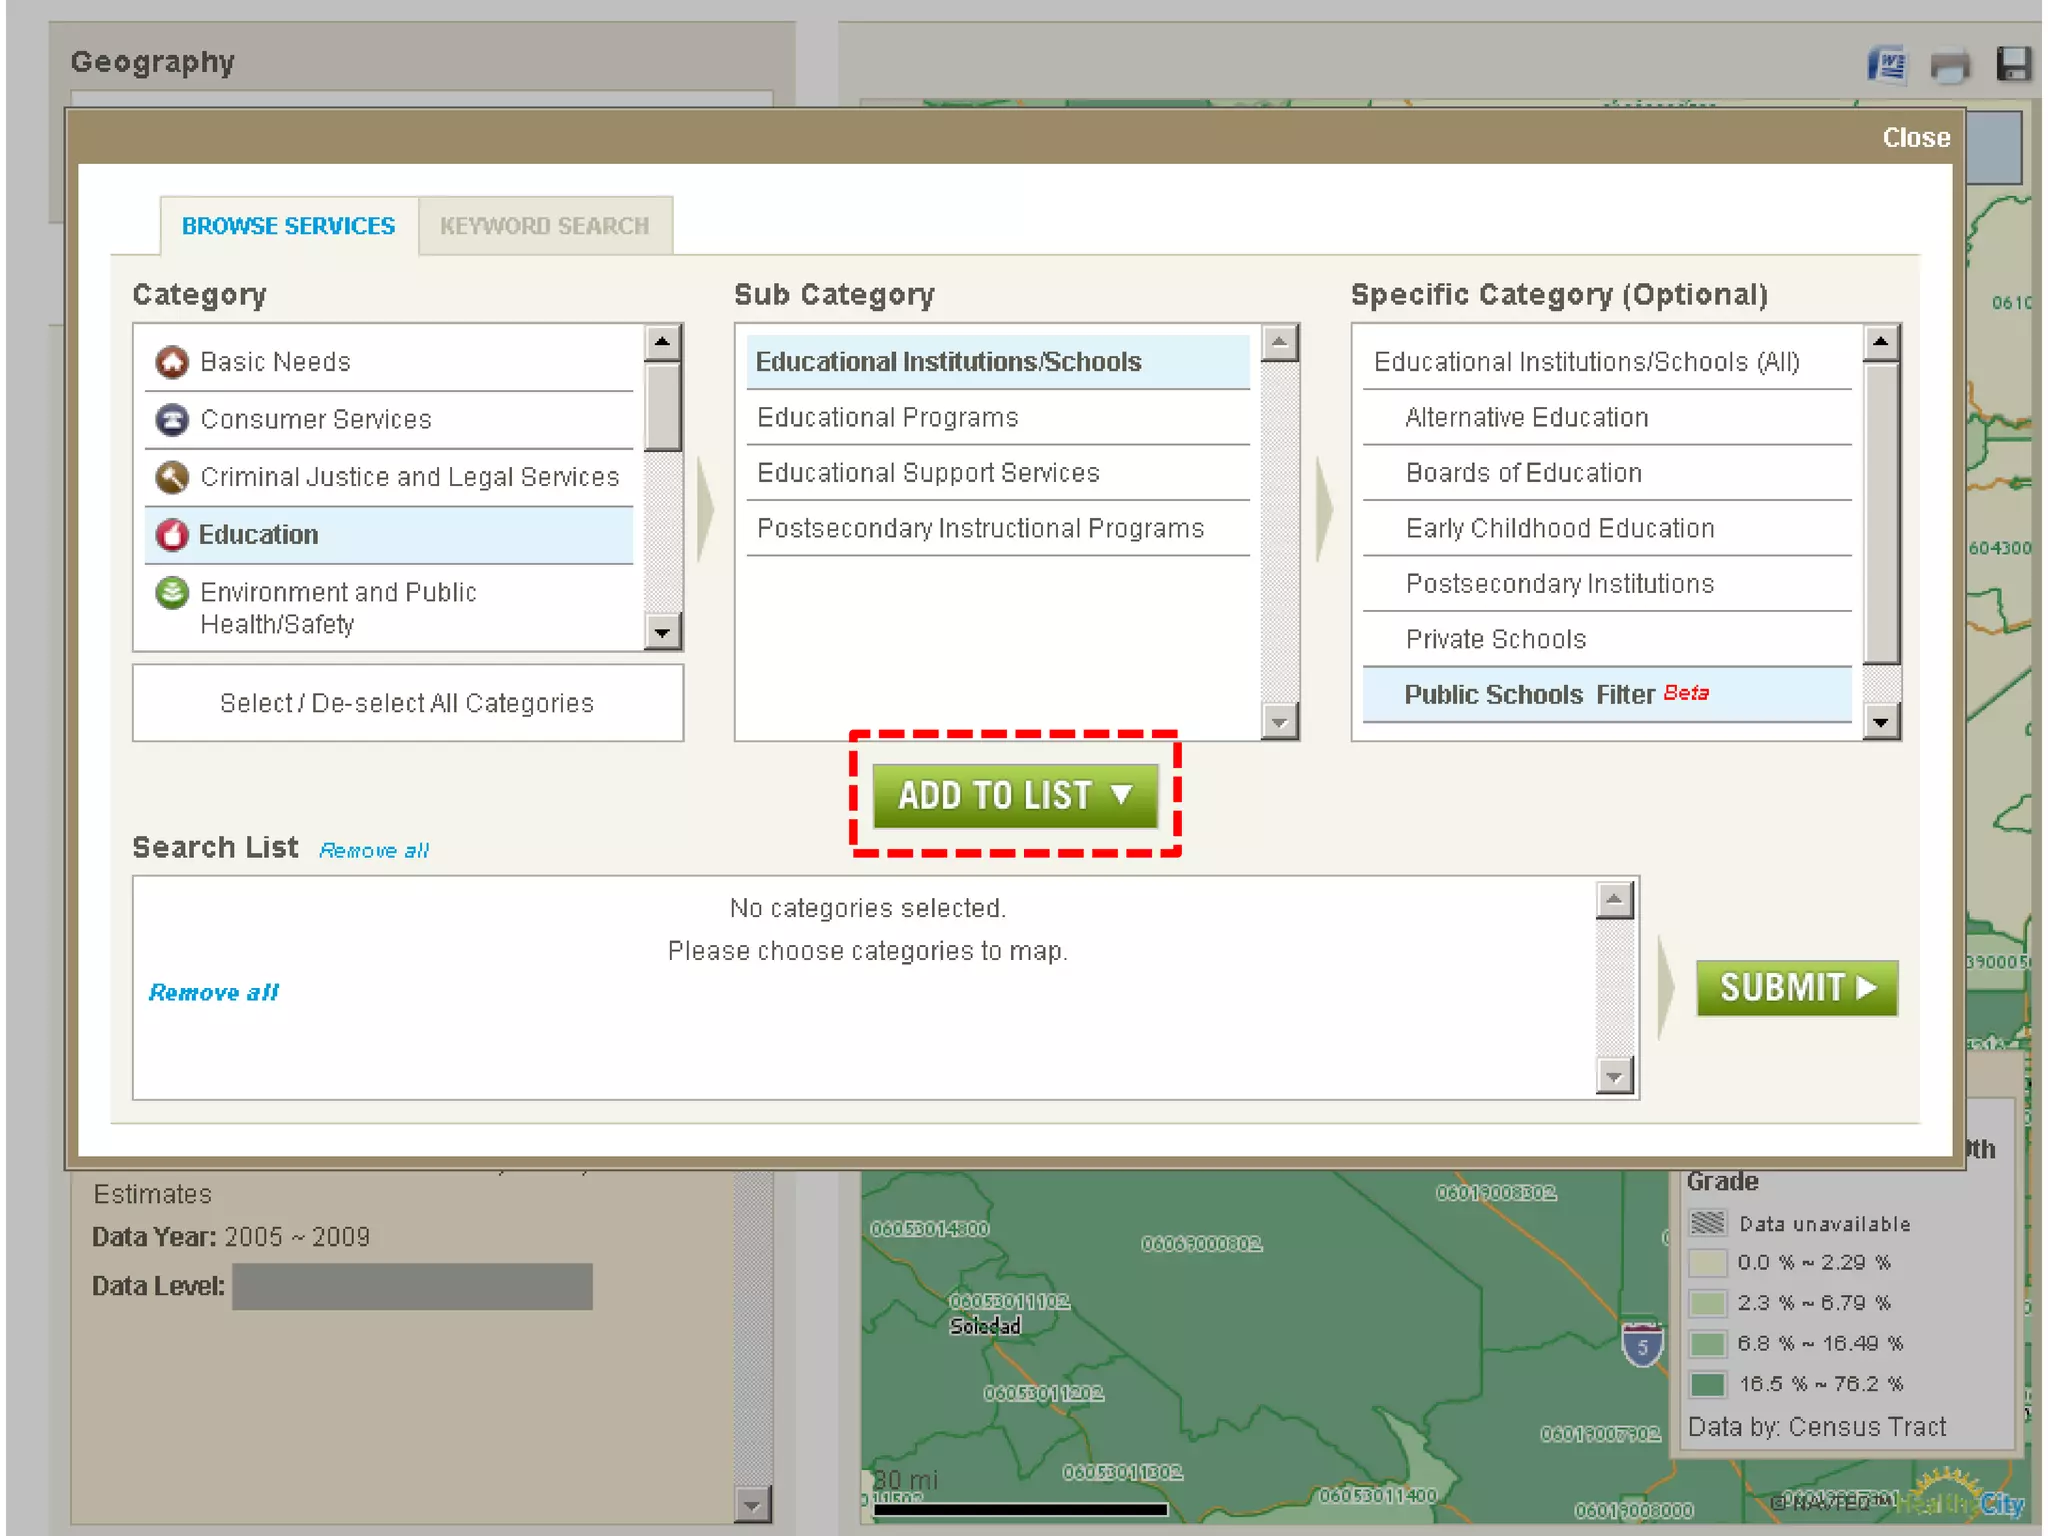
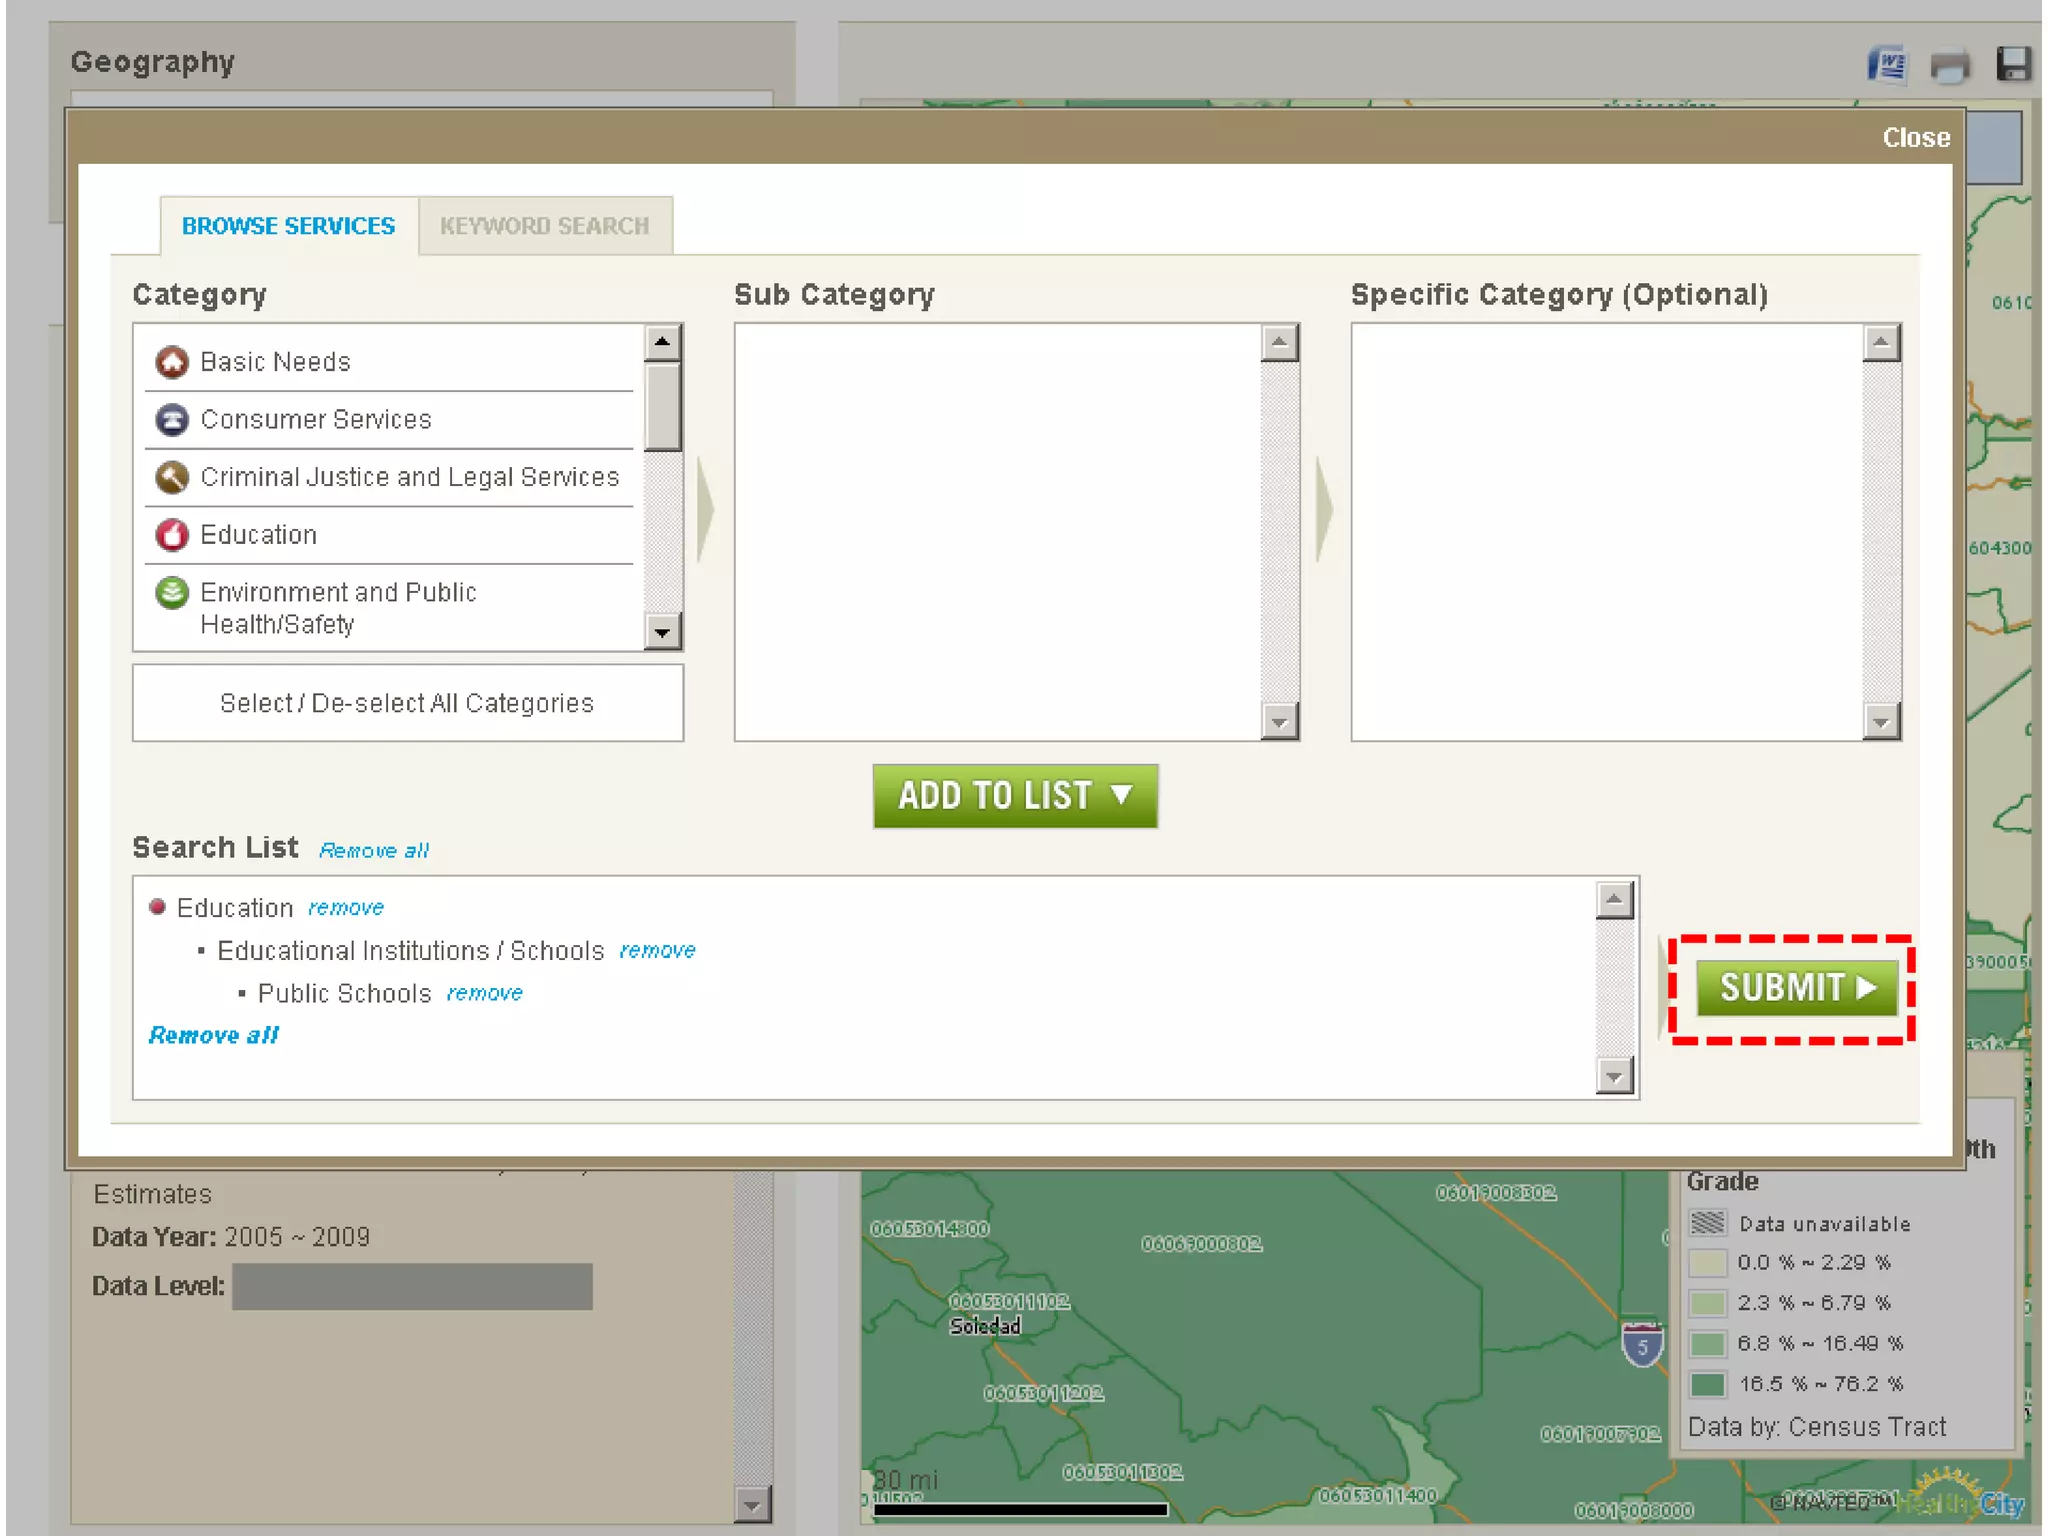
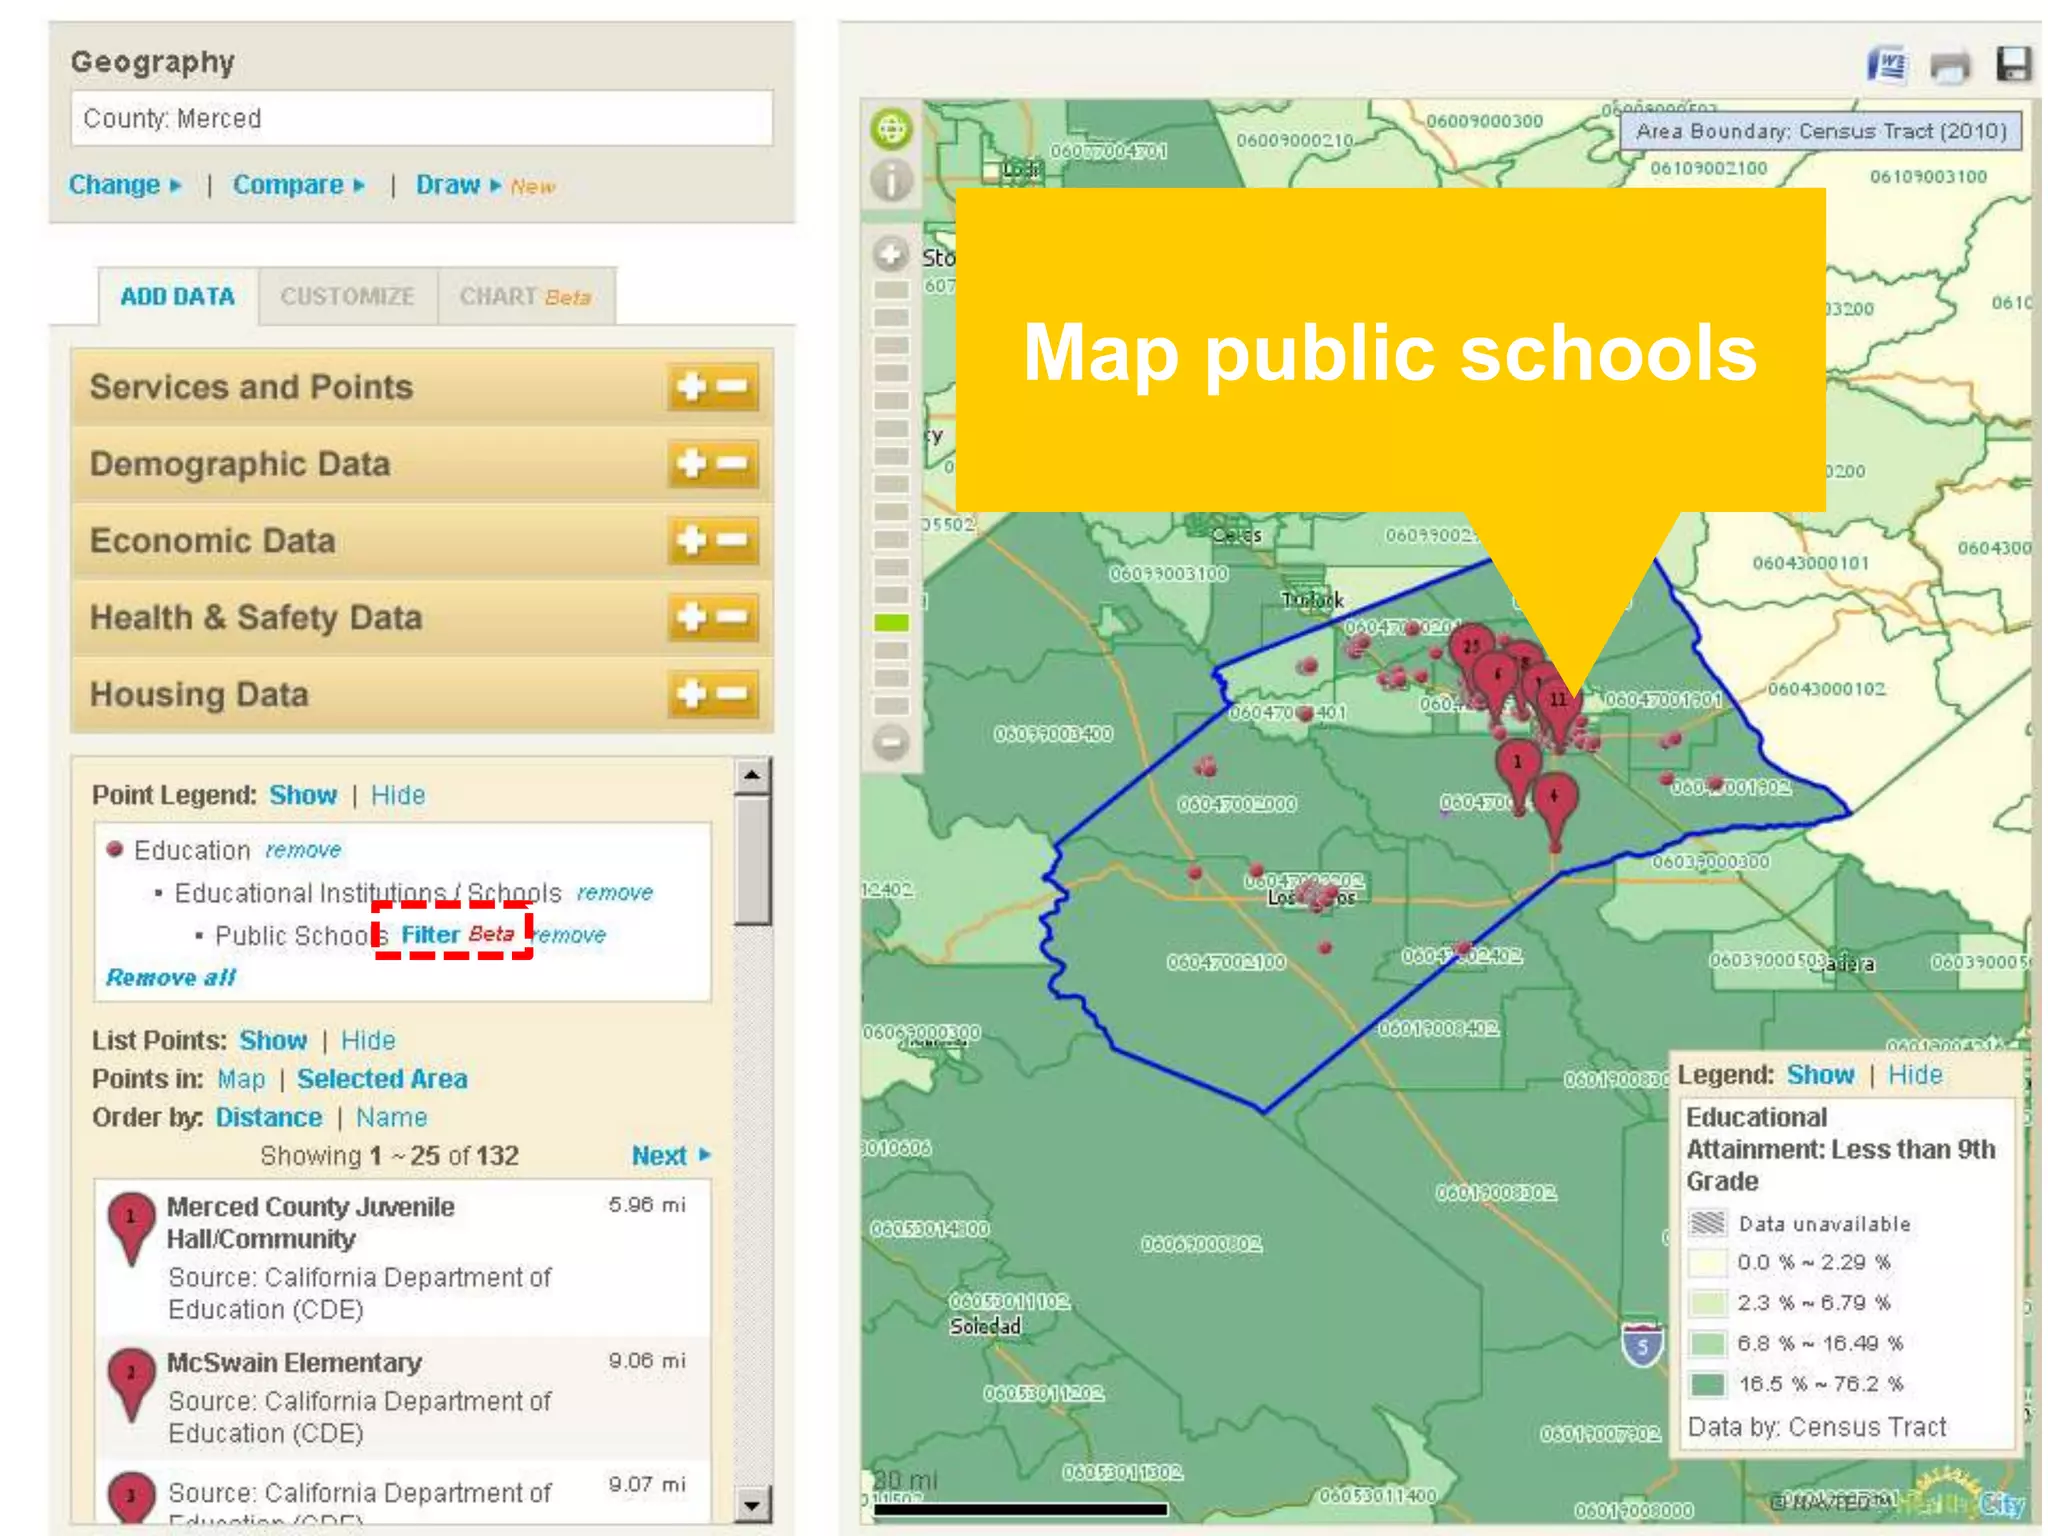

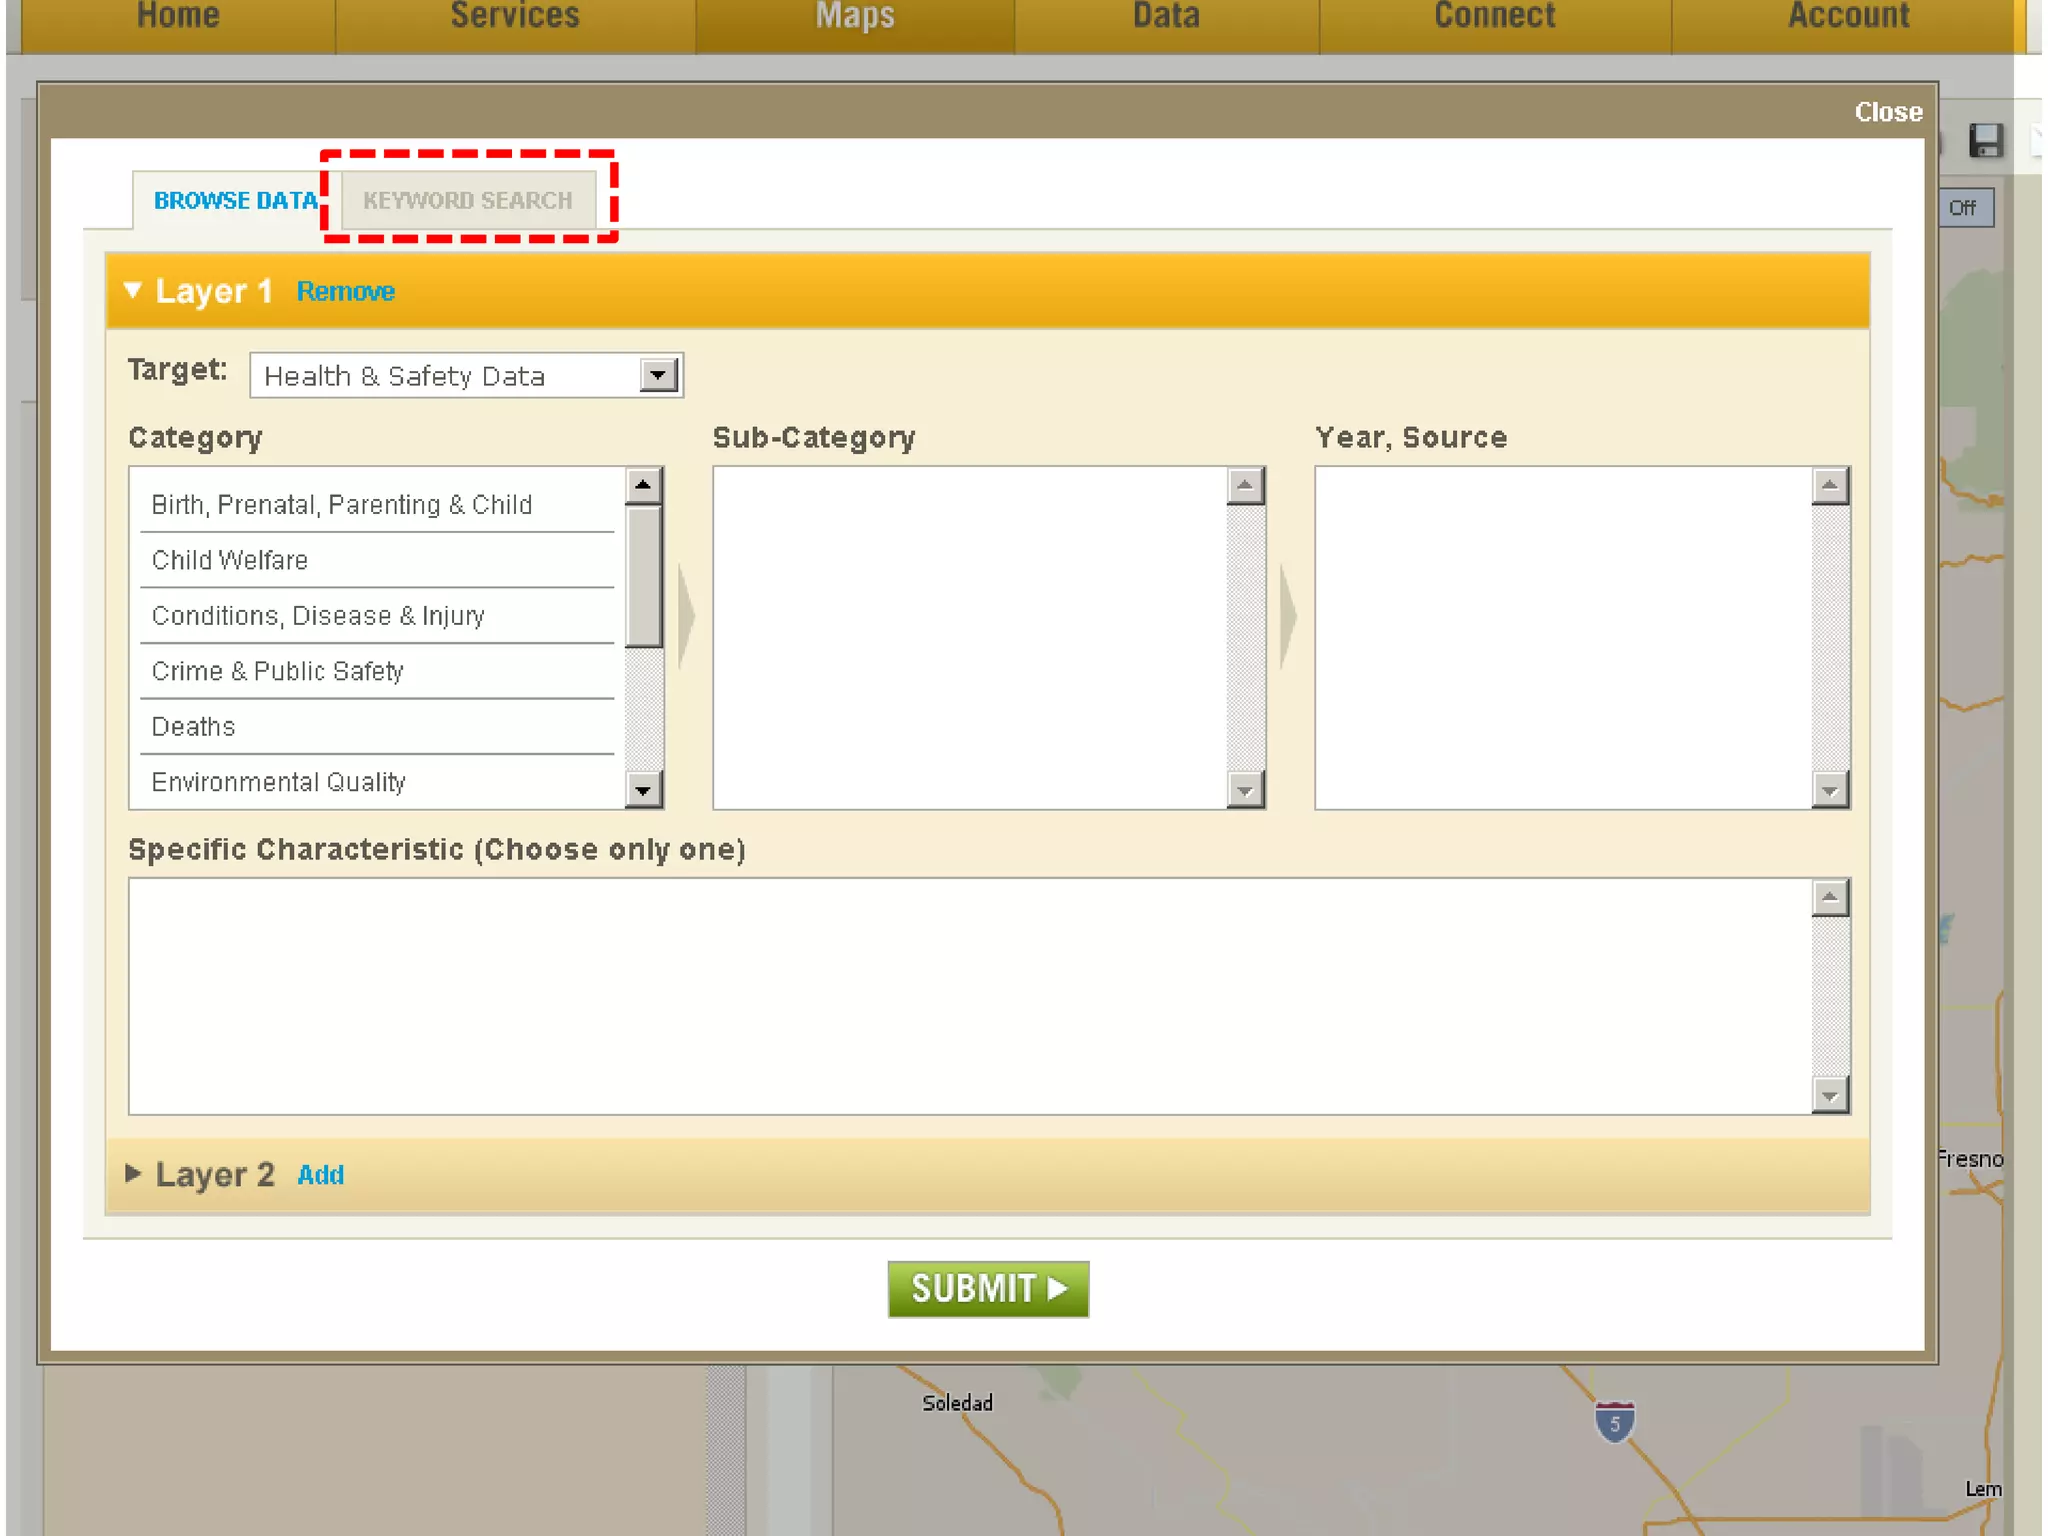
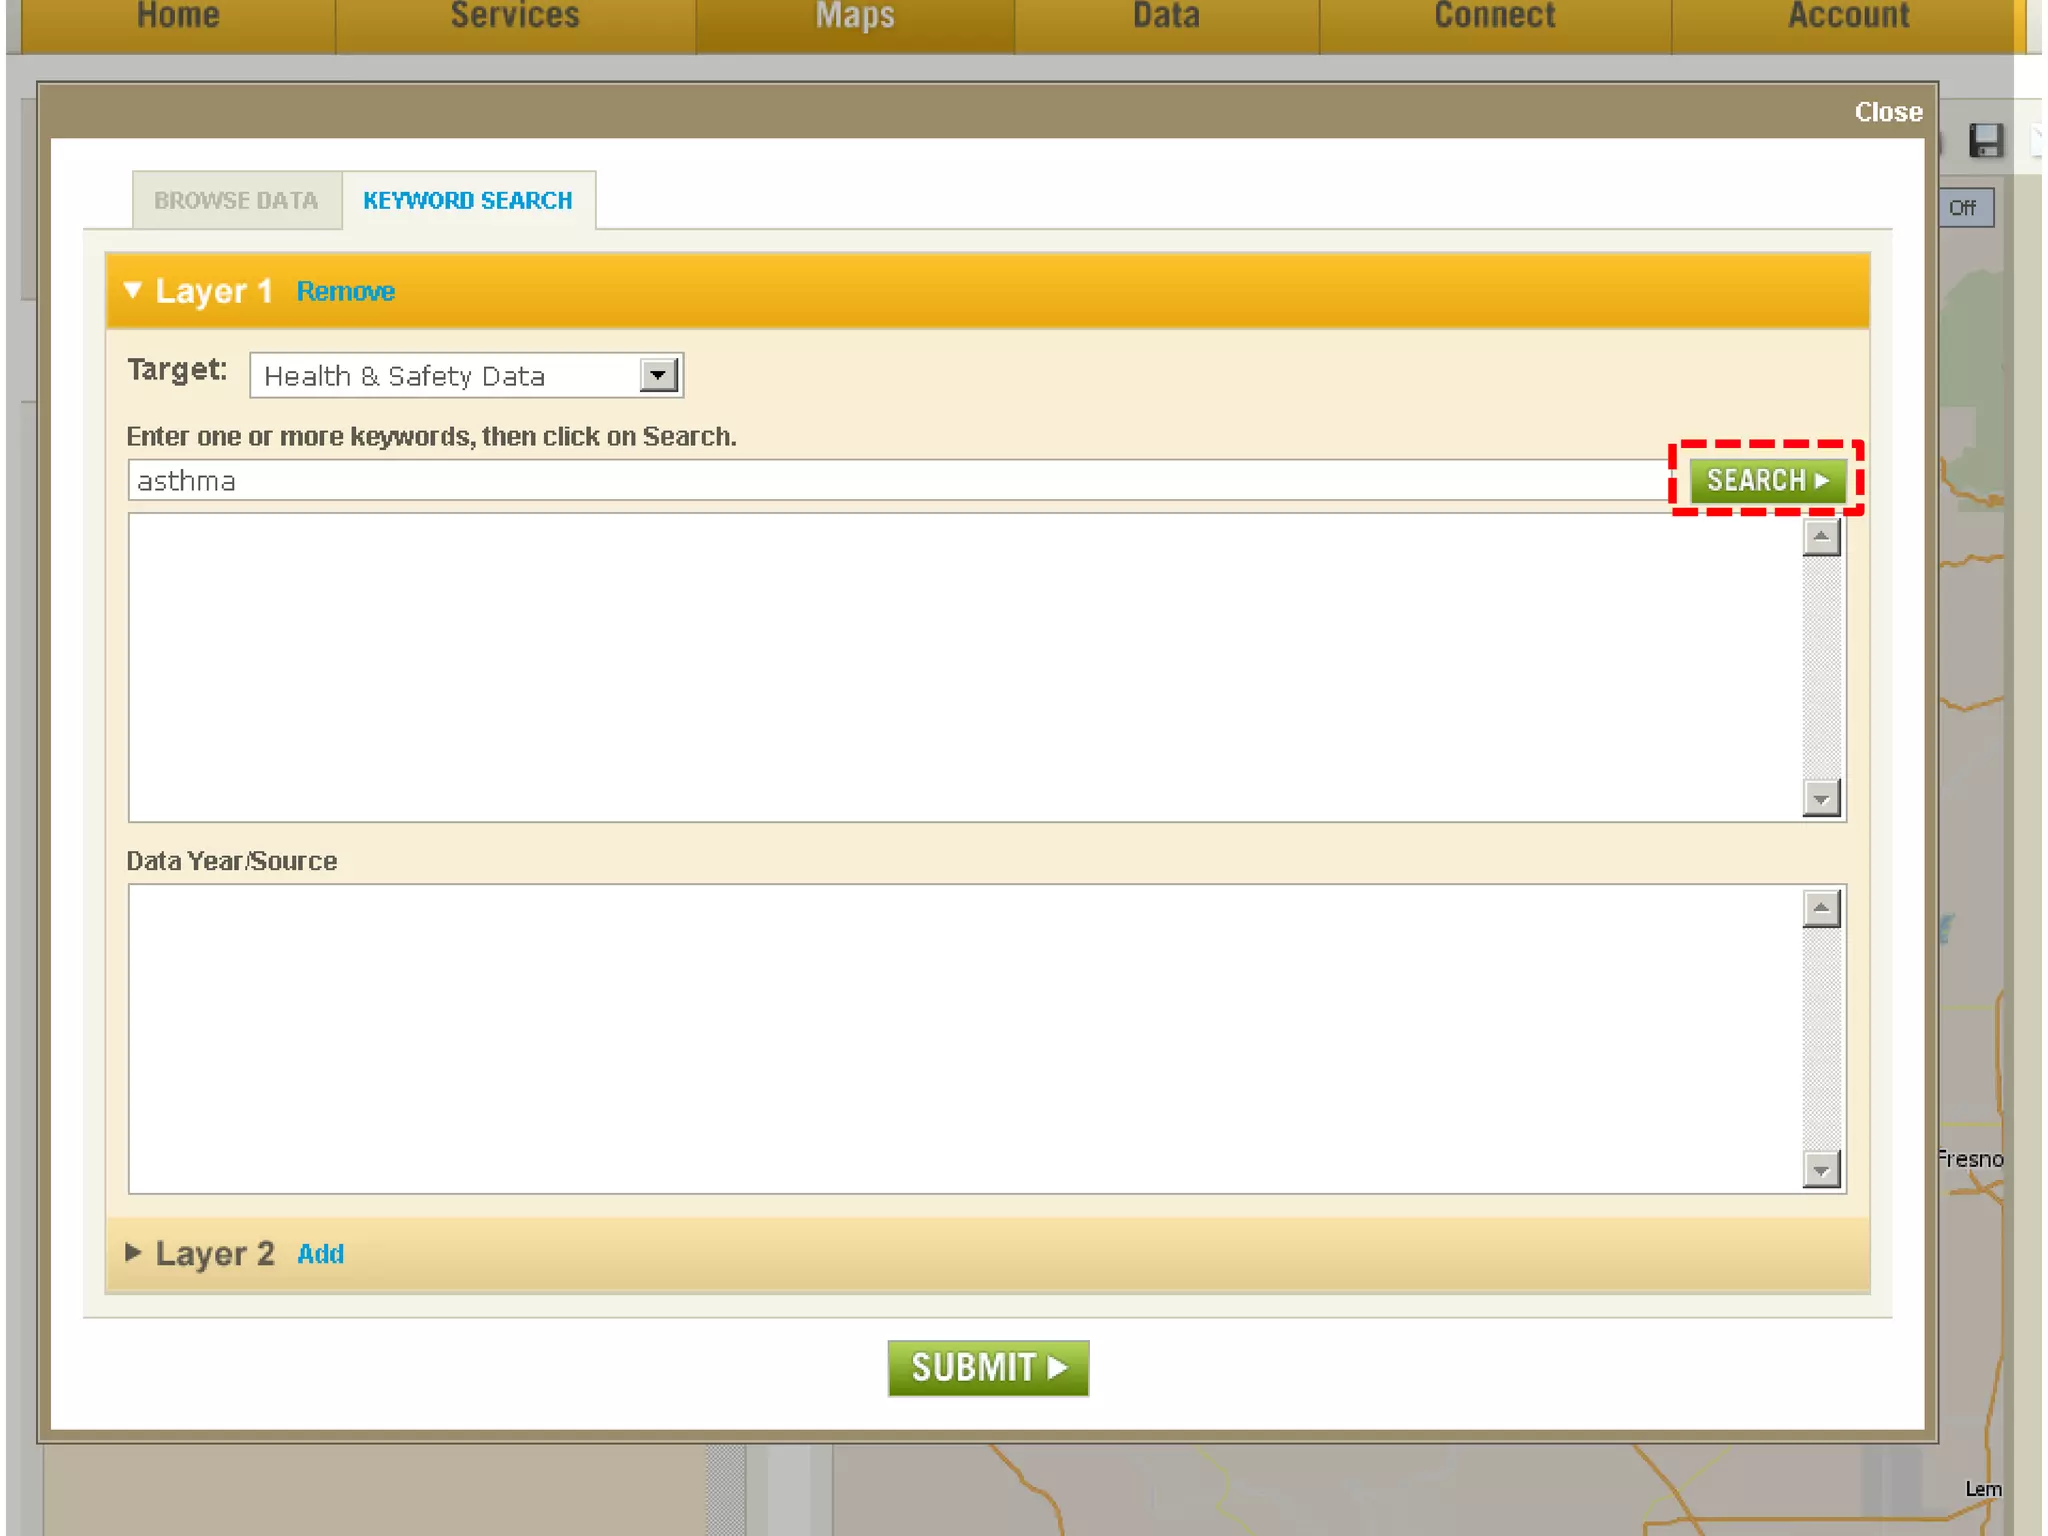
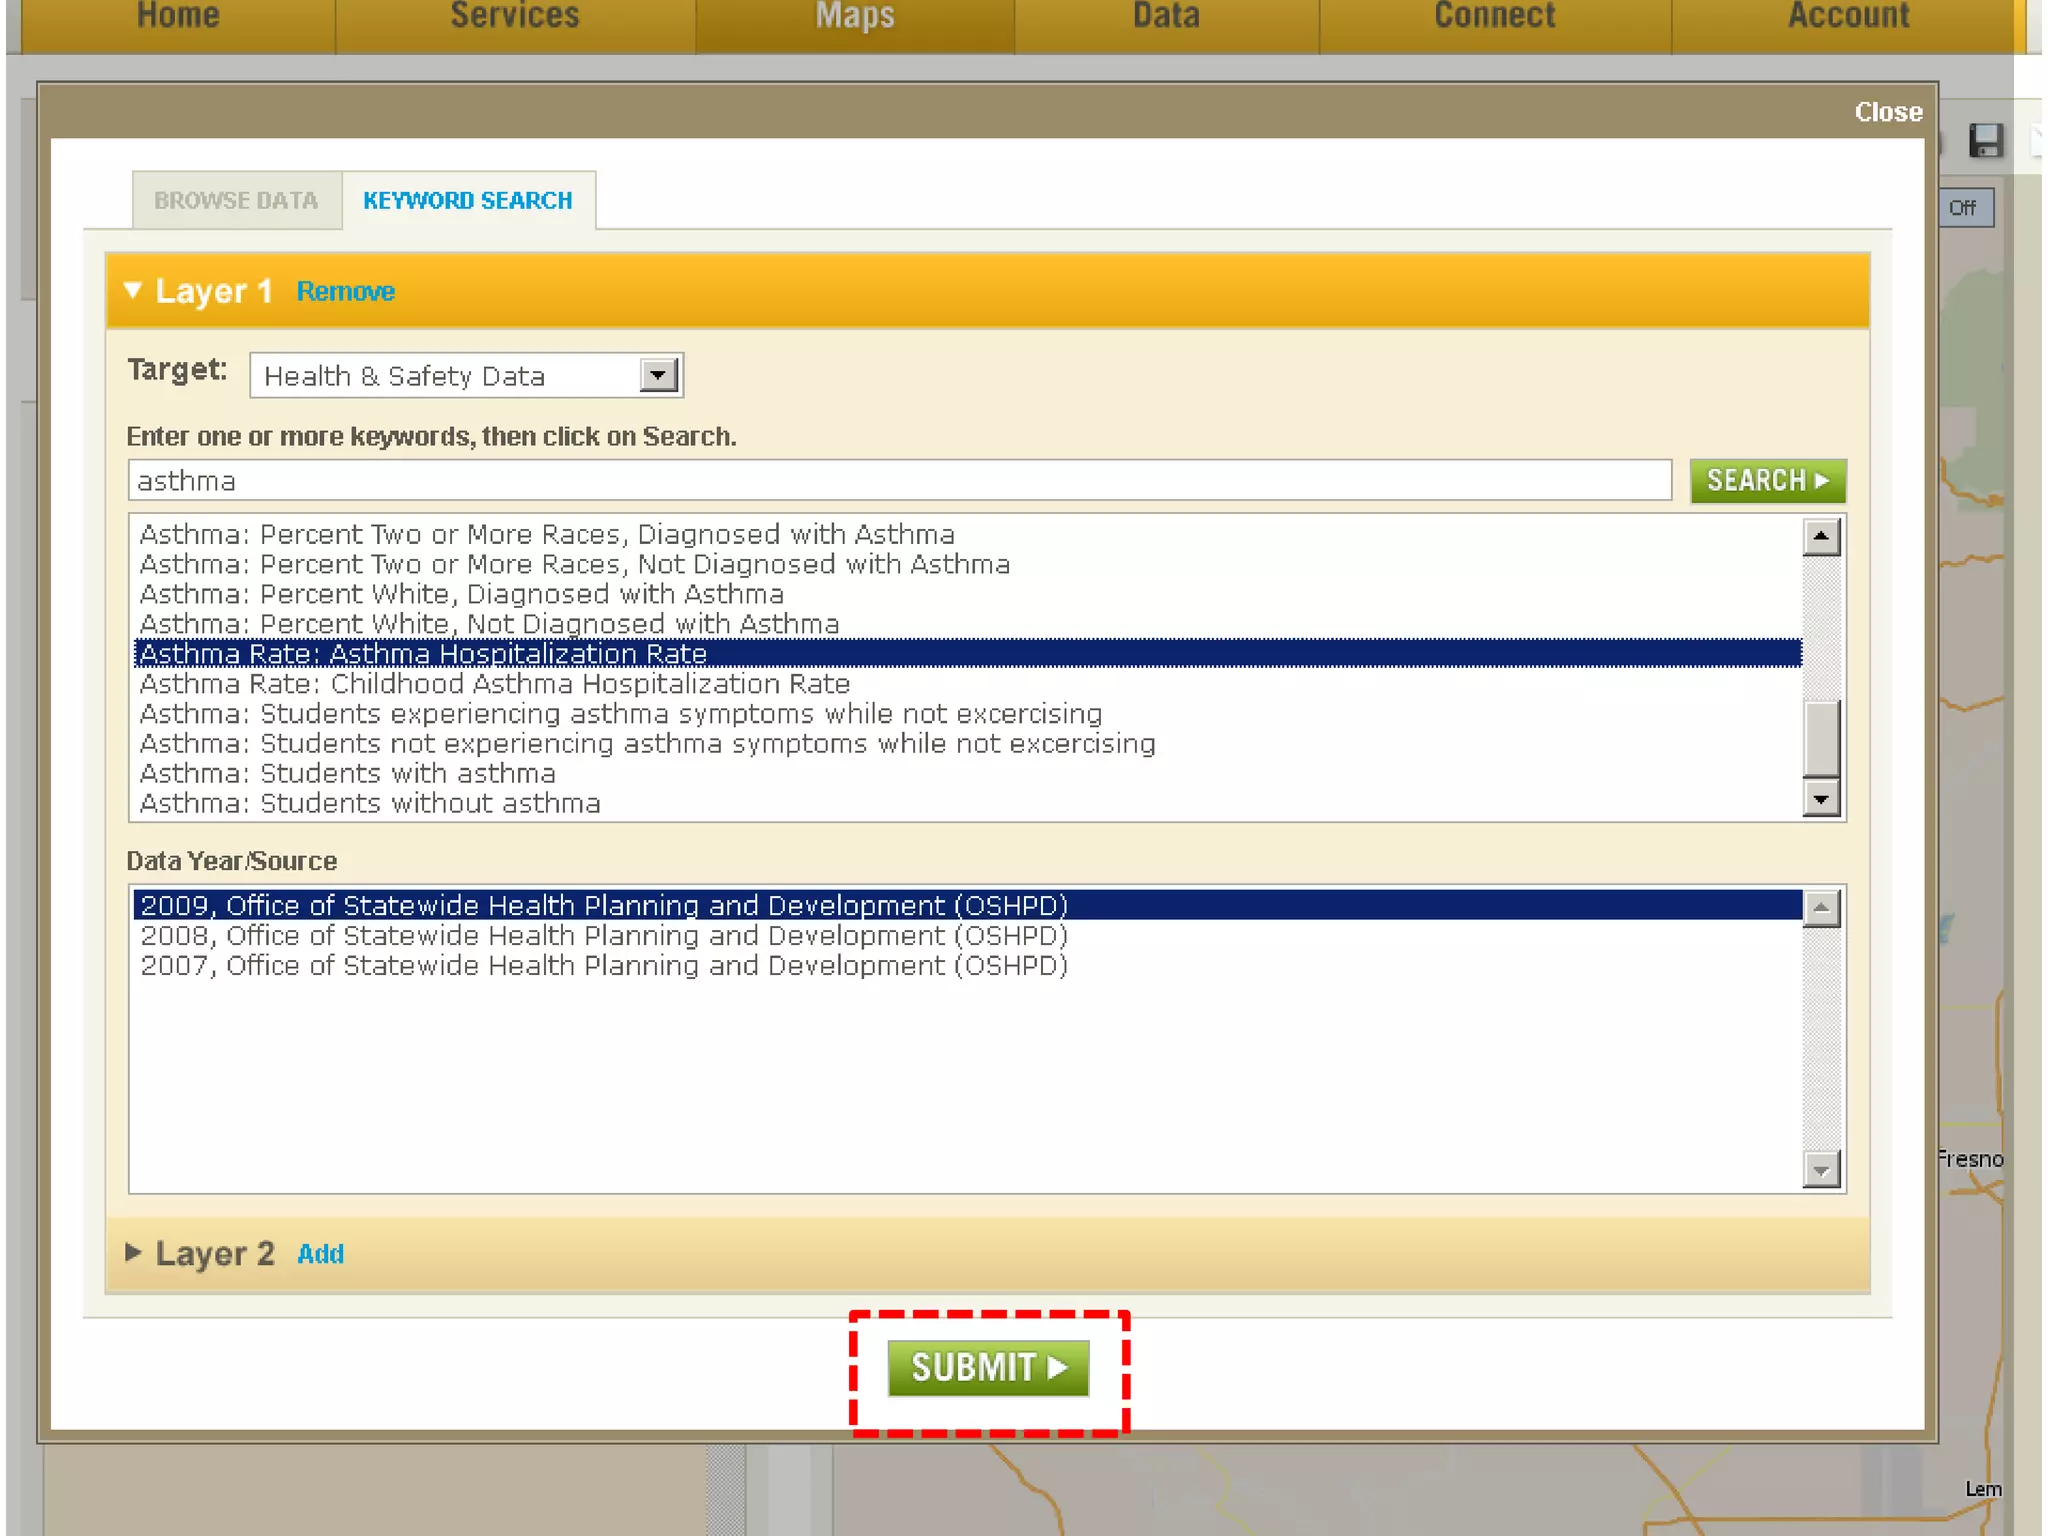
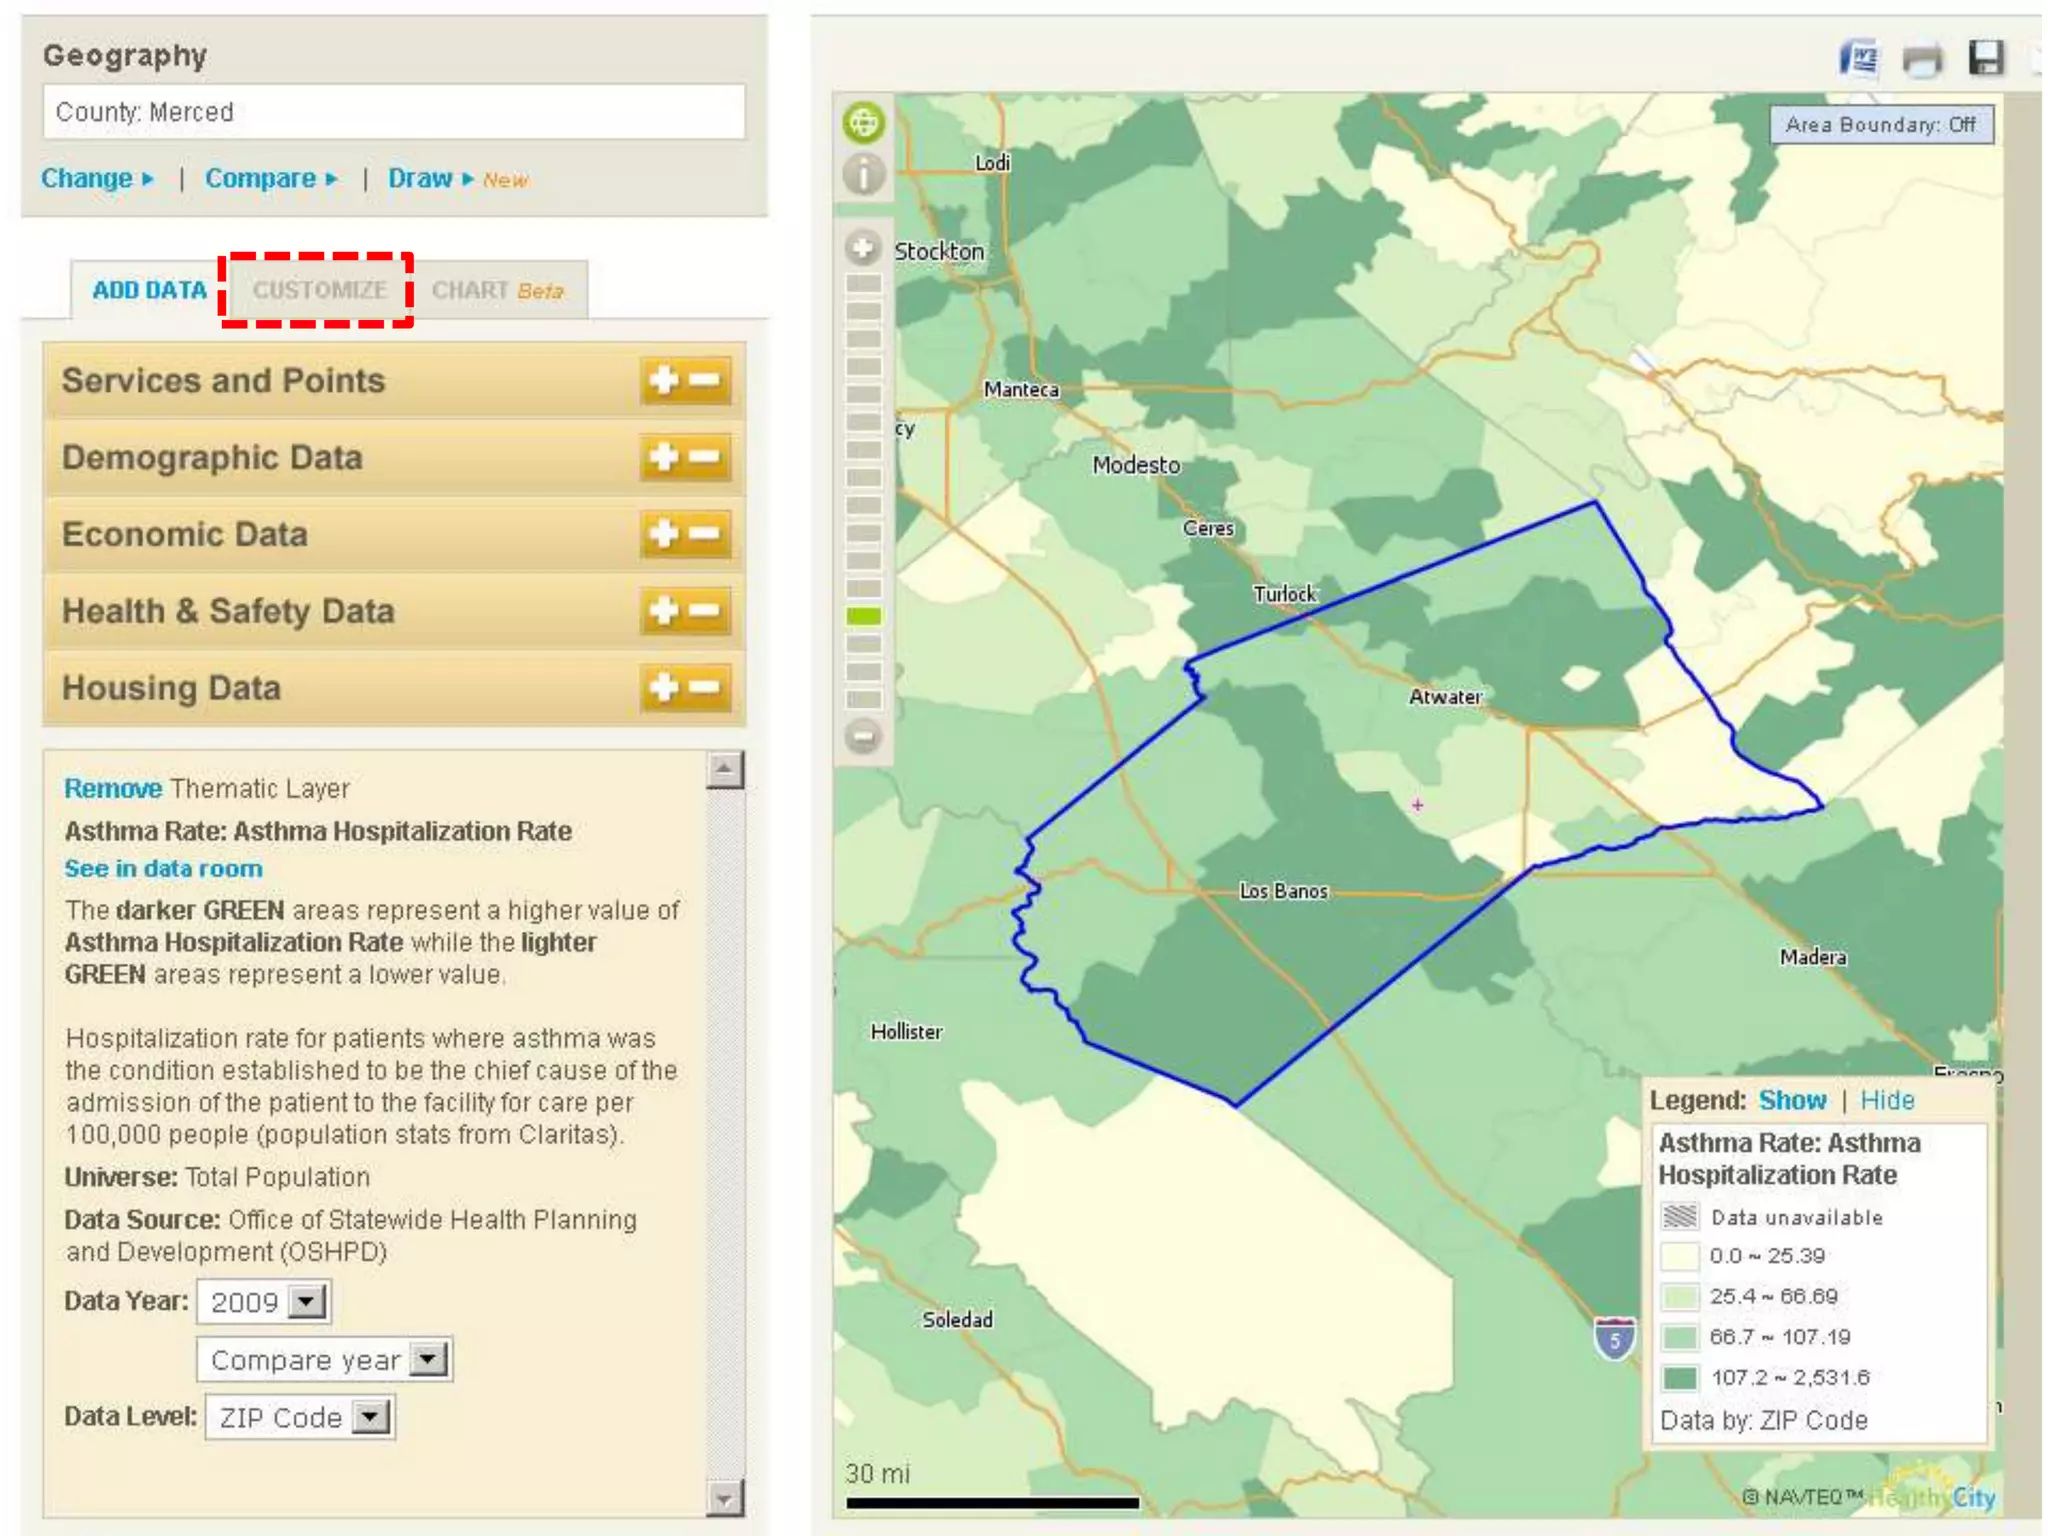


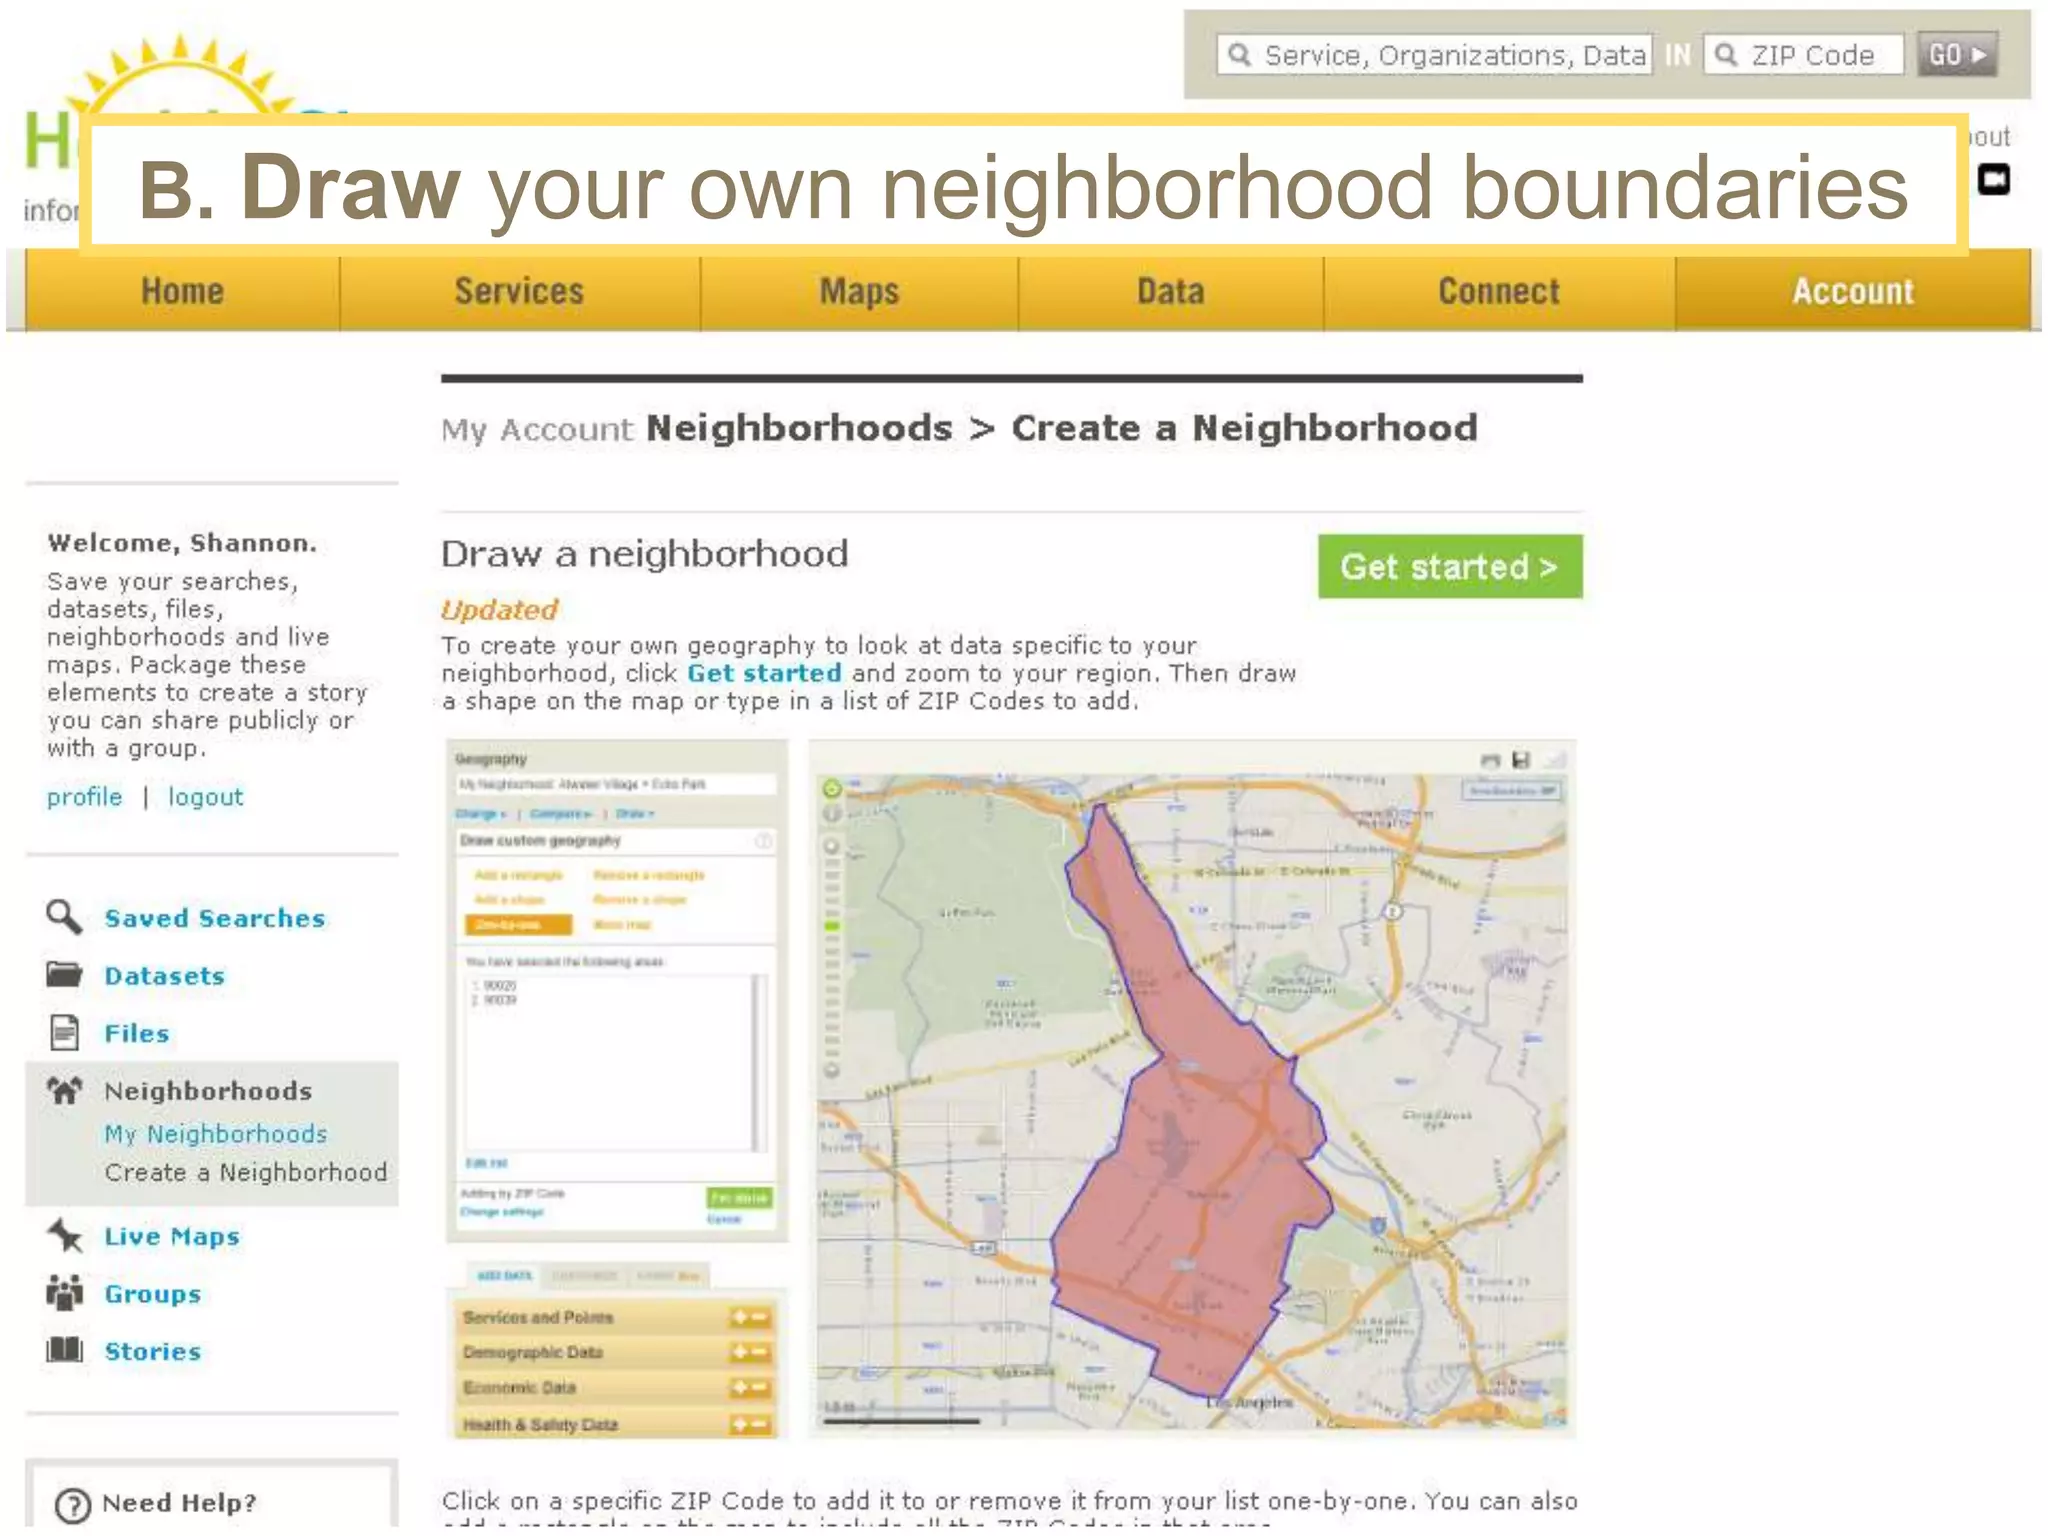
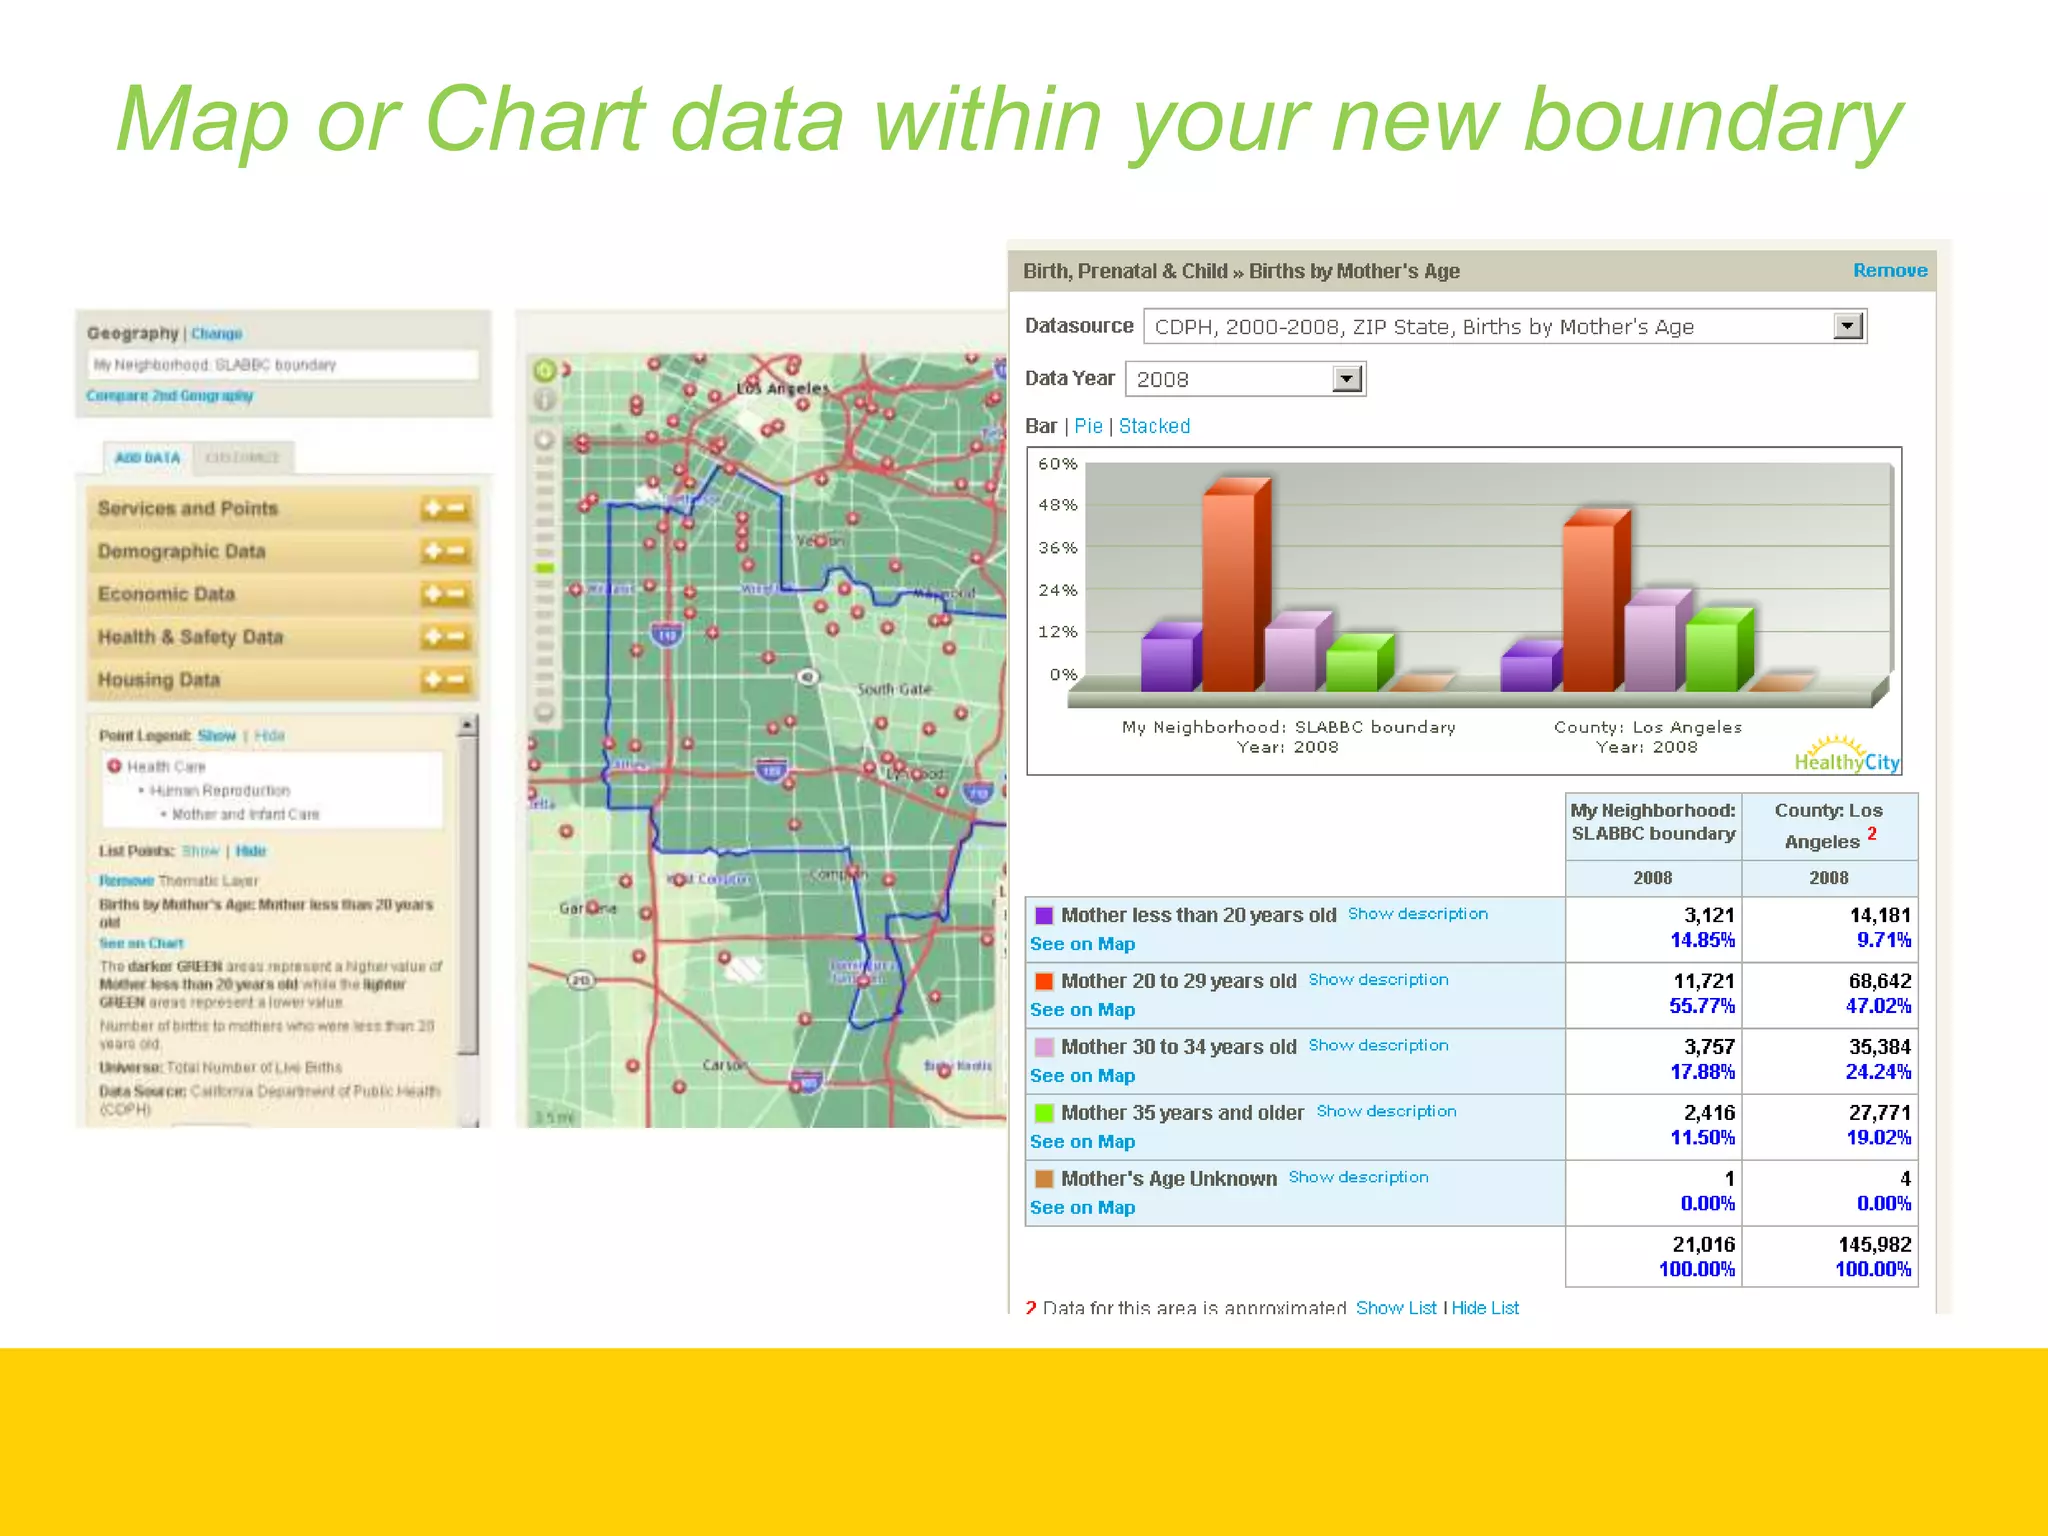
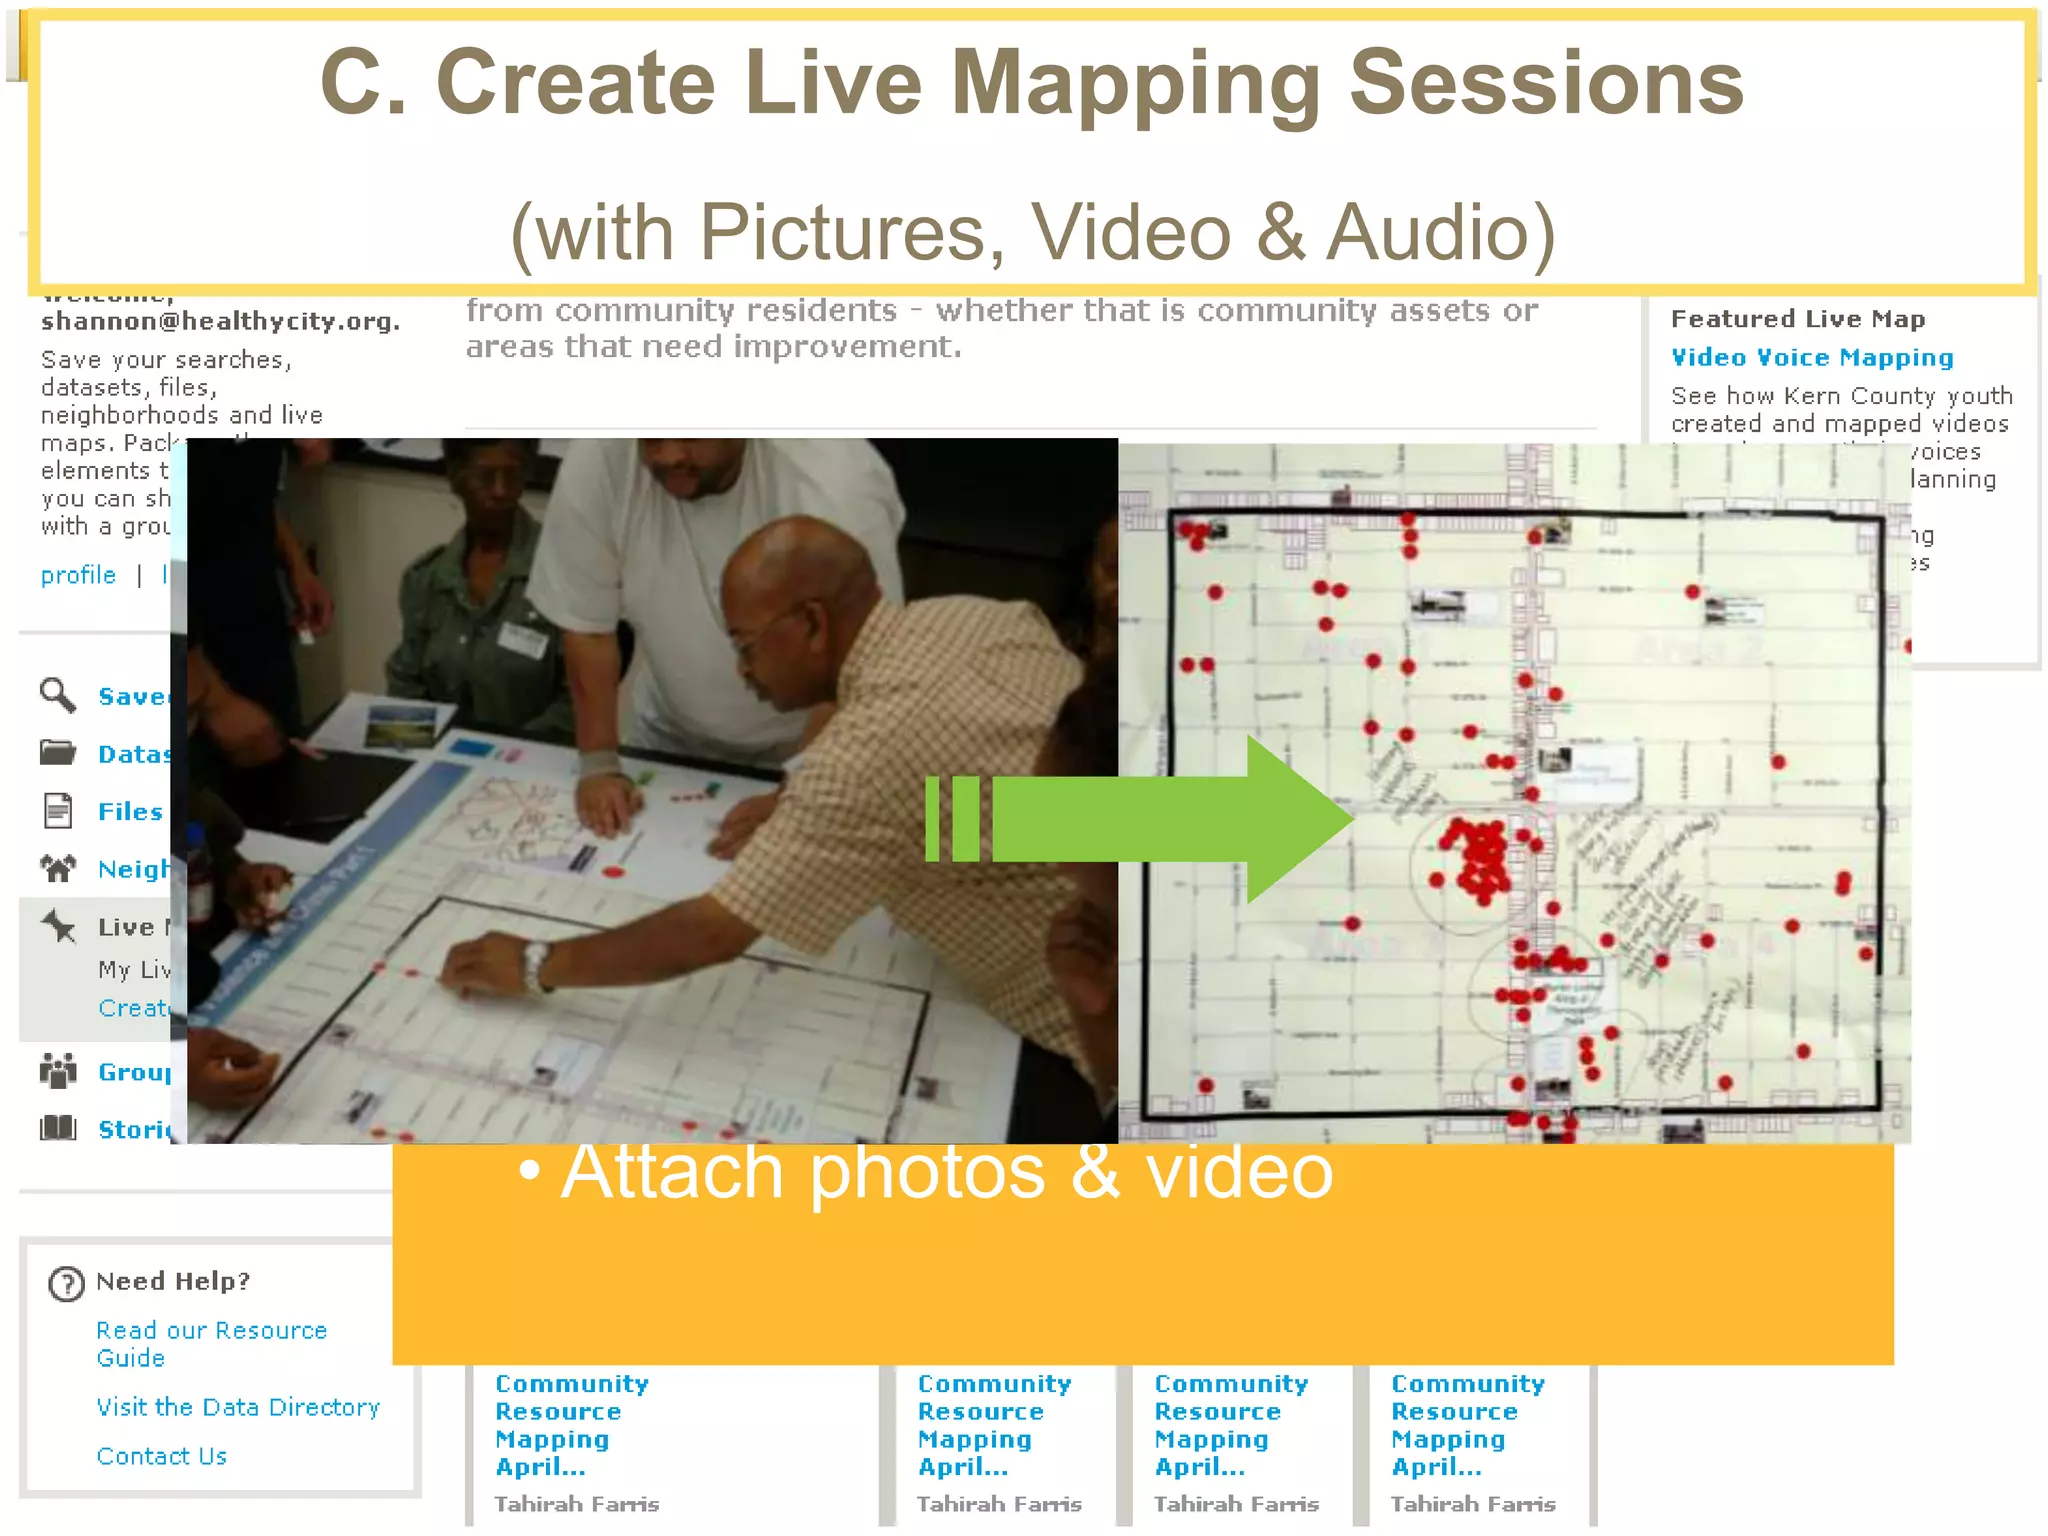
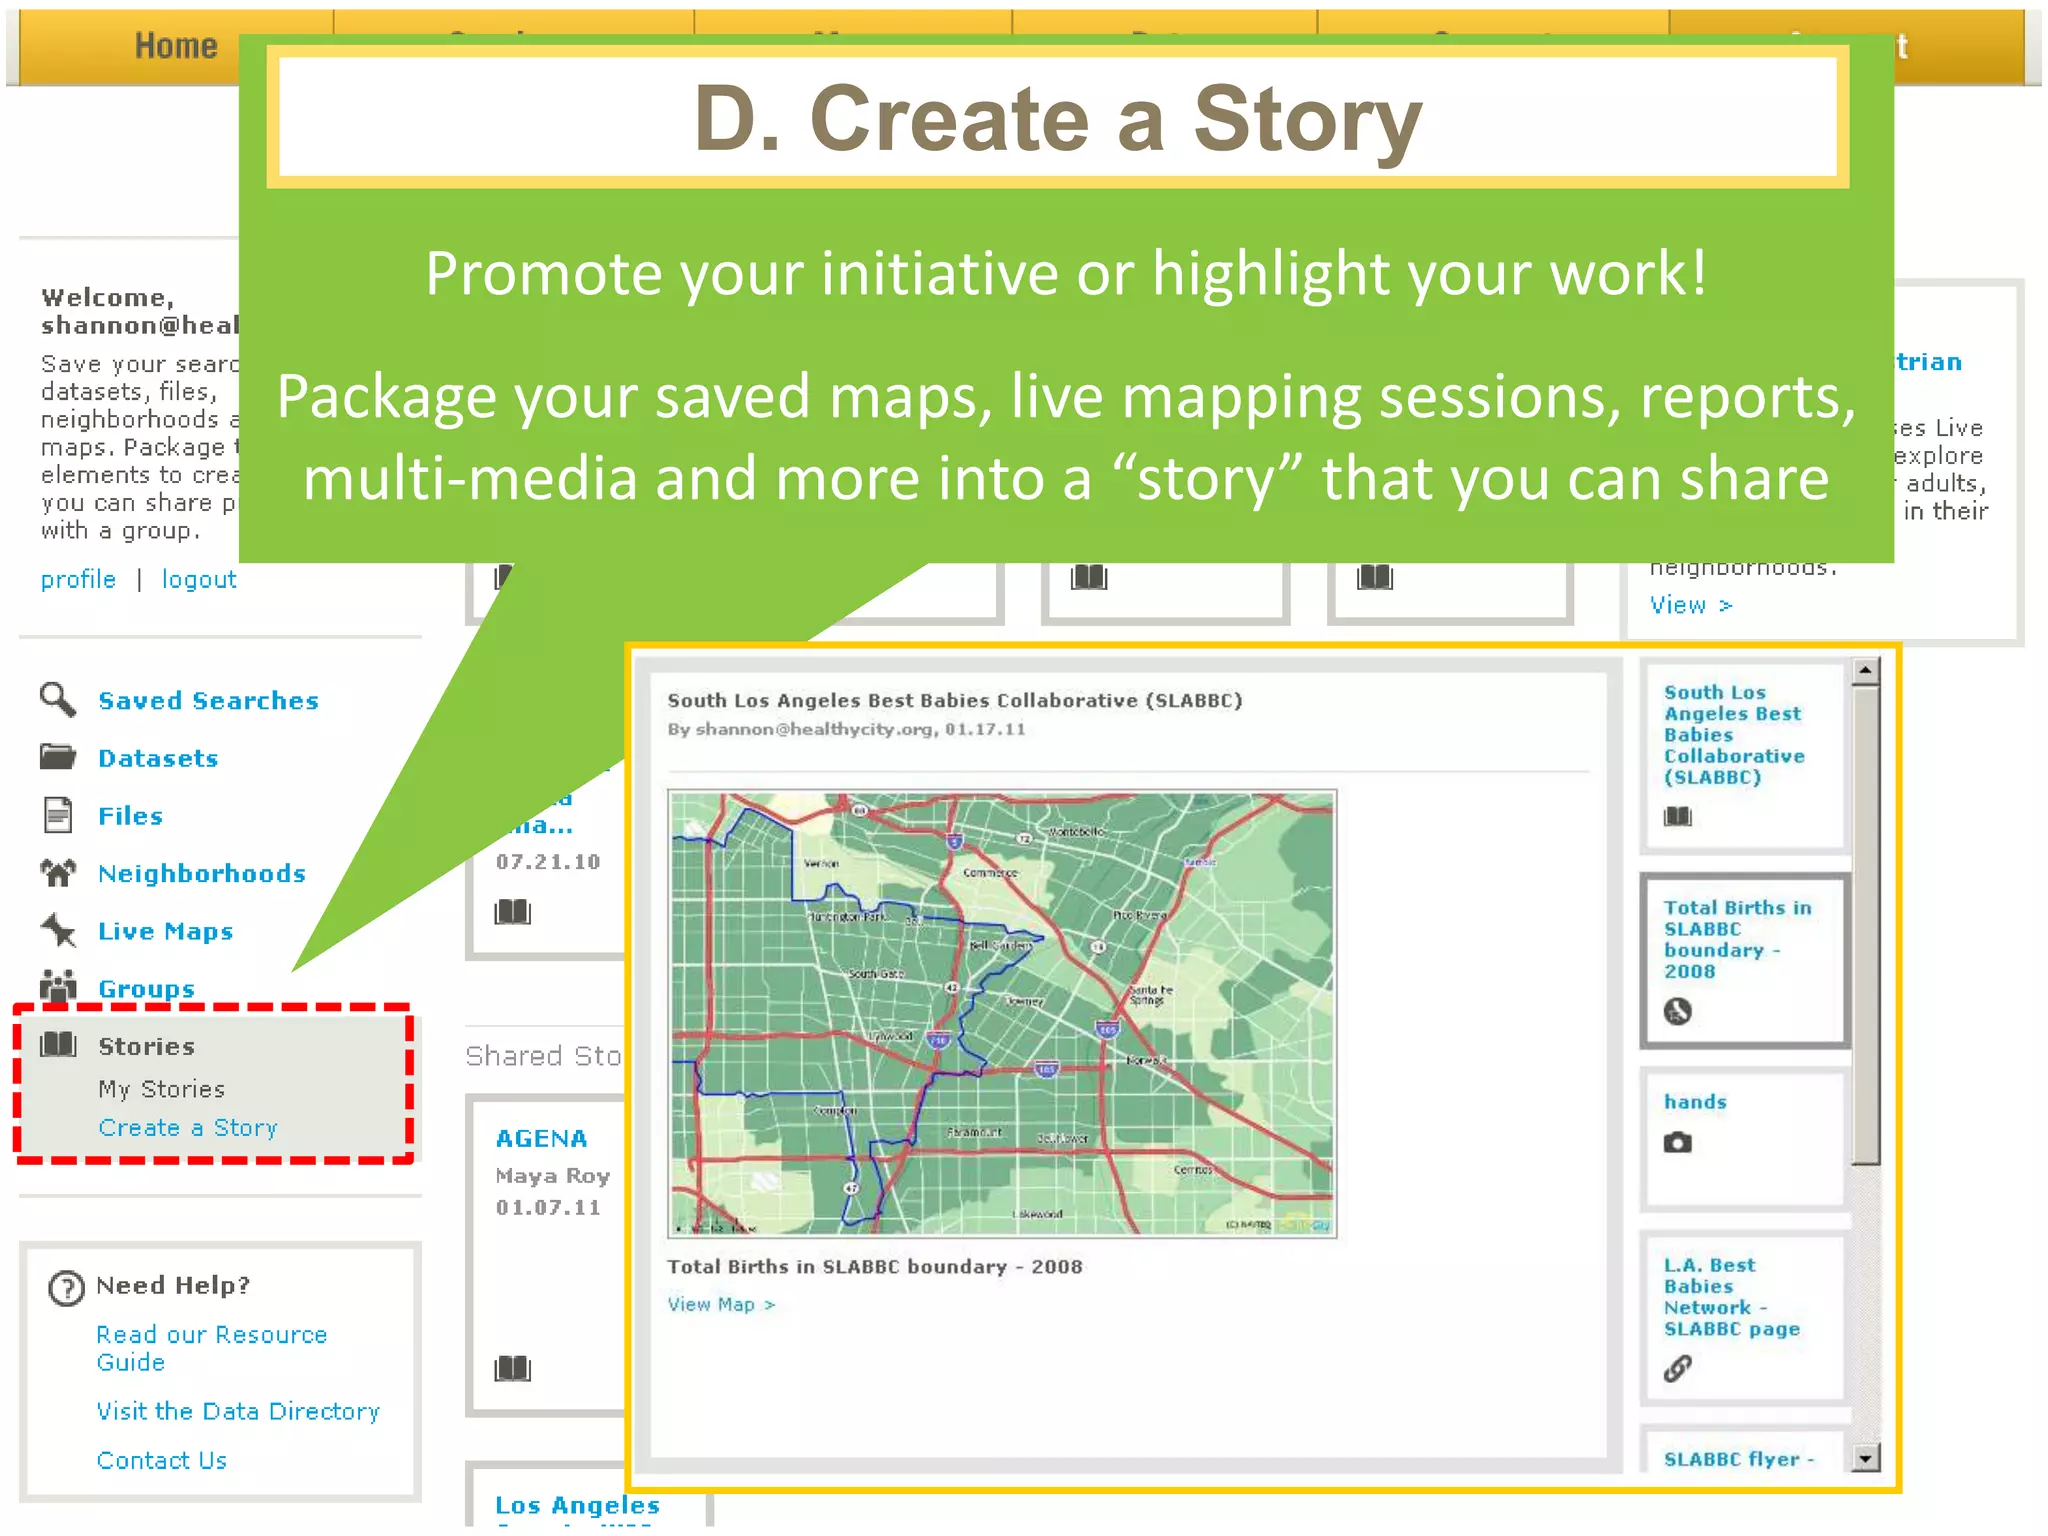
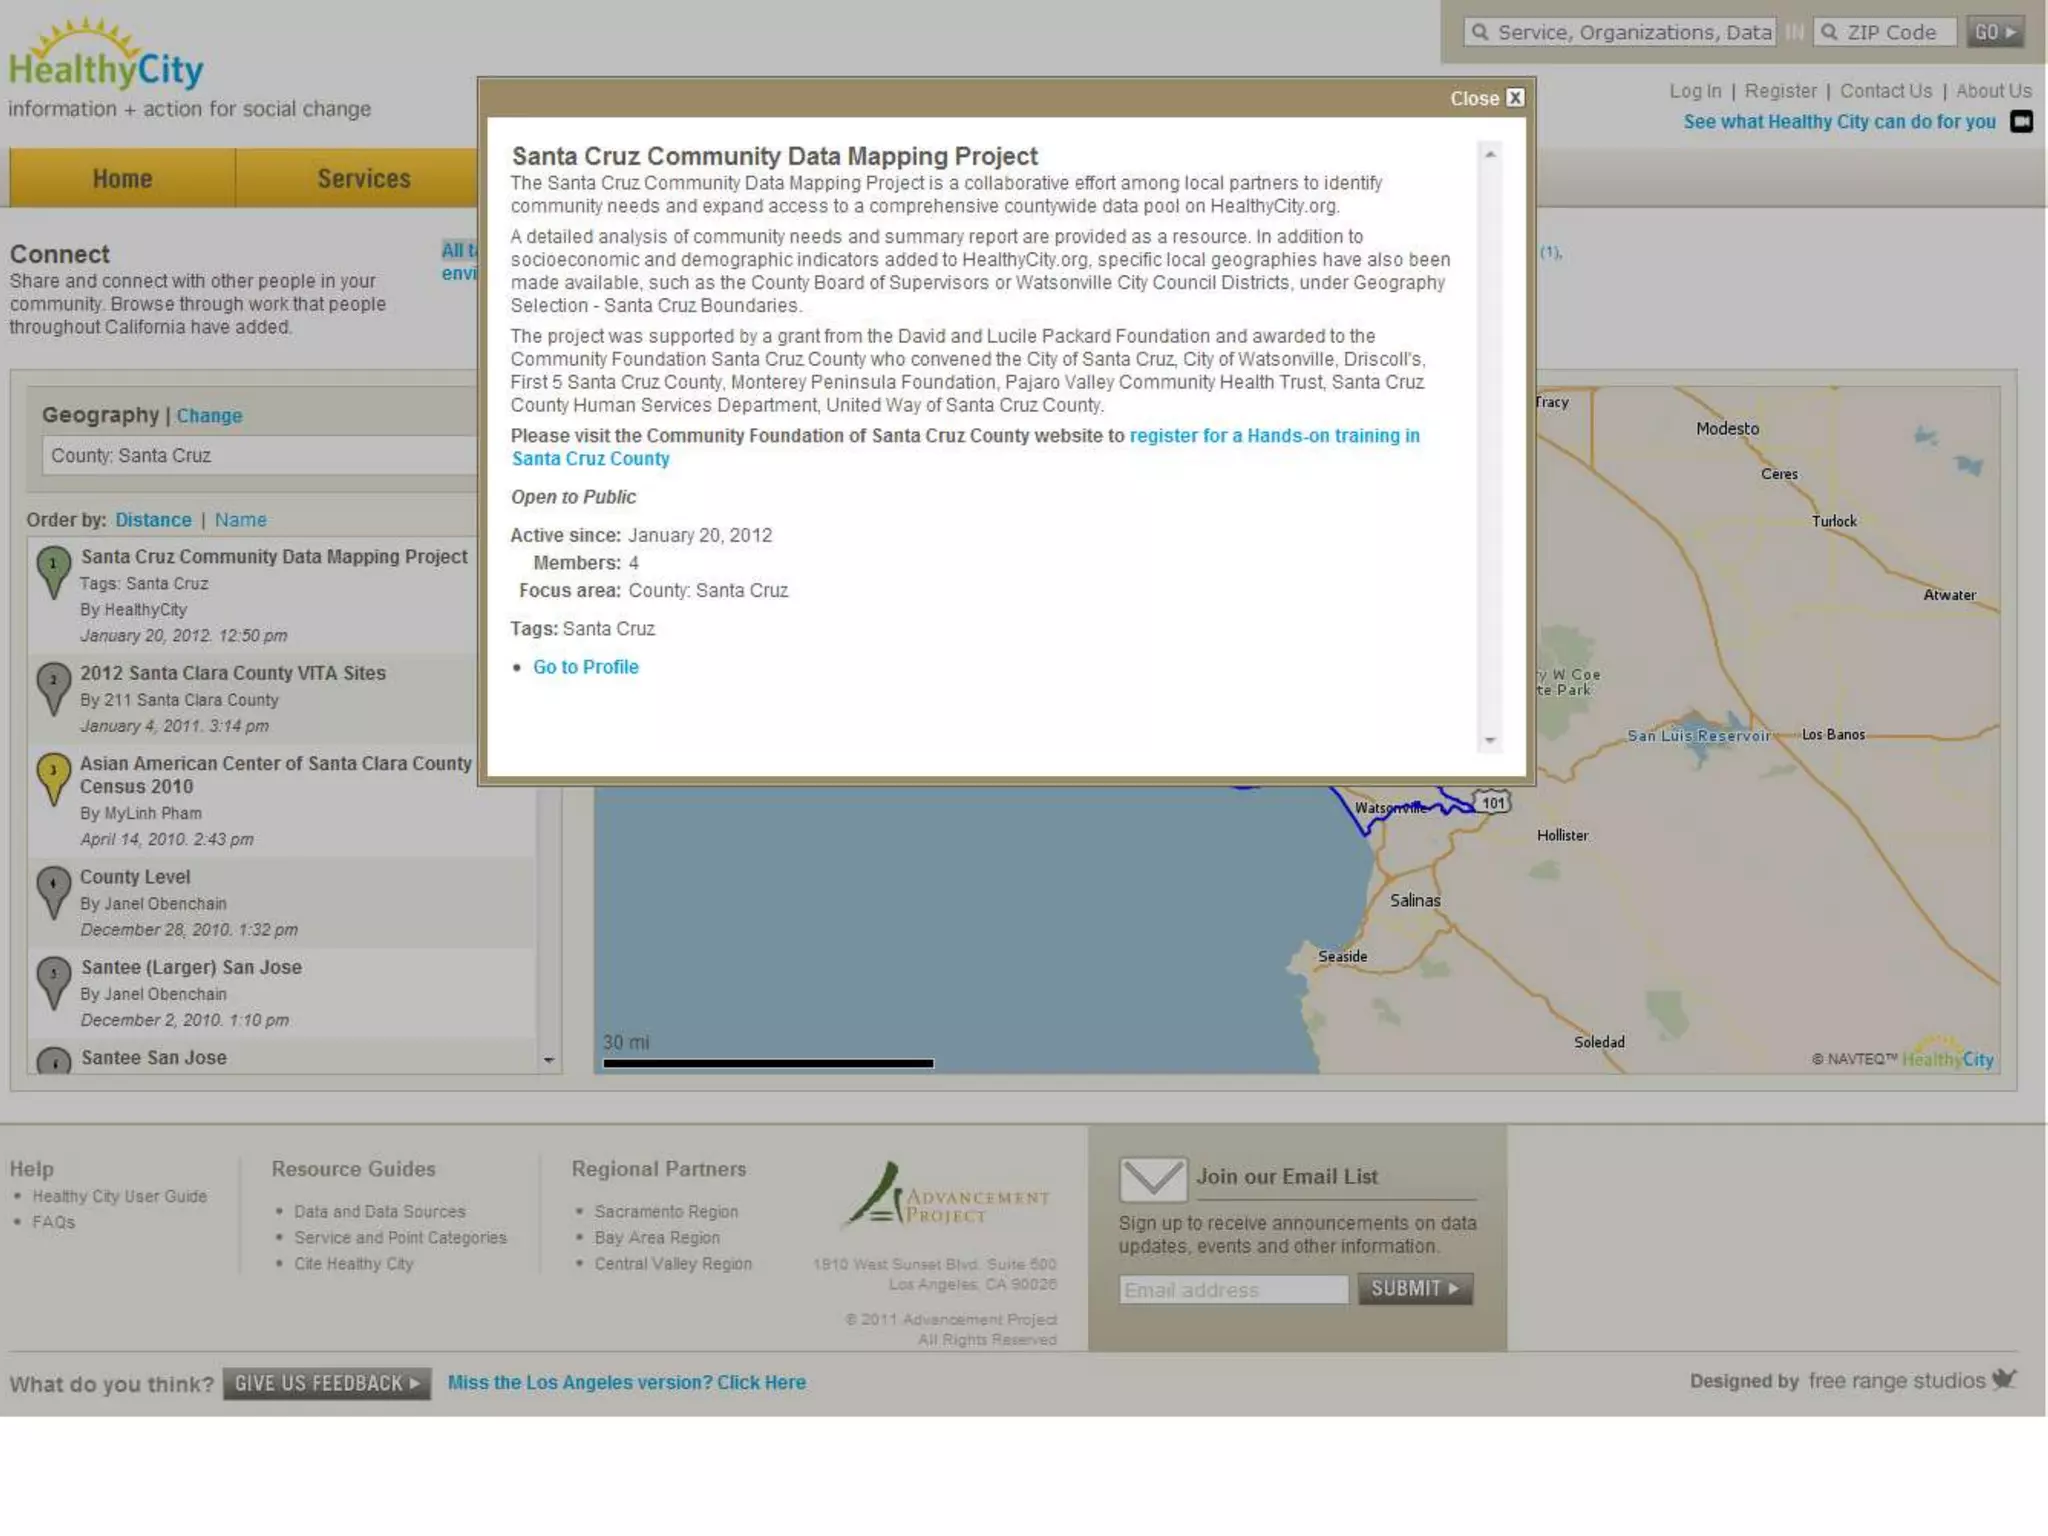
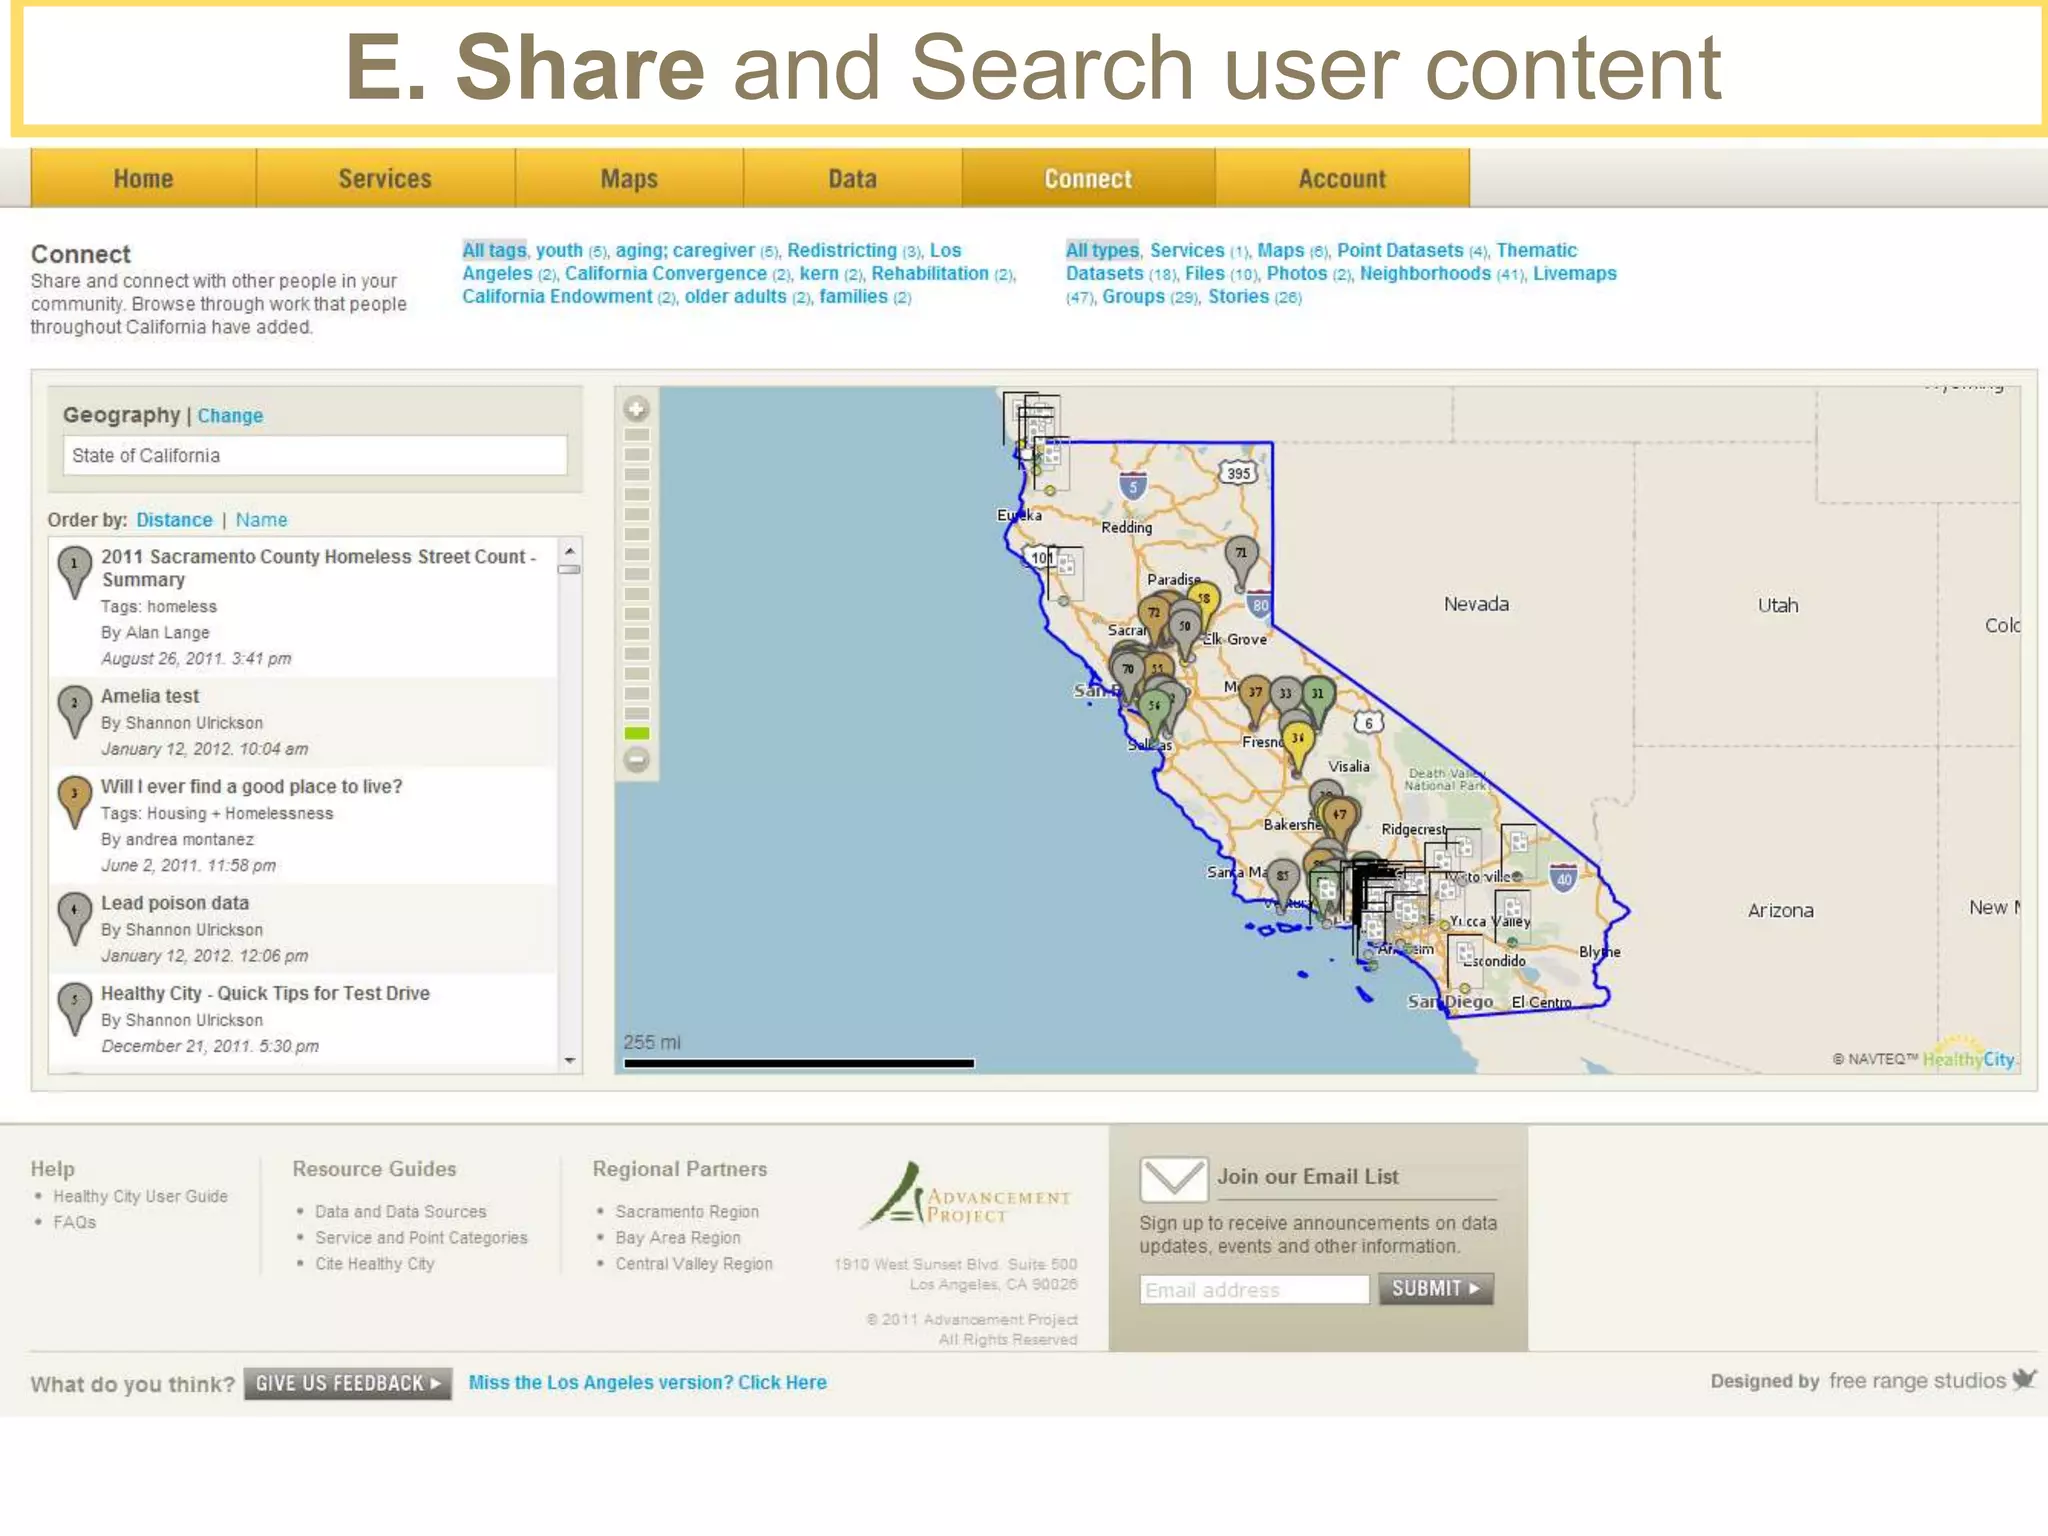
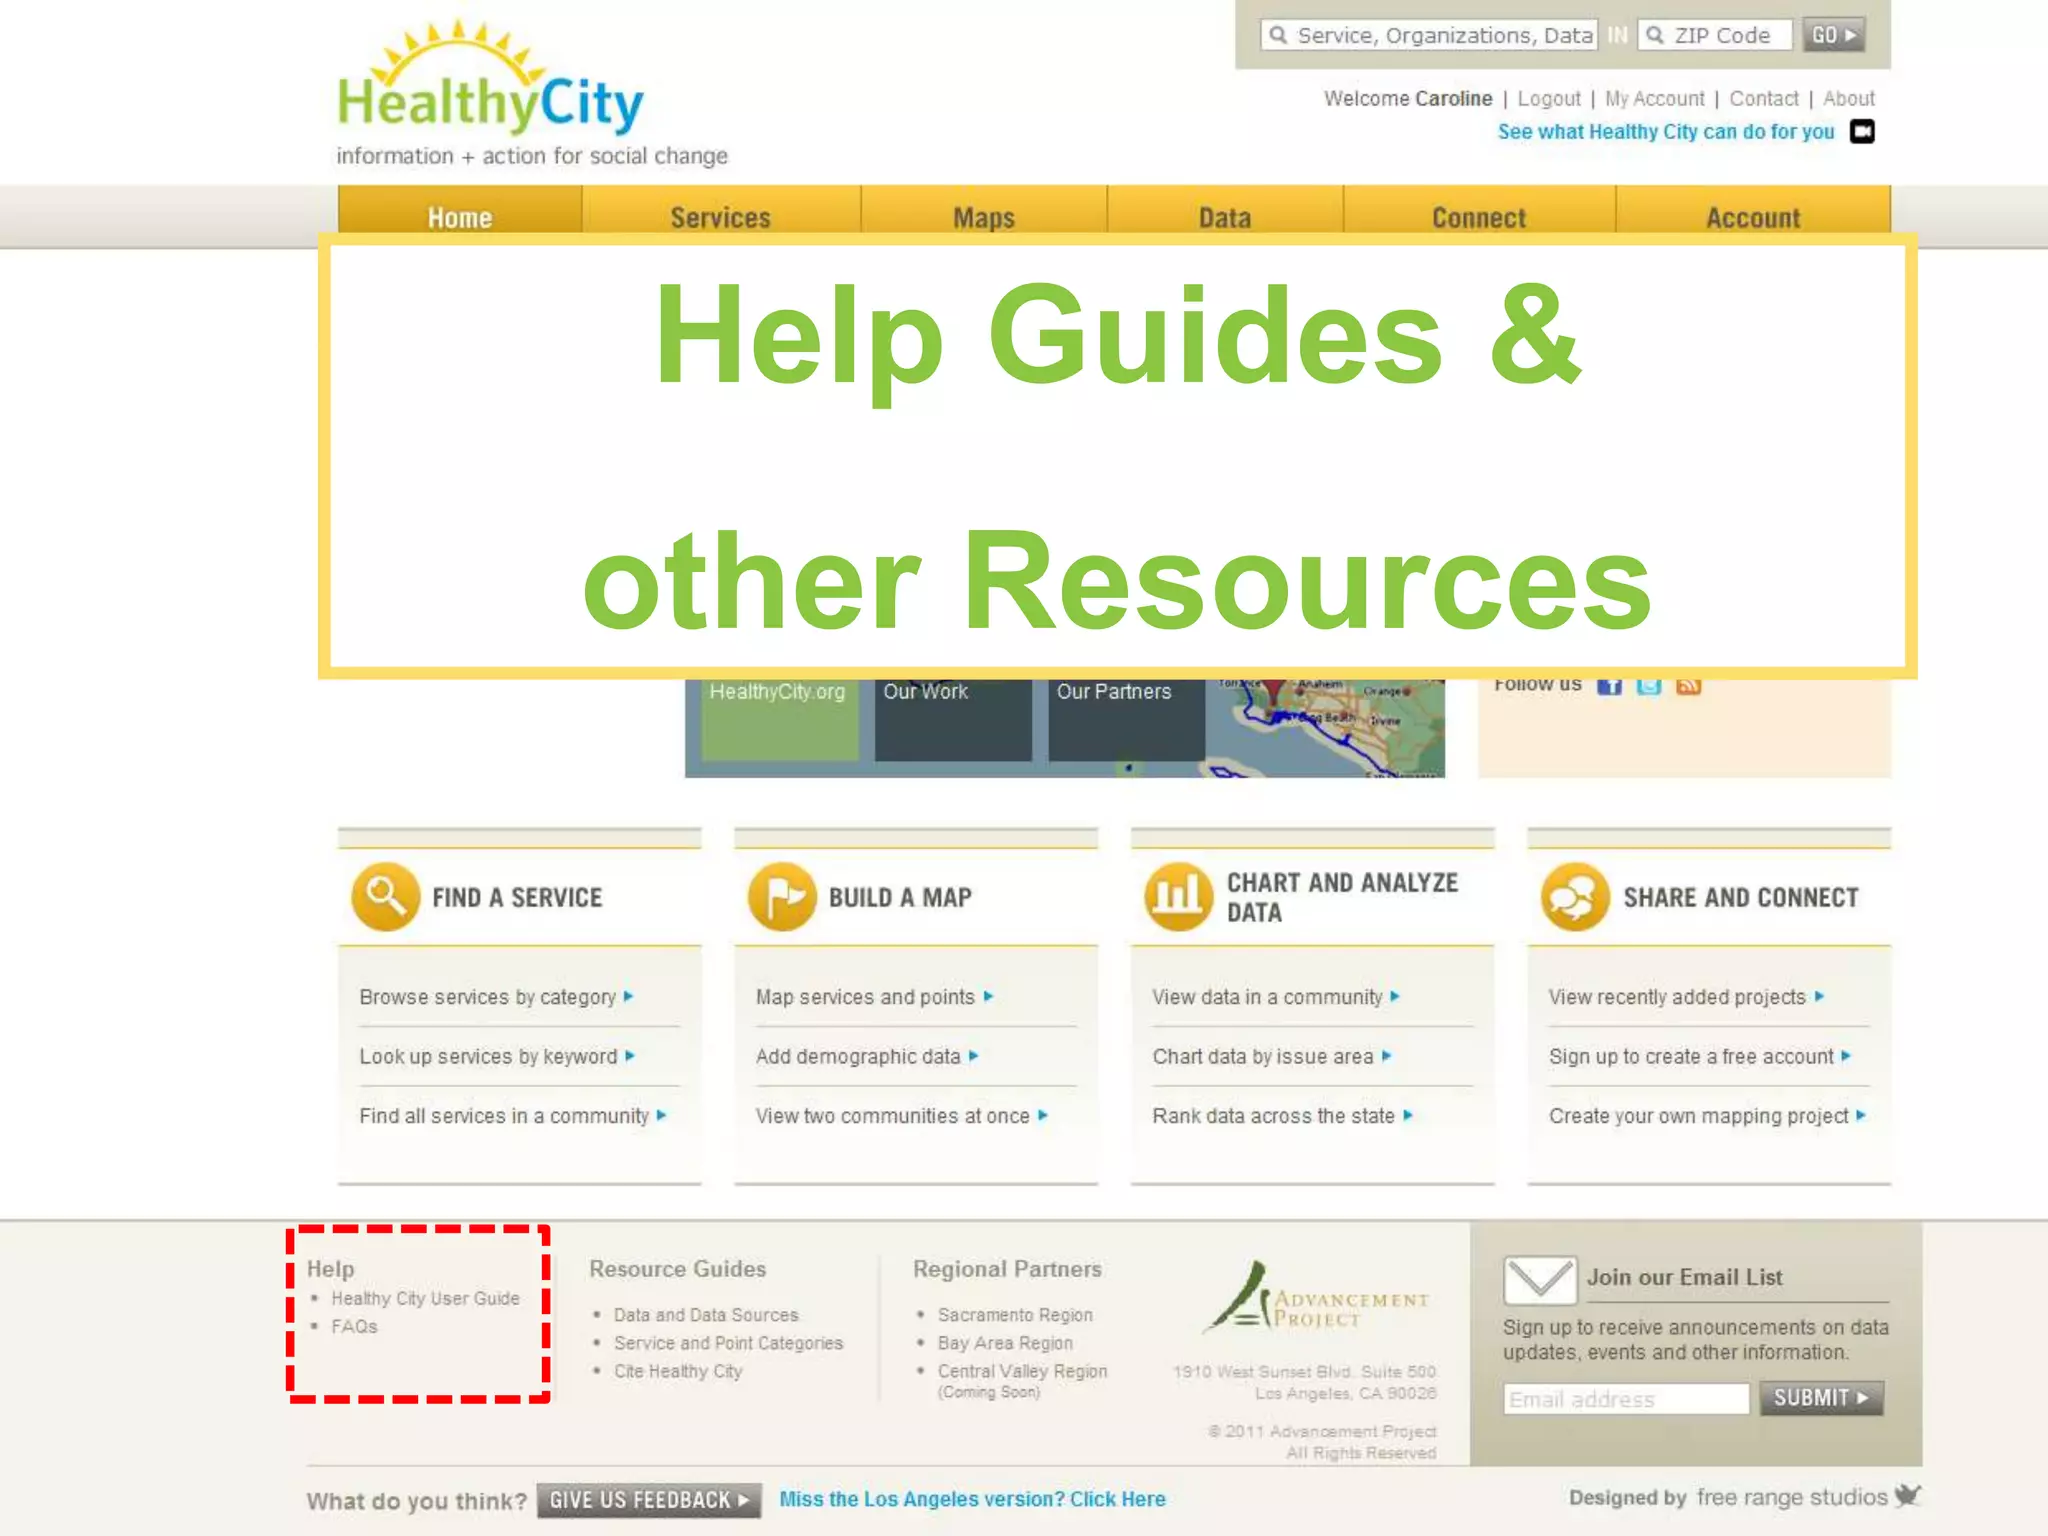
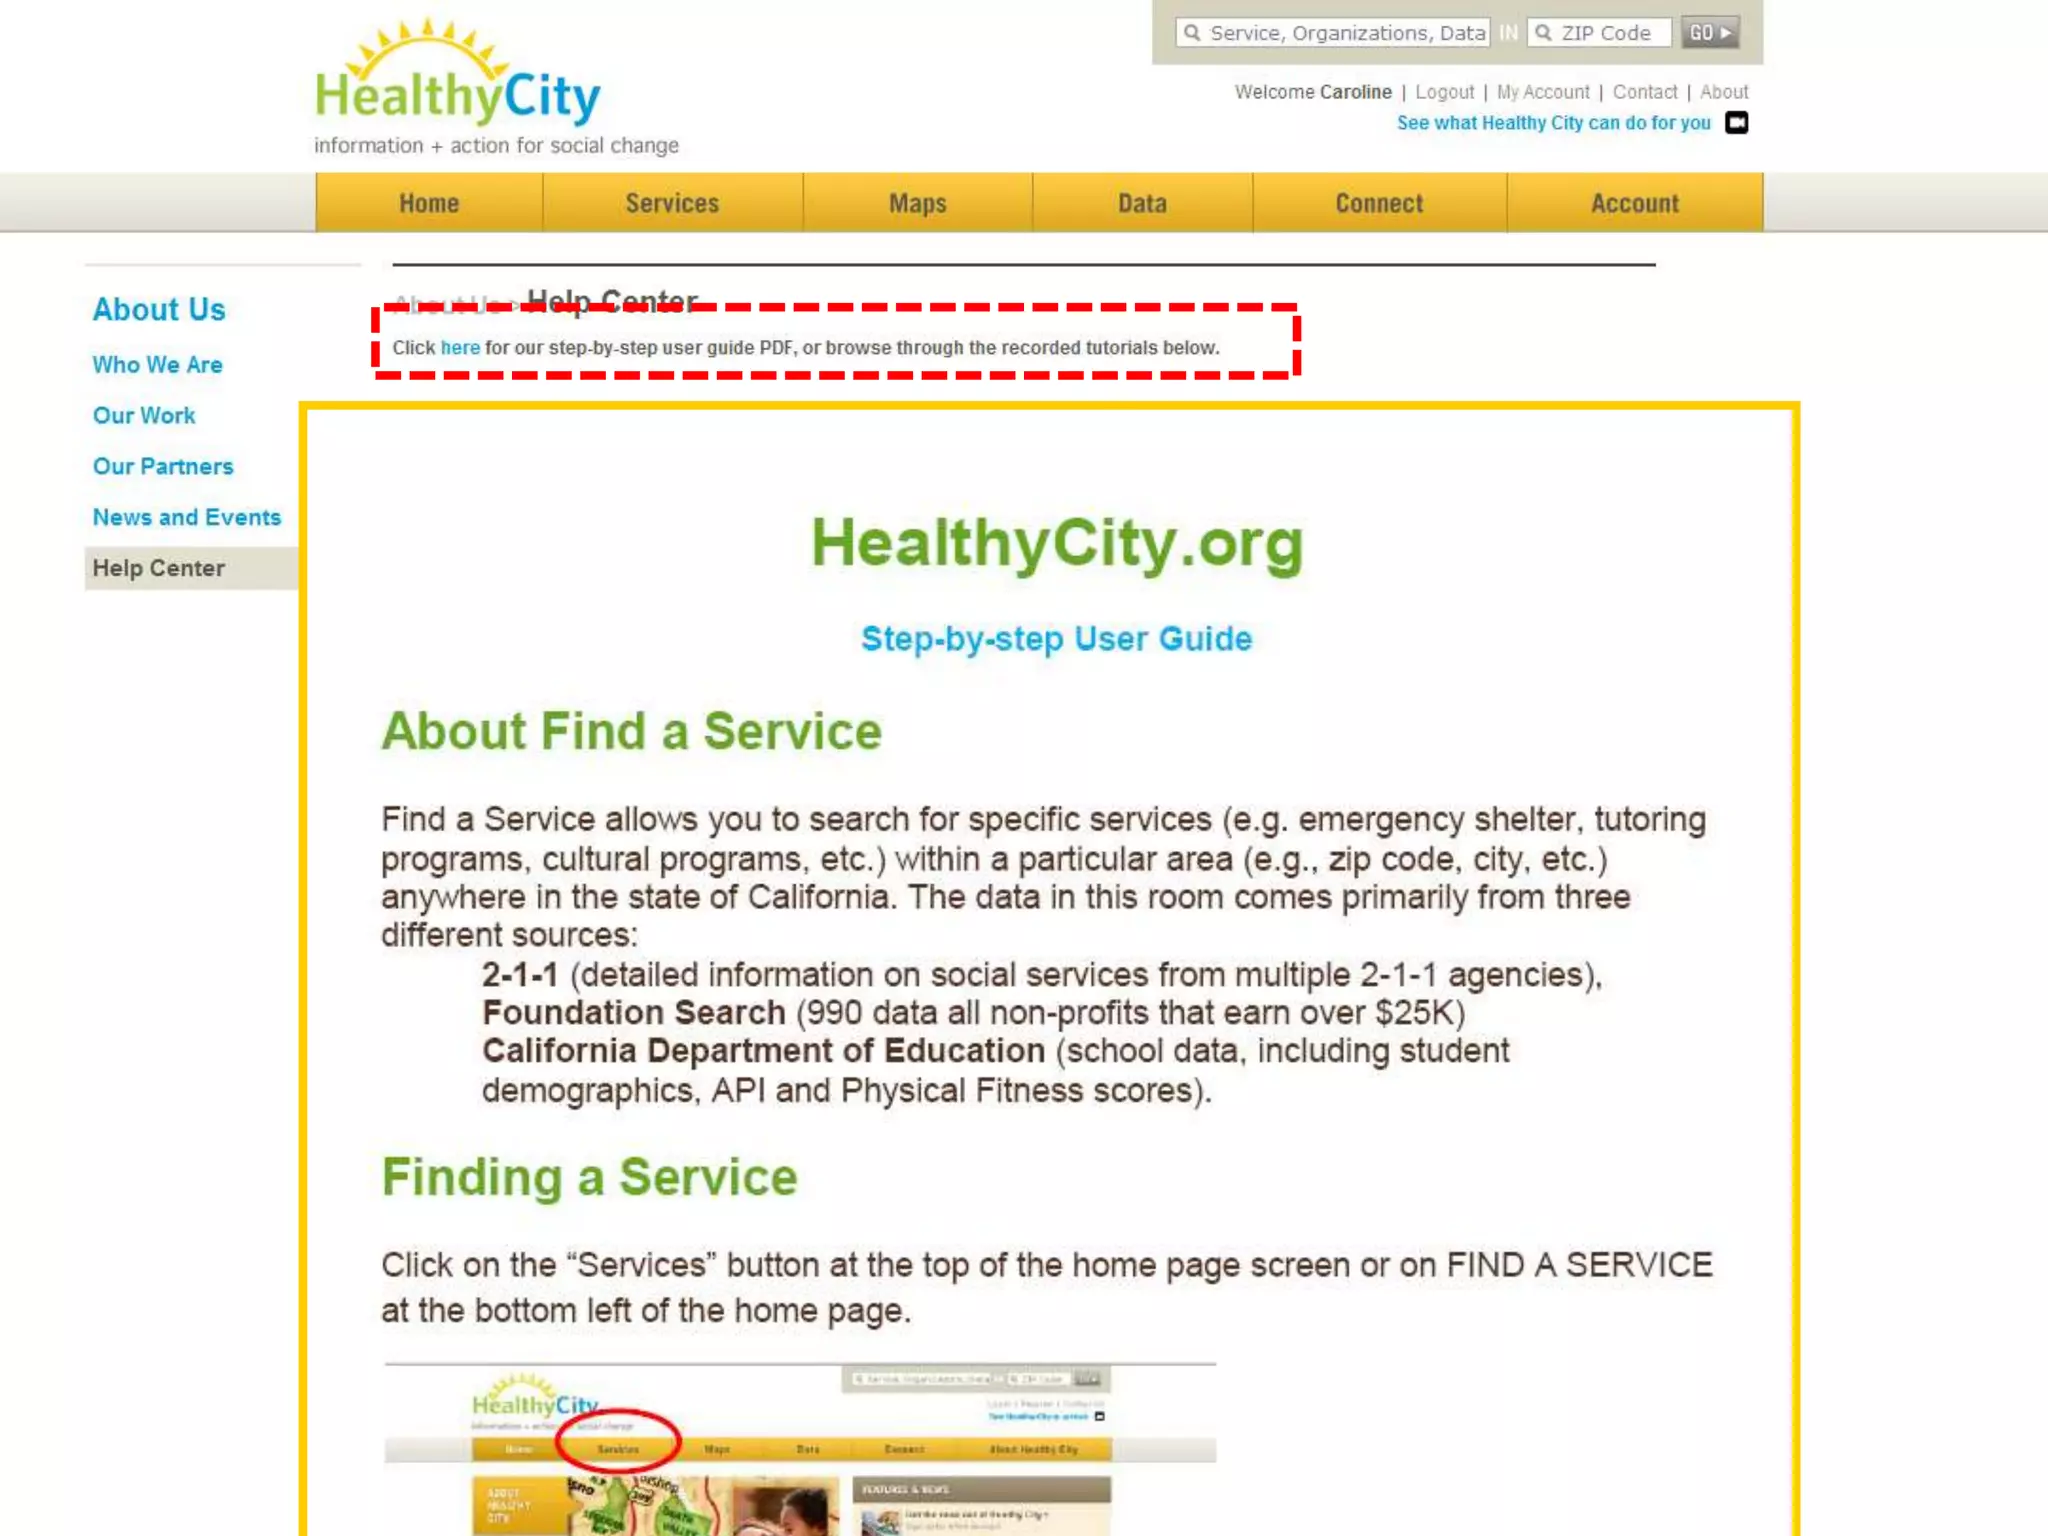
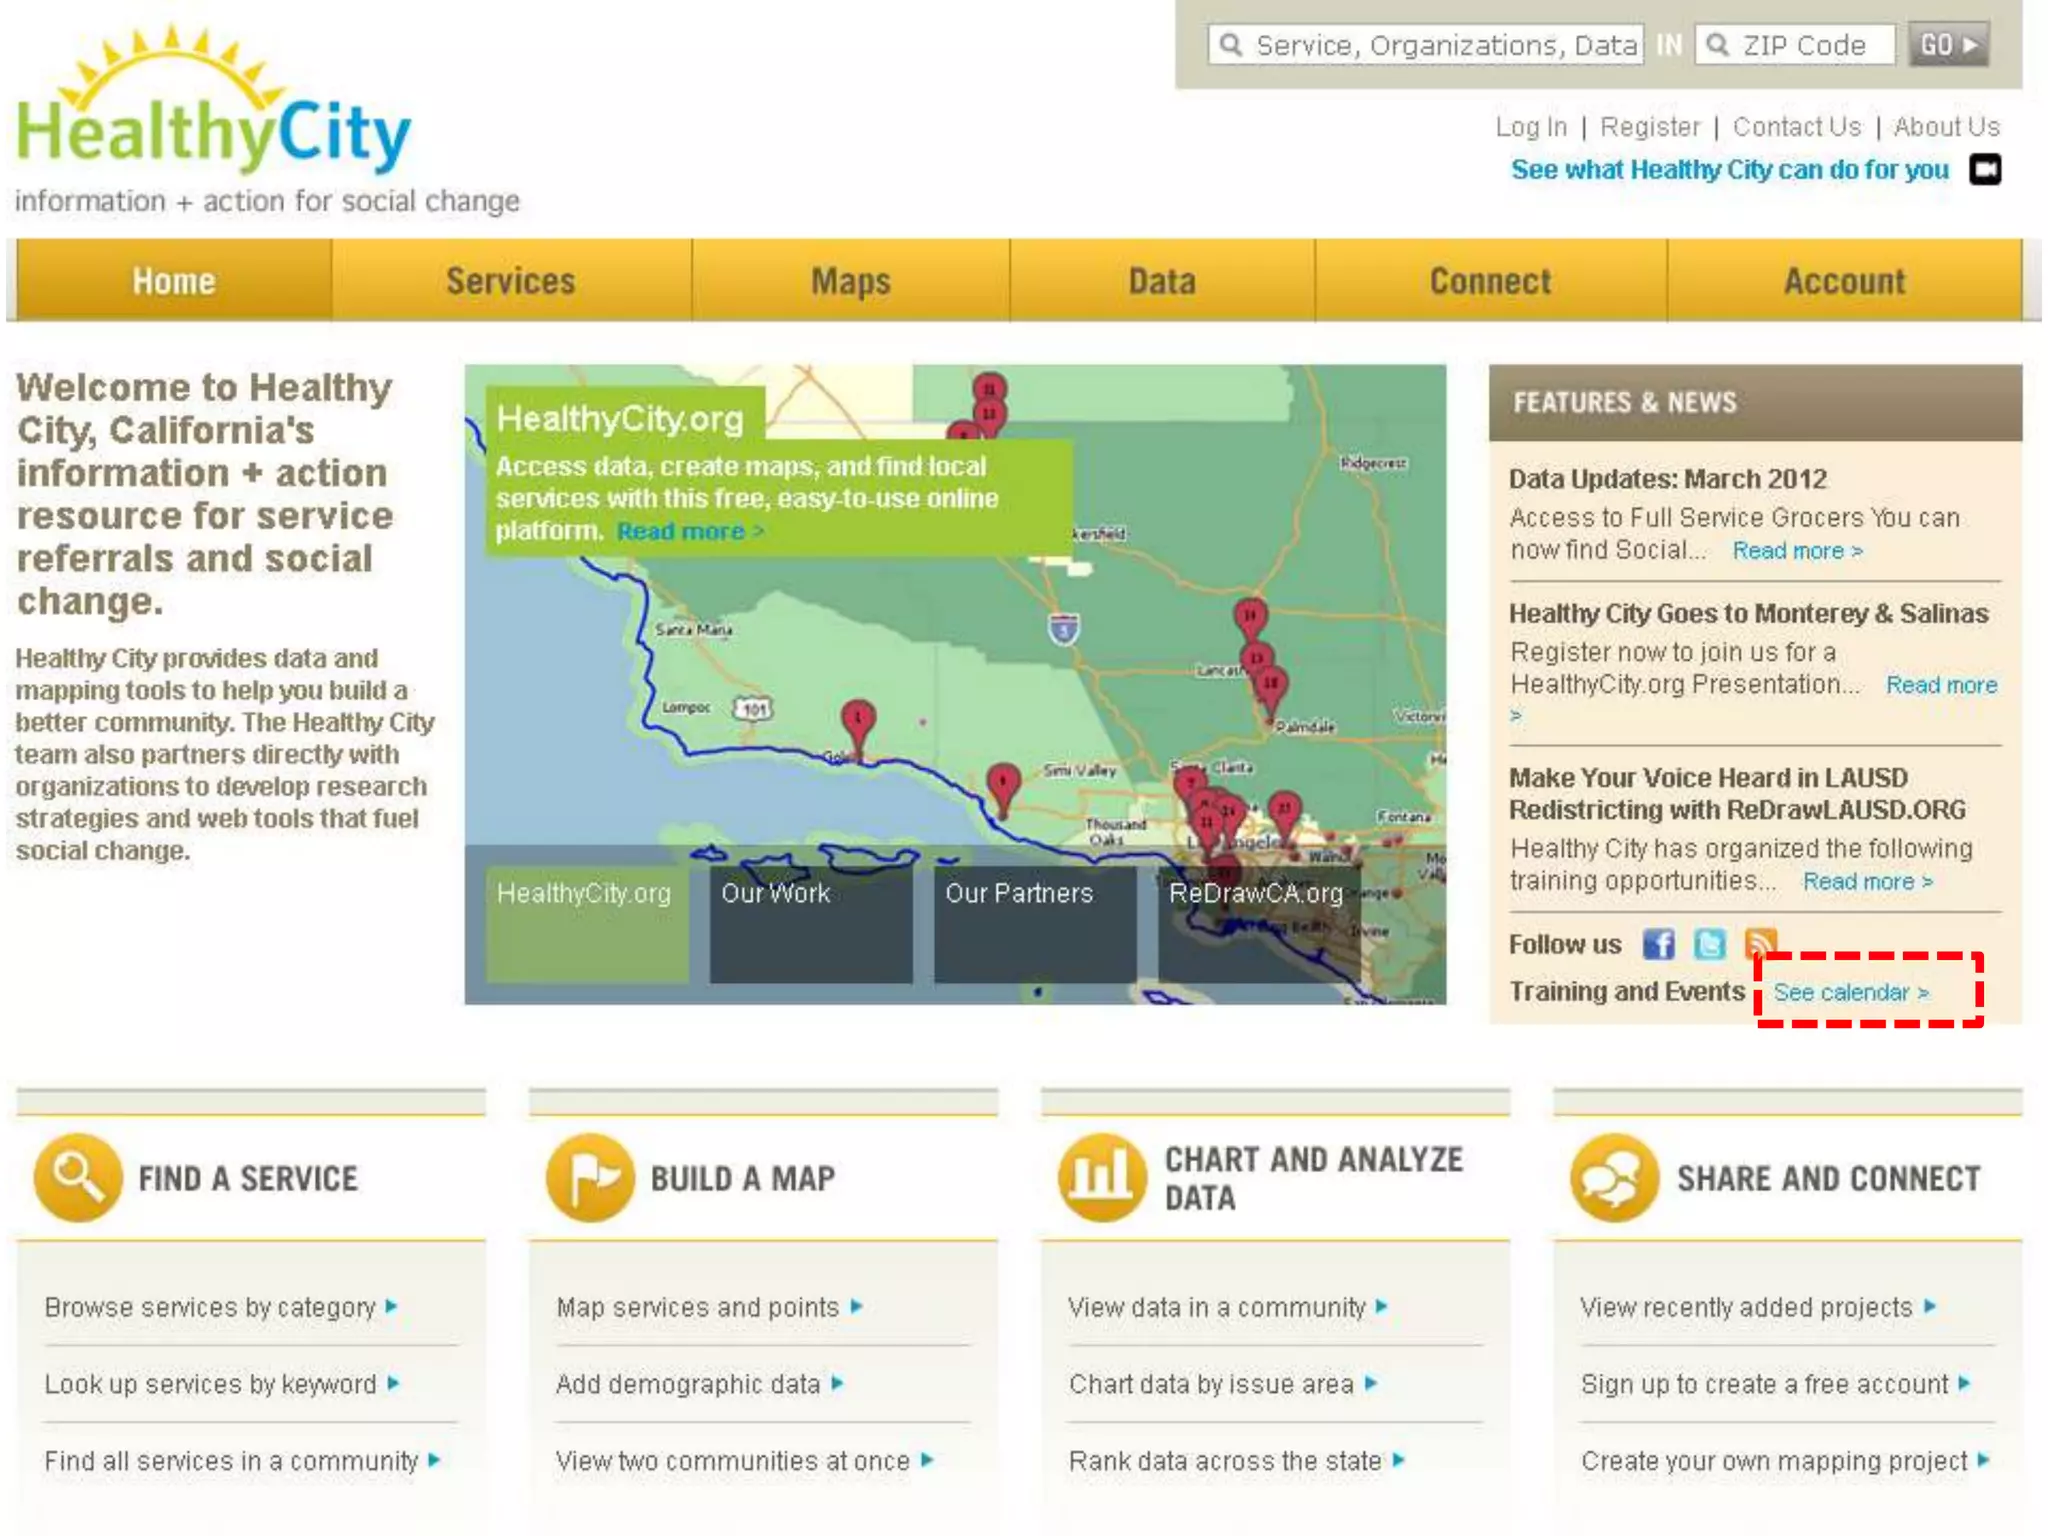

The document serves as an introductory training resource for the Healthy City project, a civil rights initiative in California, aimed at empowering communities with data tools for social change. It provides guidance on accessing and customizing community data, mapping education and health statistics, and registering for free accounts to enhance advocacy efforts. Users can utilize various features including live mapping, uploading datasets, and creating narratives to support their initiatives.