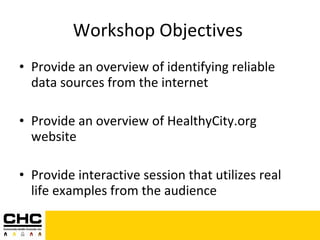
1) The document discusses a workshop on using data from the internet to assist community health workers in their work.
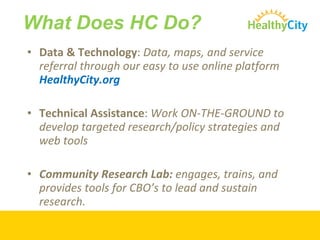
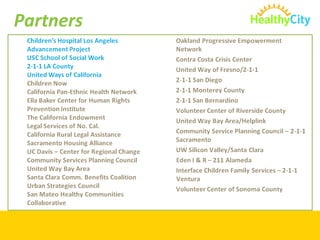
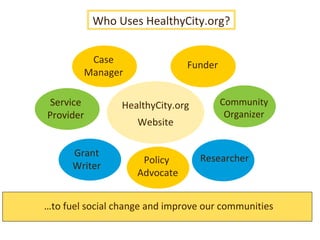
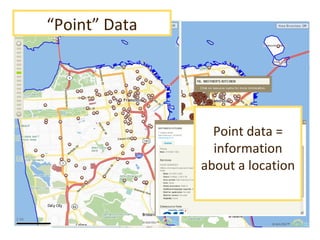
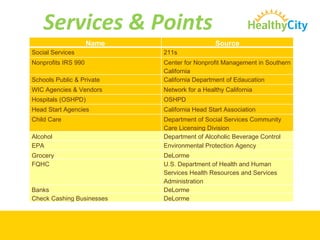
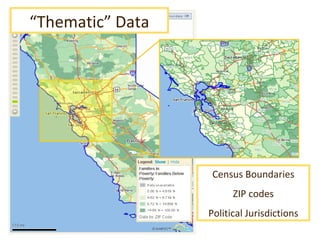
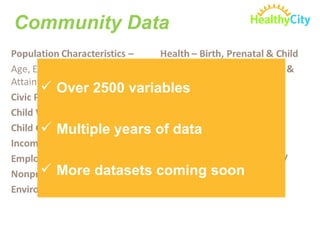
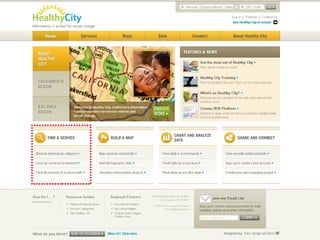
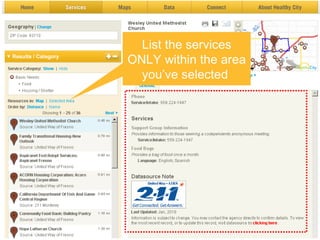
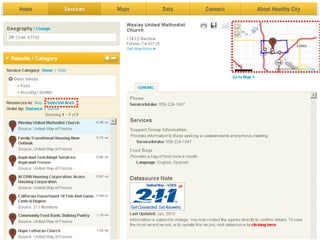
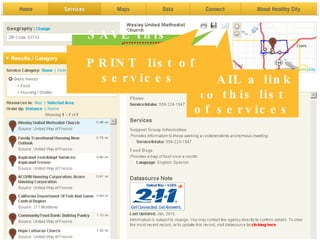
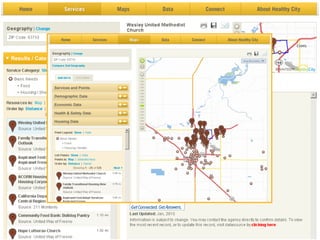
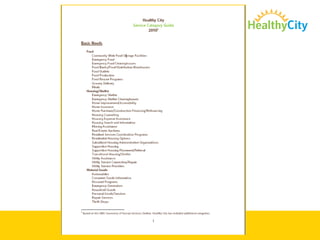
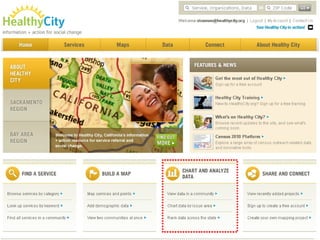
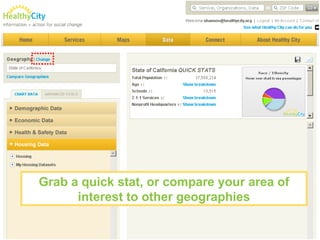
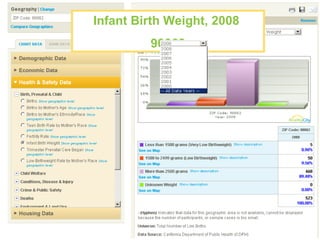
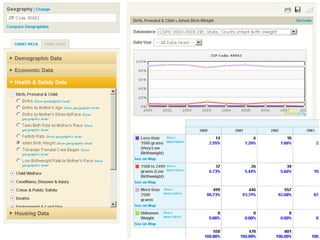
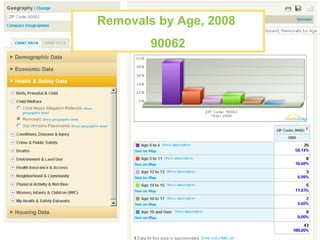
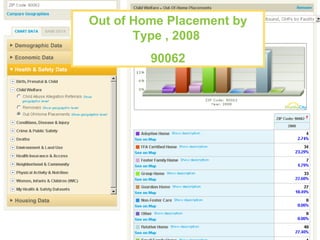
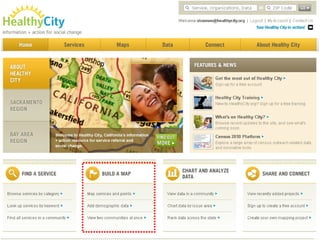
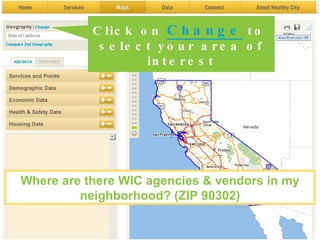
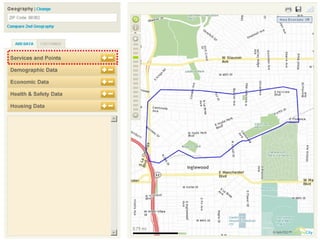
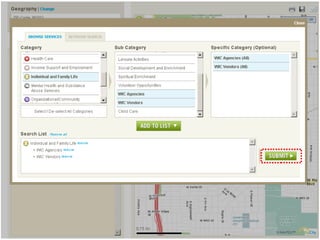
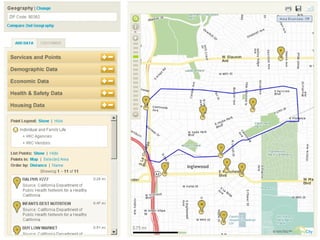
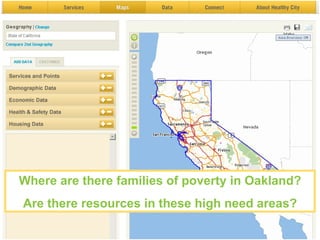
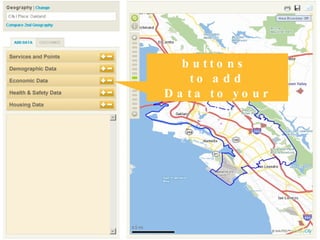
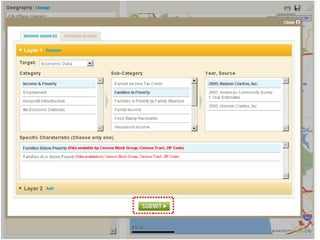
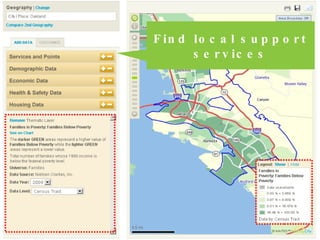
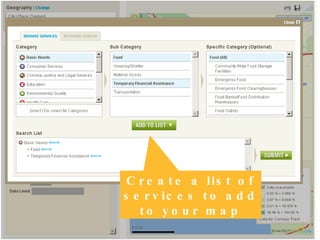
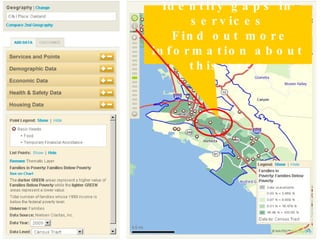
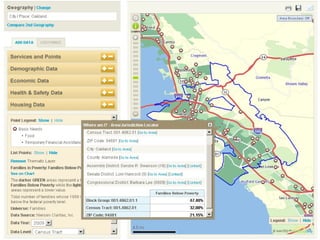
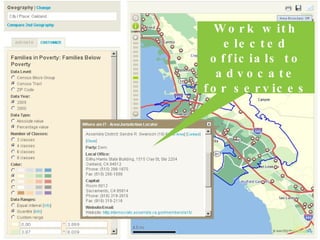
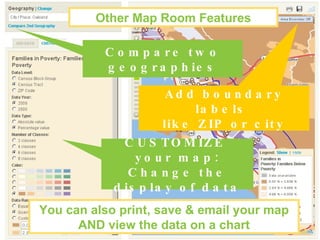
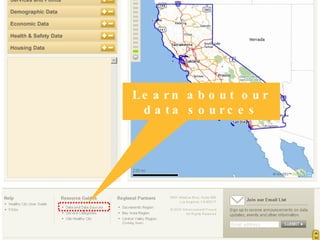
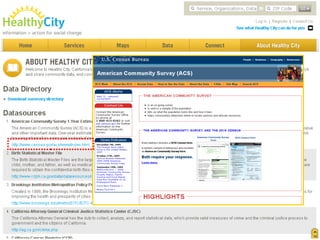
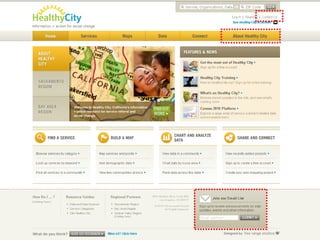
2) It introduces the HealthyCity.org website as a resource for finding local data and services to address community health needs.
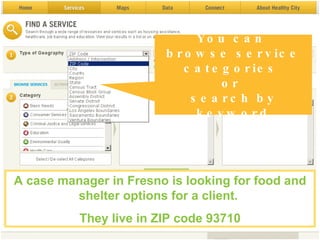
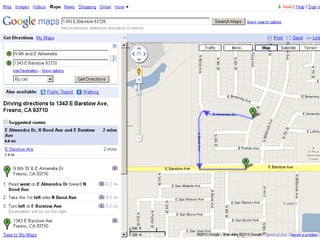
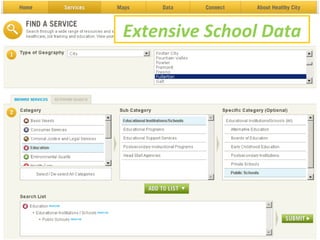
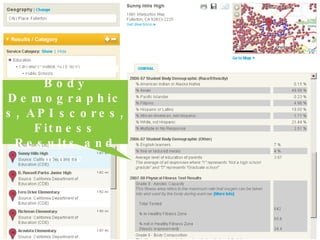
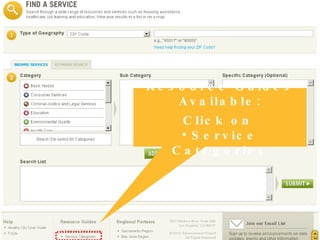
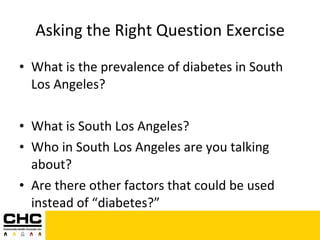
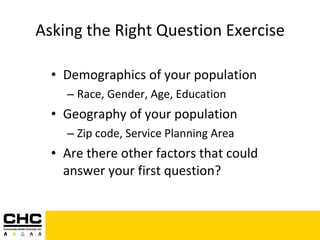
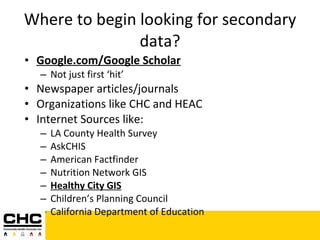
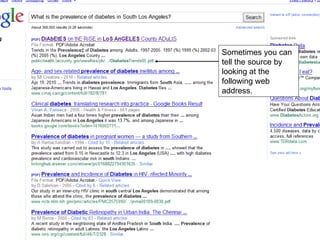
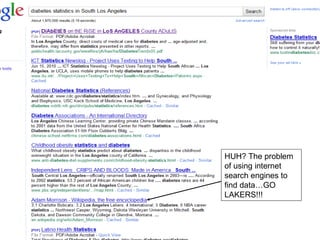
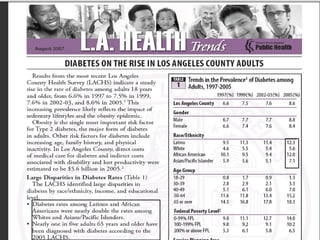
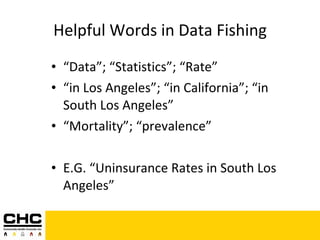
3) The workshop provides tips on how to effectively search for reliable data online, including asking focused questions and knowing what types of keywords and sources are most useful.

![Questions? Feel free to contact me at: Jonathan Nomachi Community Health Councils 323.295.9372 [email_address]](https://image.slidesharecdn.com/120310promotorascombined-101013185309-phpapp01/85/120310-promotorascombined-15-320.jpg)