Downloaded 10 times


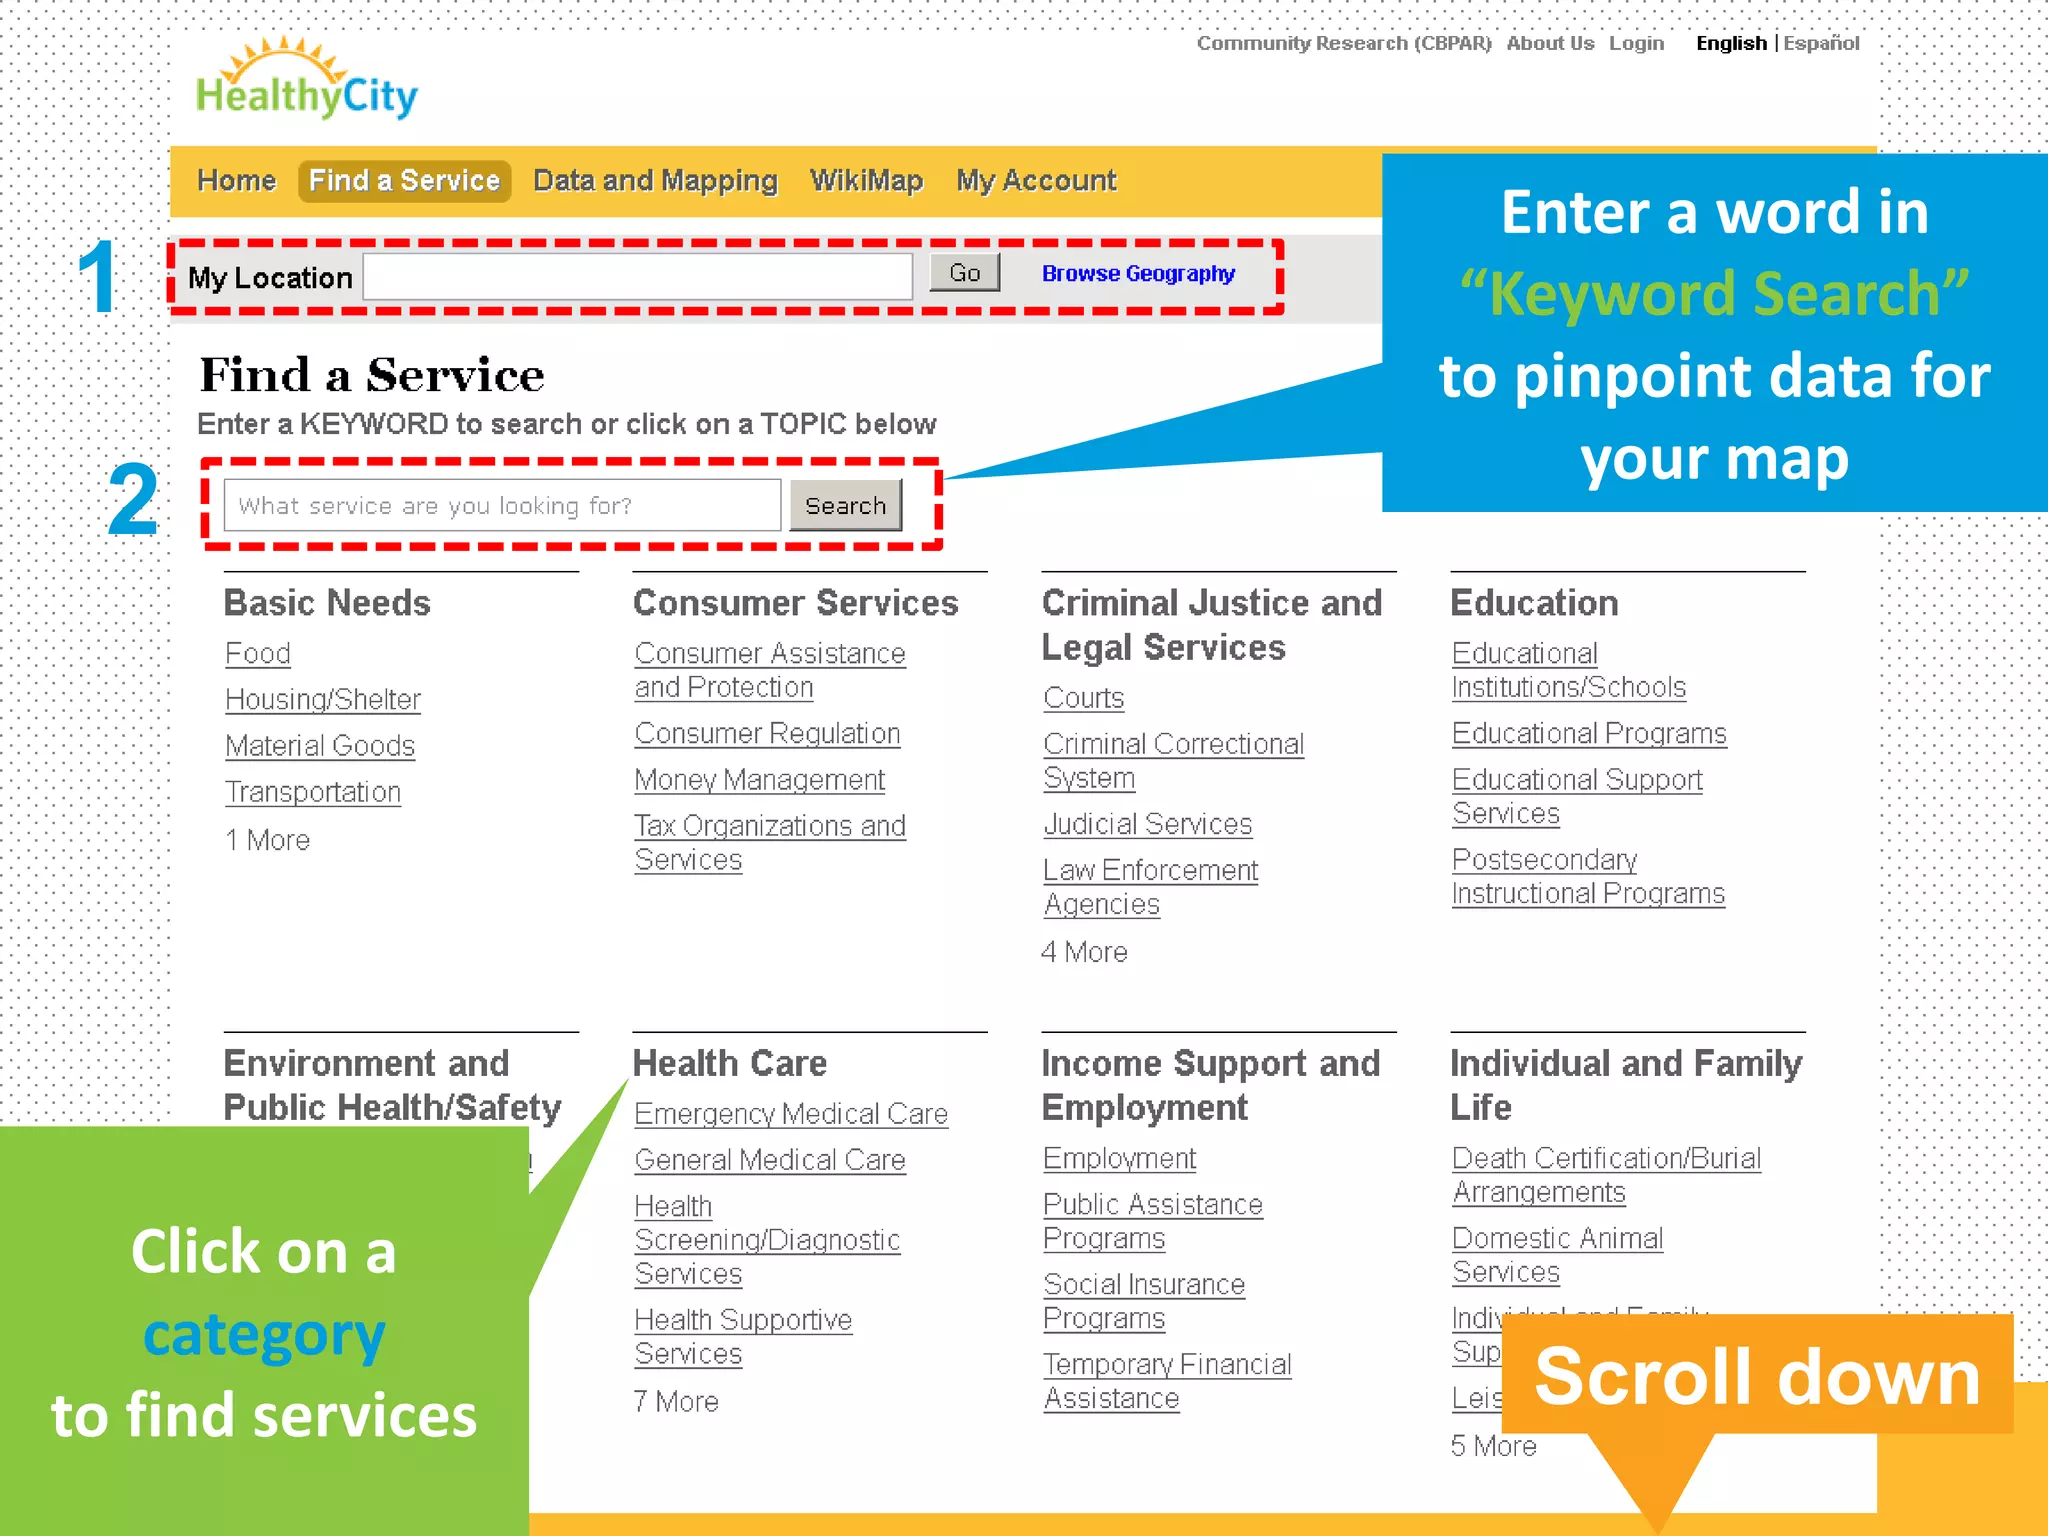
![A quantitative analysis of diabetes prevalence in
Hispanics
2001- 2010 NHANES (CDC)
Nationally representative sample
US/foreign-born Mexican Americans ages 20-65
Tested for diabetes (n= 2417)
Fasting blood glucose test
Nativity (US-born/foreign-born)
Acculturation (Length of time [years] in the US)
STATA
T-test
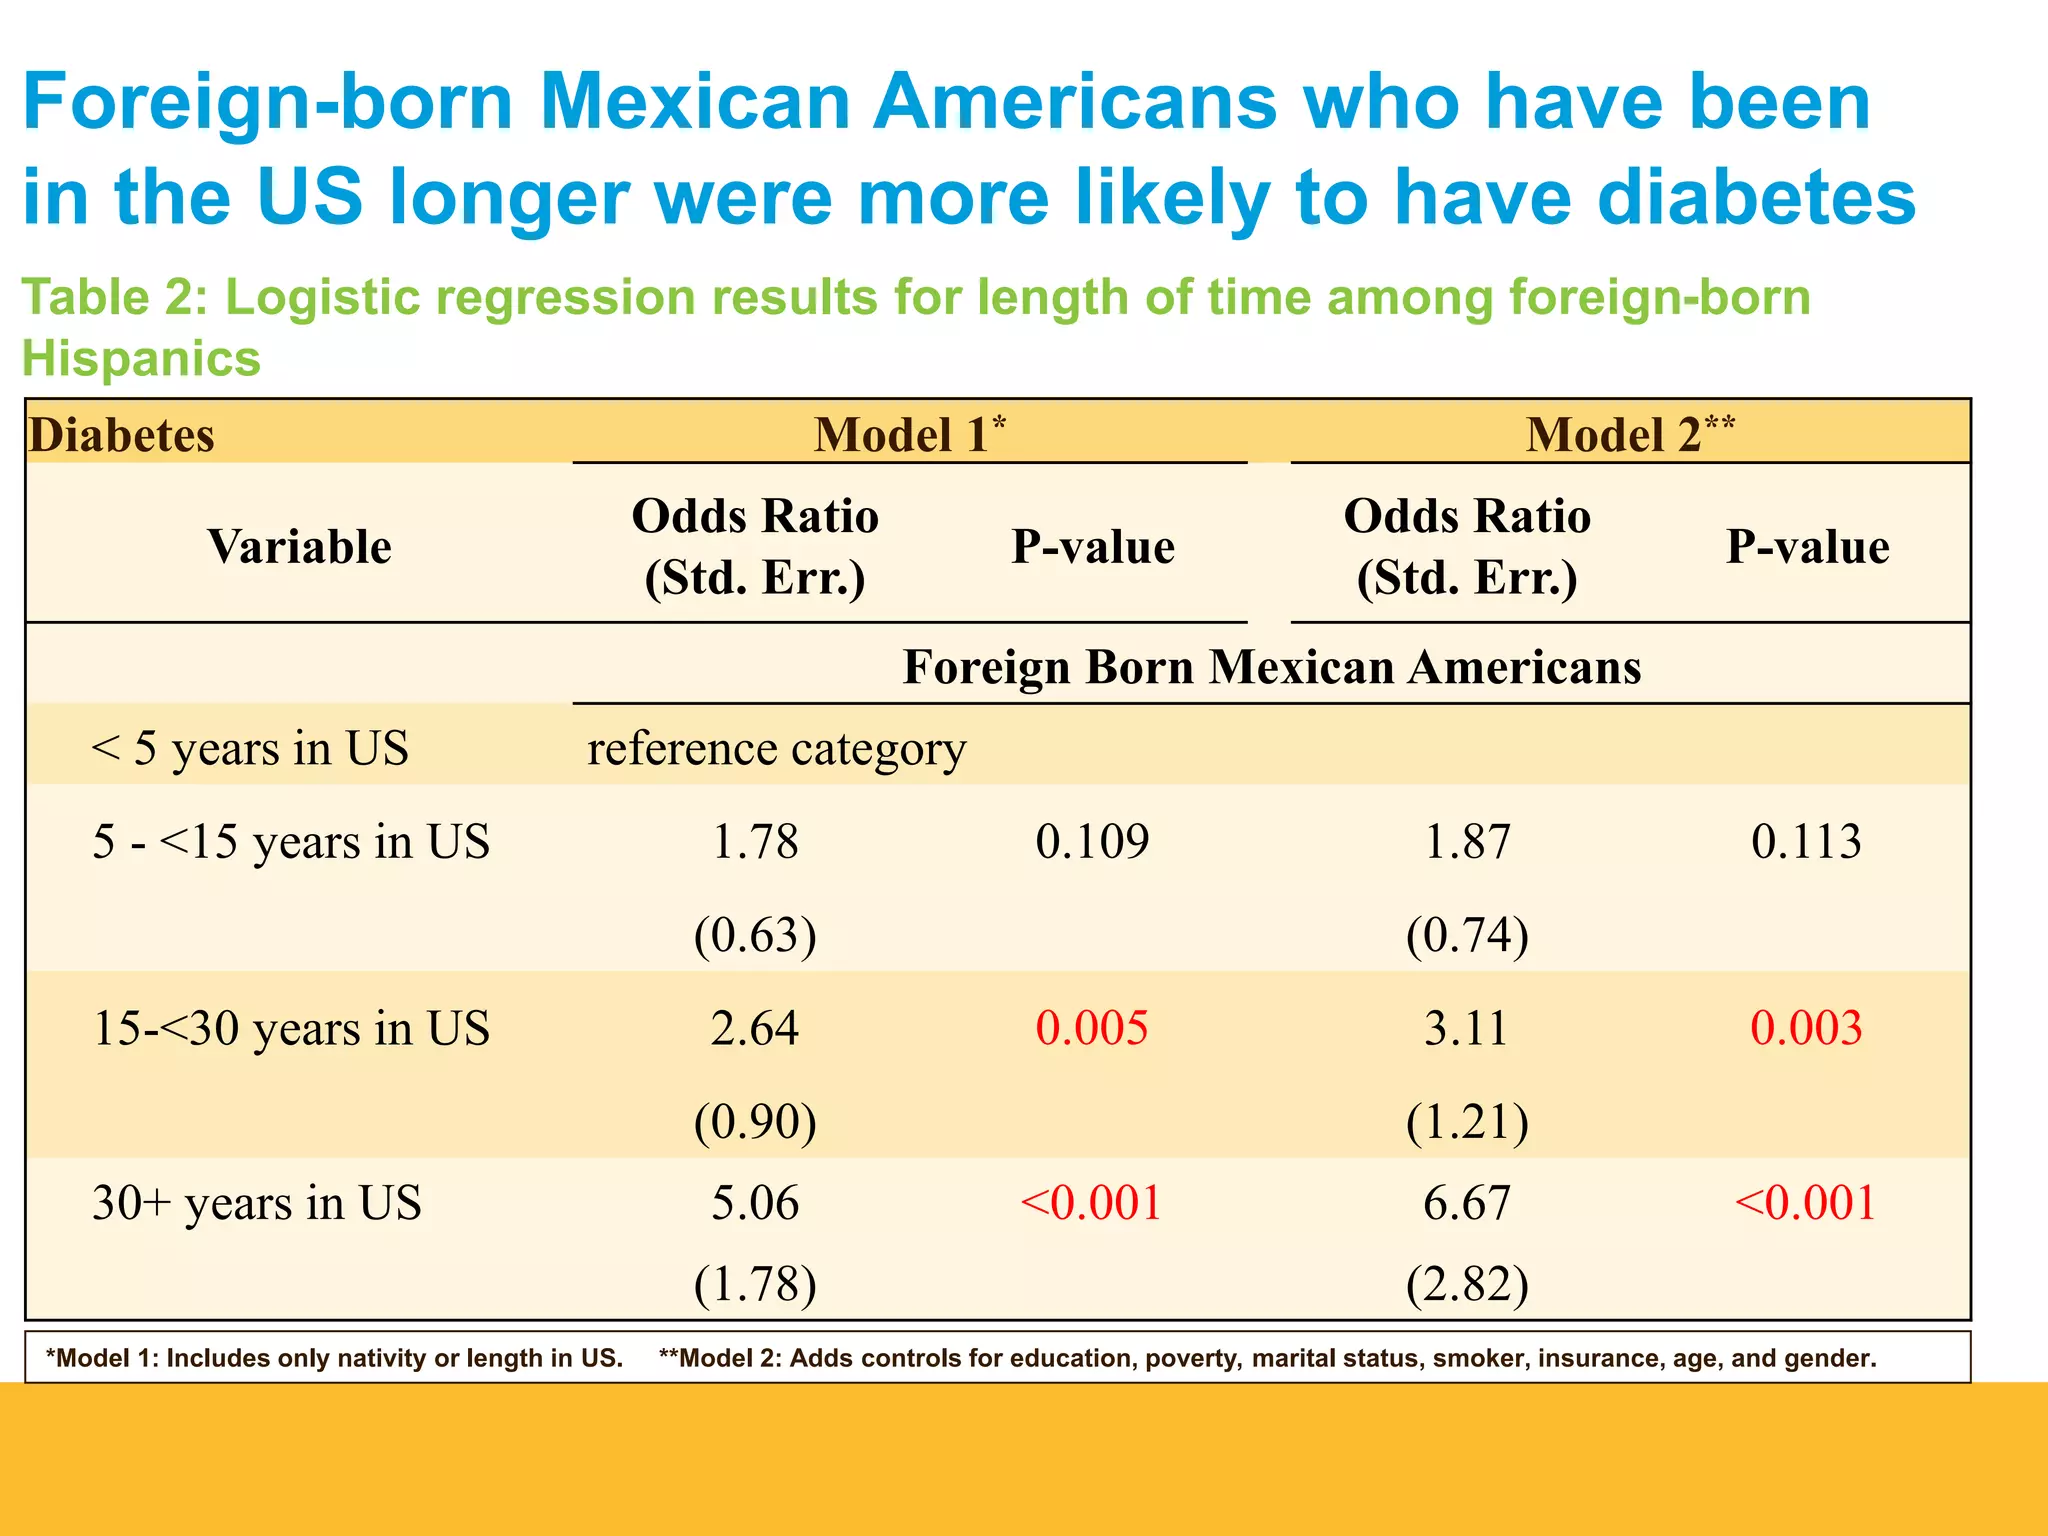
Logistic Regression
Model 1: Basic Differences
Model 2: Control](https://image.slidesharecdn.com/immigranthealthparadoxfinal-140911164547-phpapp02/75/Immigrant-Health-Paradox-12-2048.jpg)


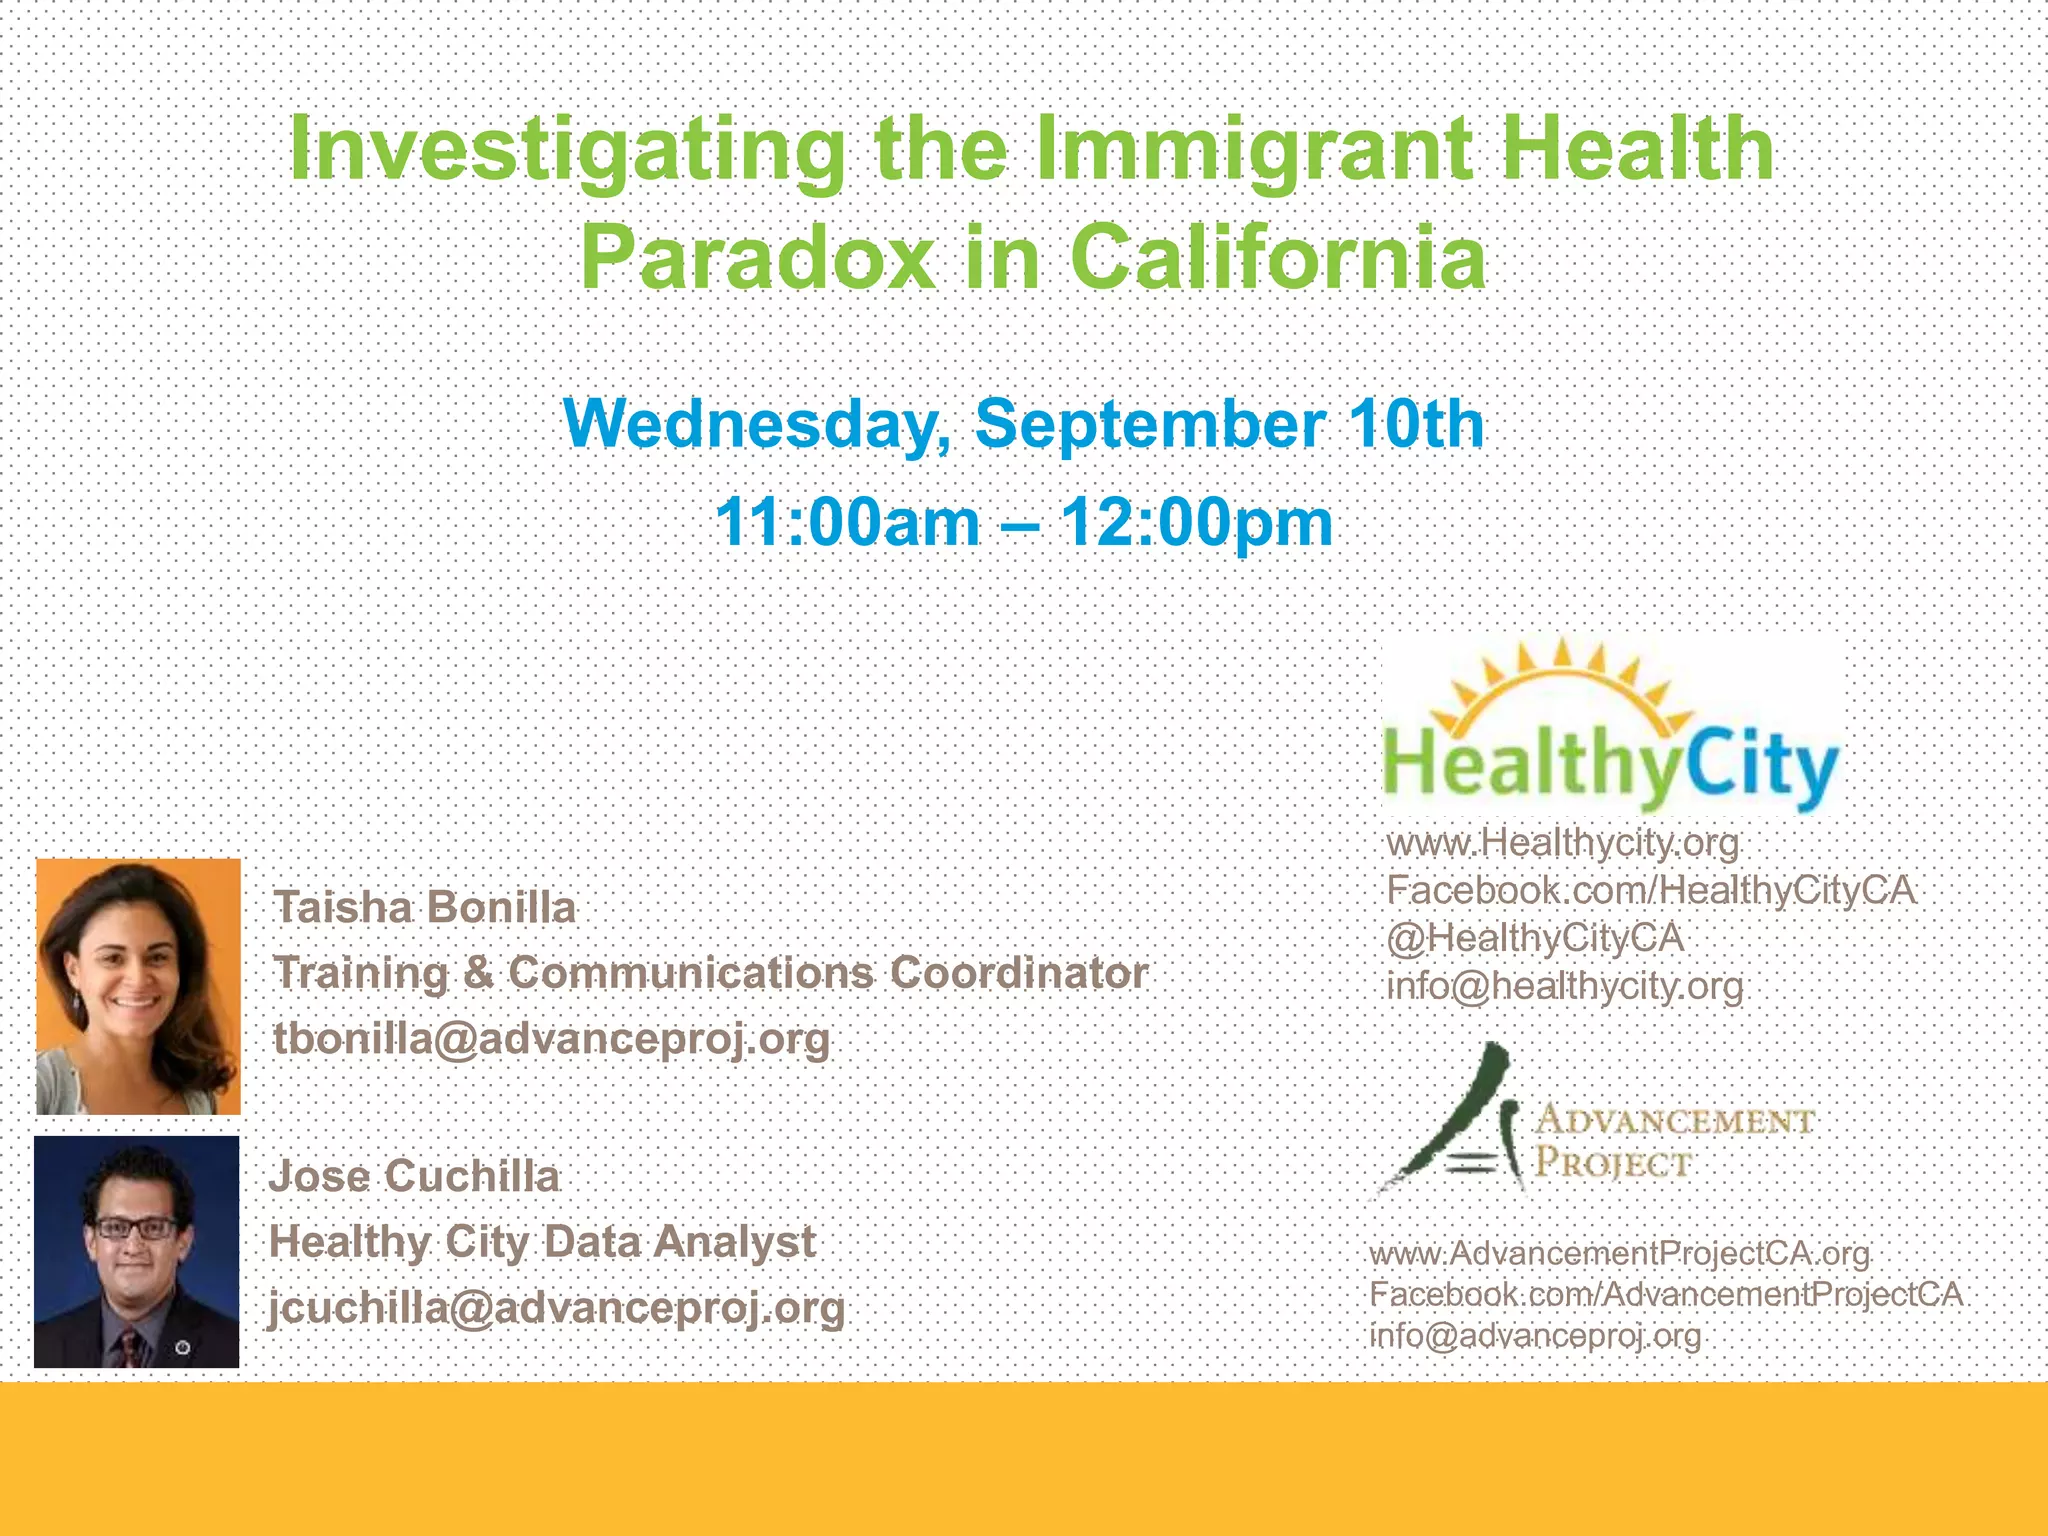
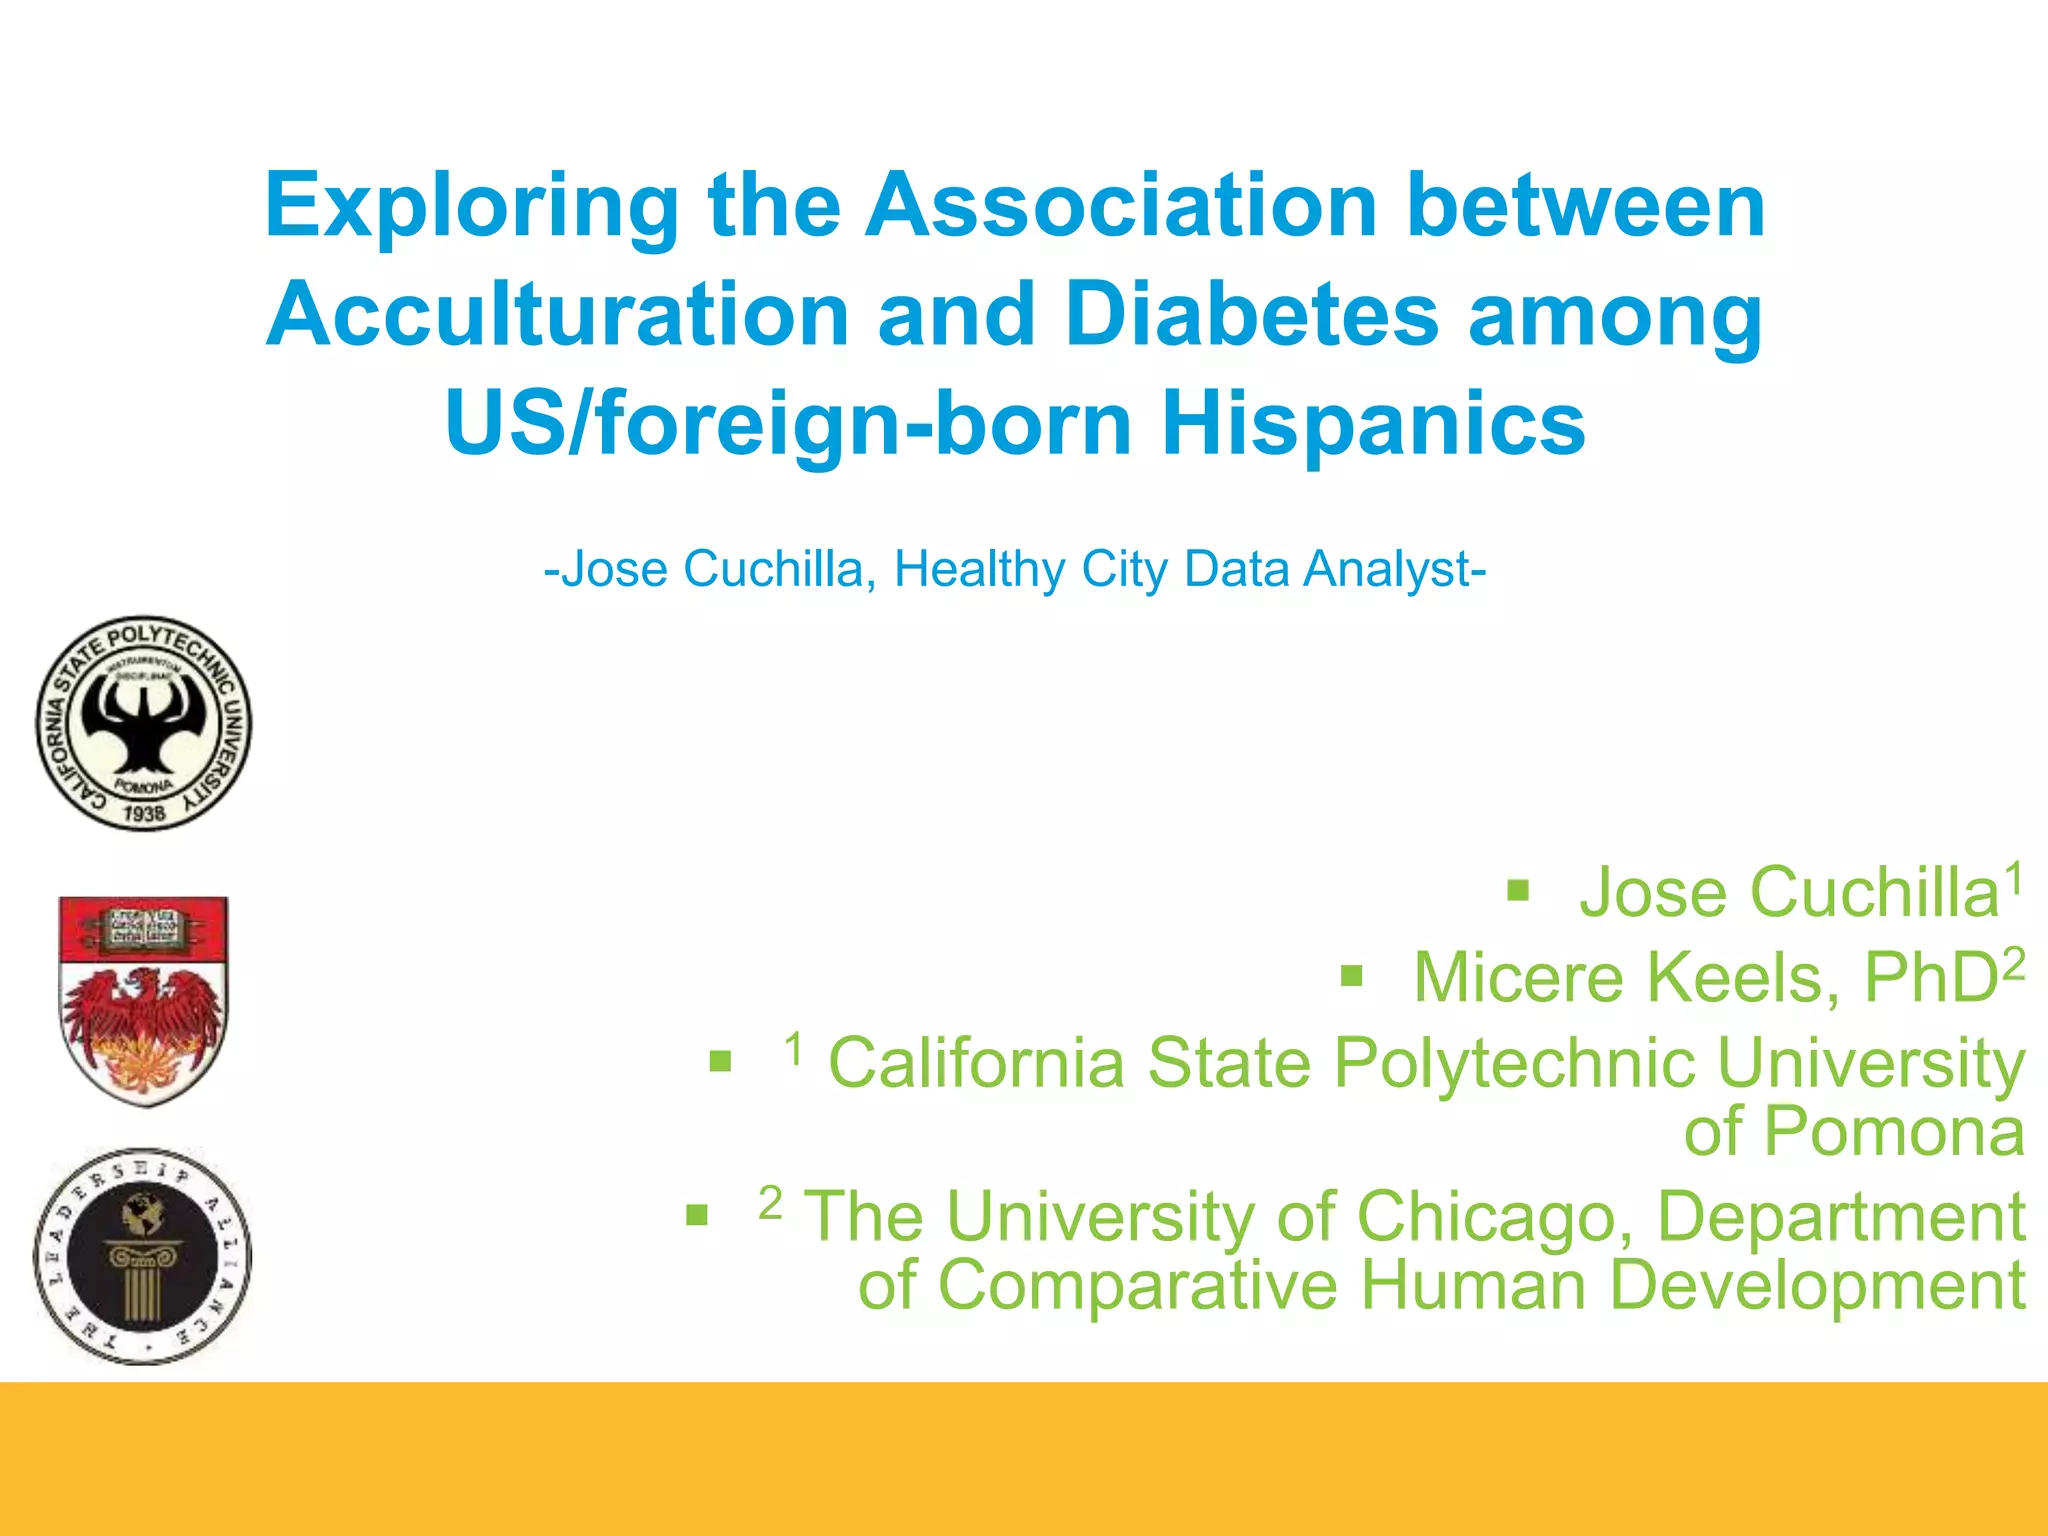
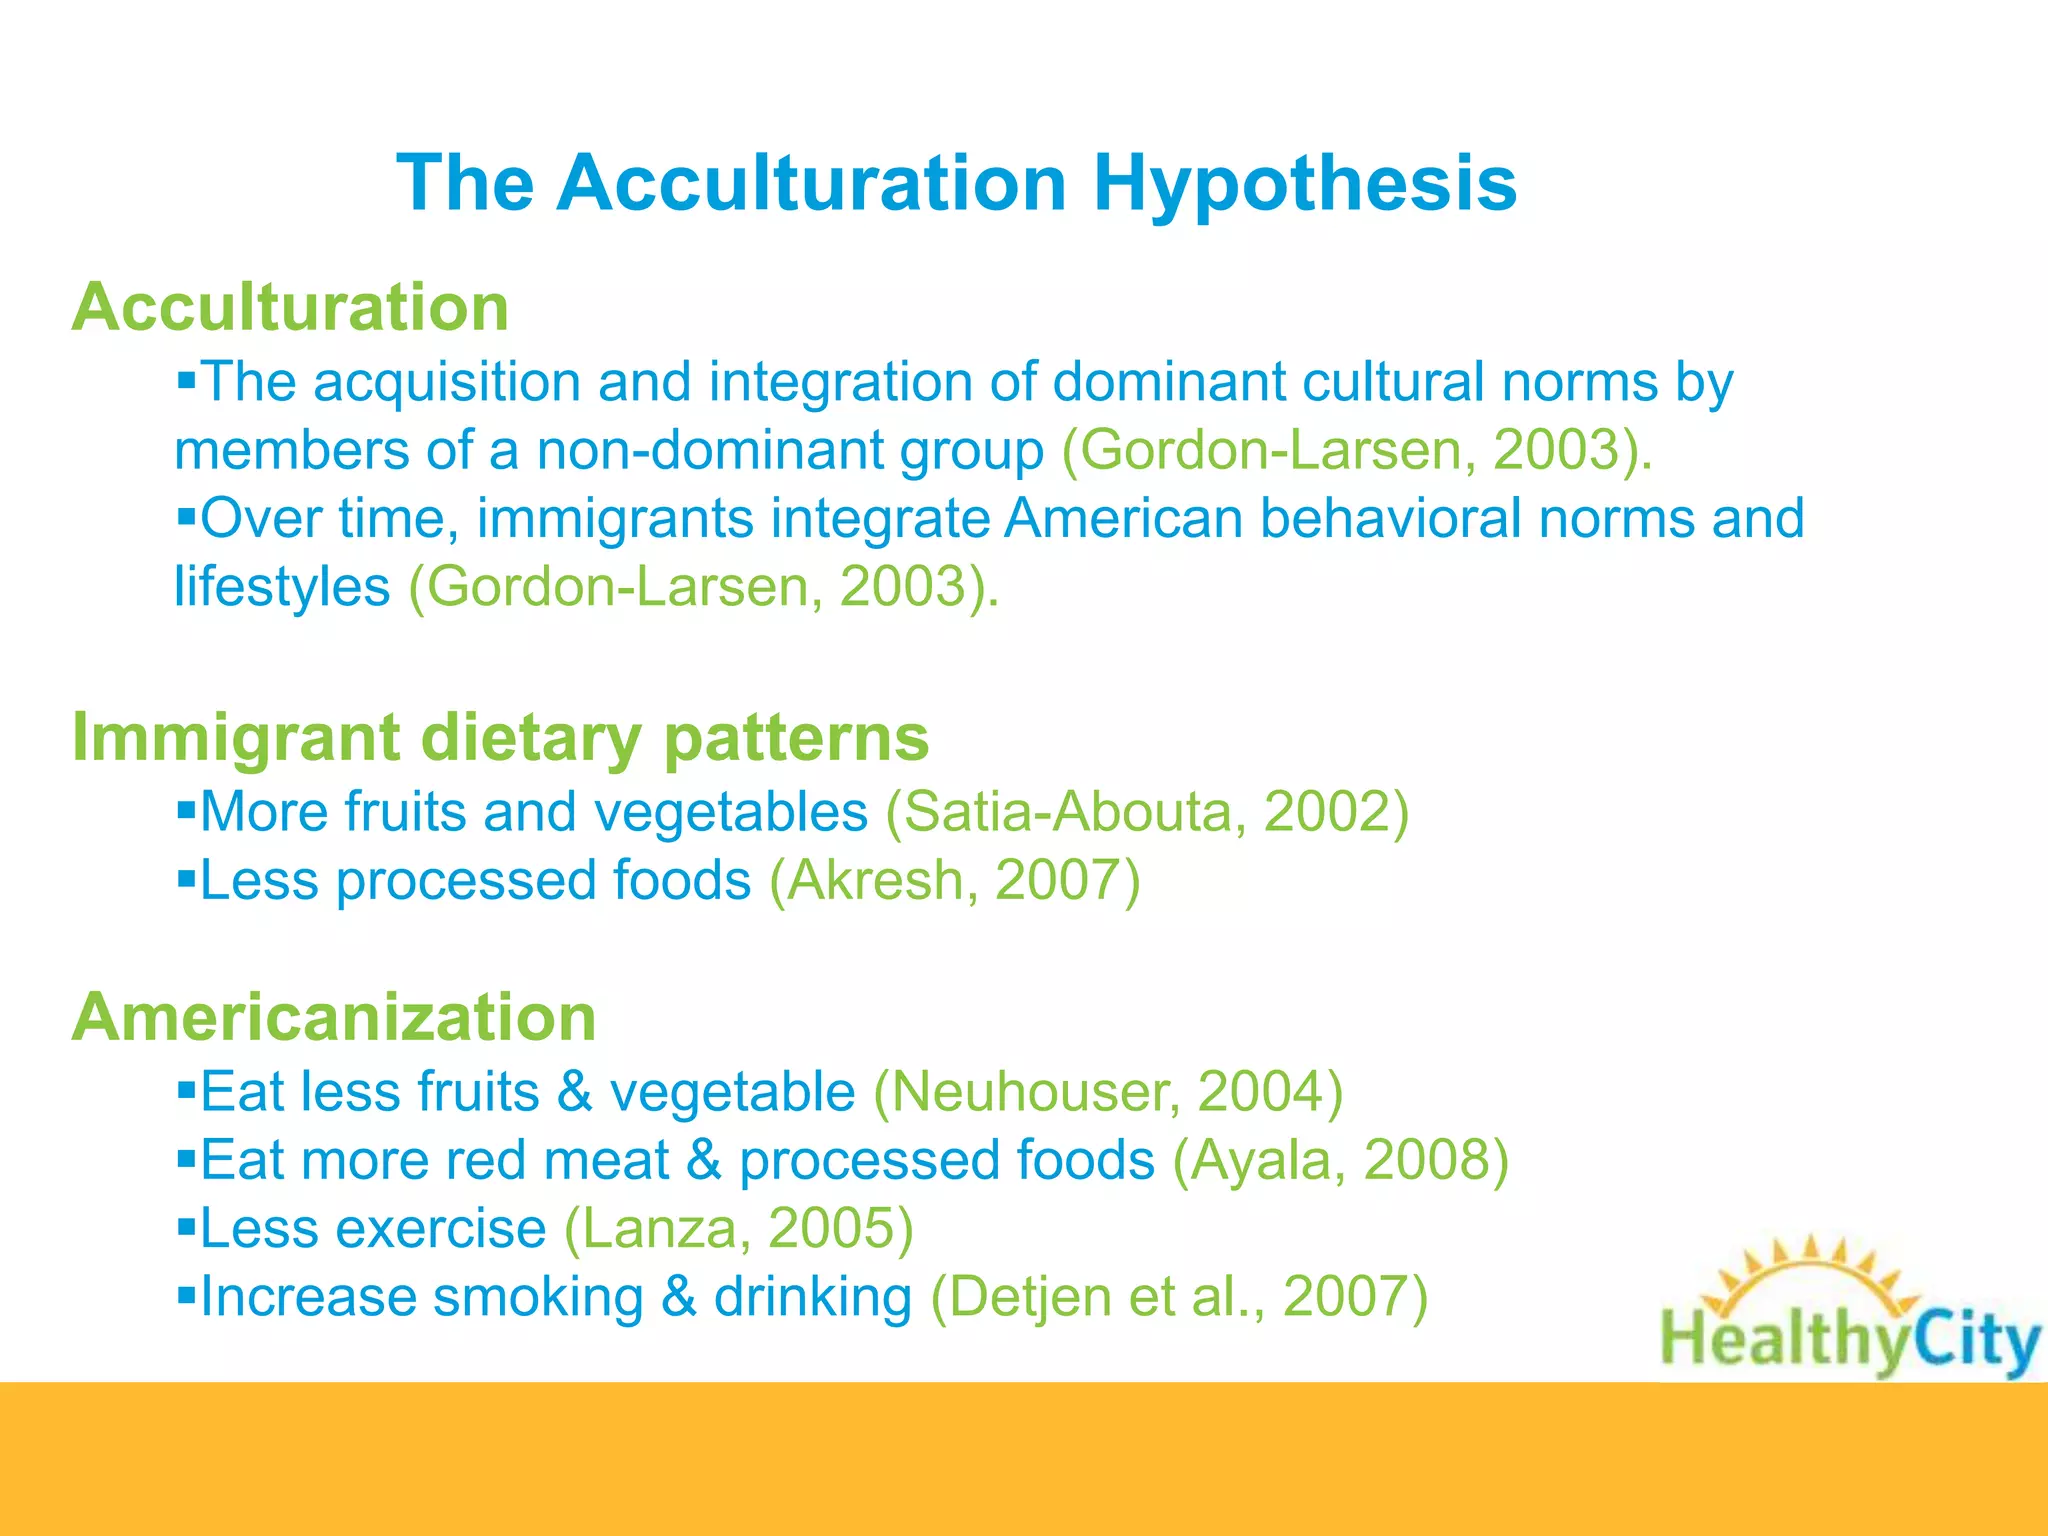
The document discusses a webinar on the immigrant health paradox, focusing on how foreign-born Hispanics generally exhibit better health outcomes than U.S.-born individuals despite socio-economic disadvantages. It highlights the role of acculturation in influencing health behaviors, specifically relating to diabetes prevalence among differing Hispanic groups in California. Data analysis reveals that longer residency in the U.S. increases the likelihood of diabetes, supporting the immigrant health paradox and emphasizing the need for targeted prevention efforts.


![Tugas pw [10]](https://cdn.slidesharecdn.com/ss_thumbnails/tugaspw10-100316082209-phpapp01-thumbnail.jpg?width=640&height=640&fit=bounds)