Download to read offline
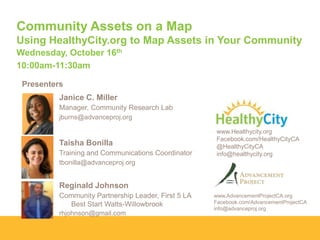
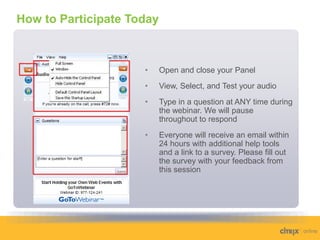
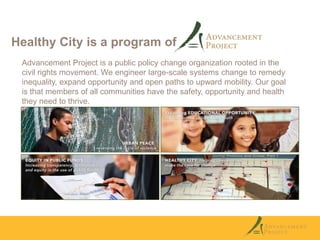
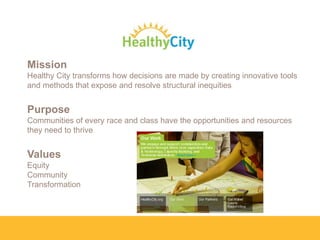
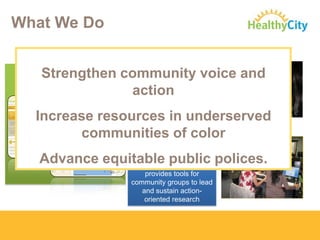
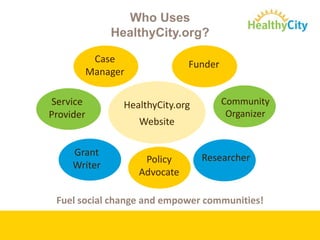
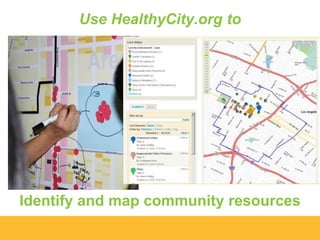
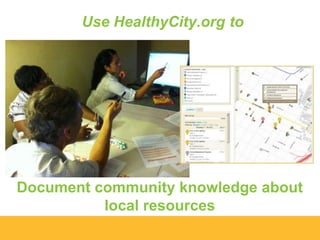
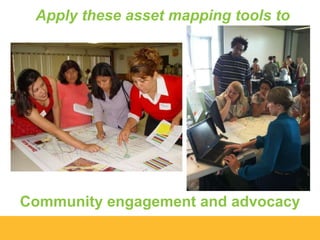
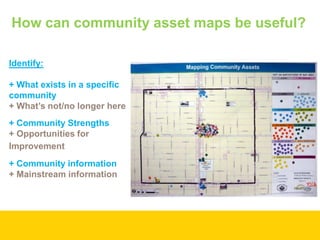

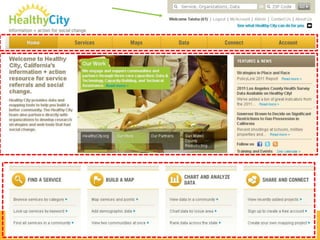
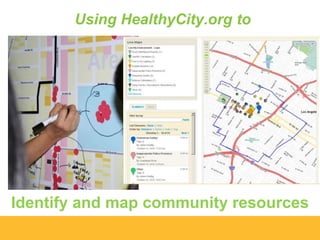
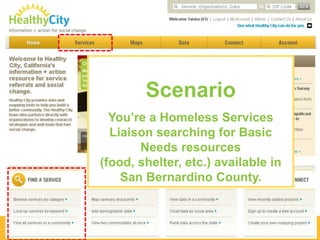
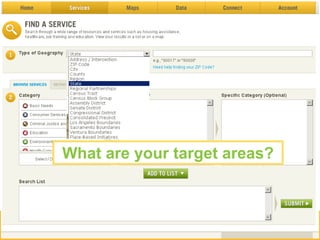
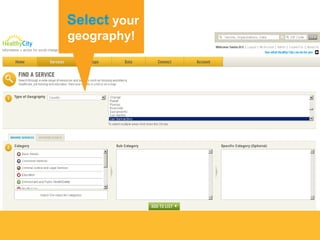
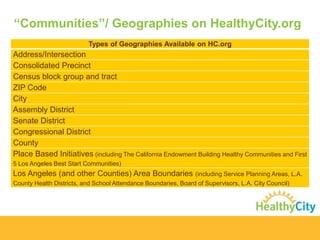
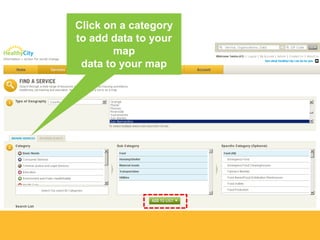
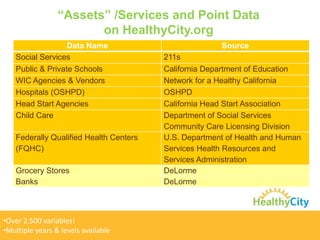
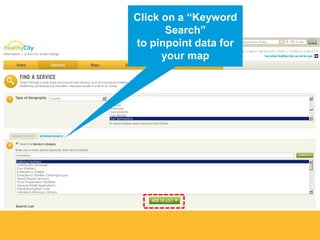
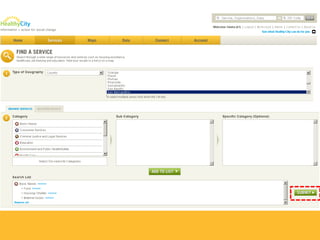
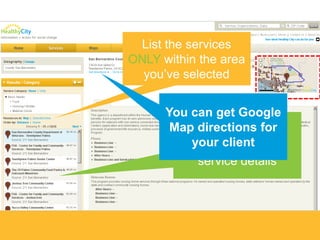
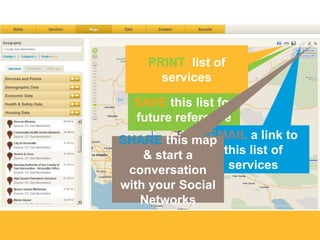
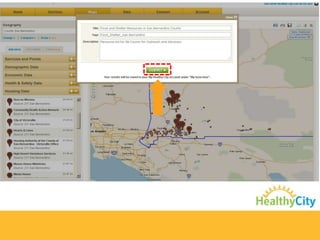
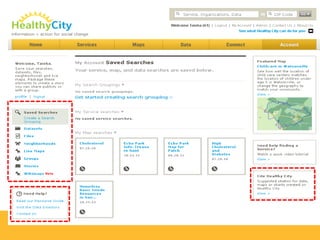
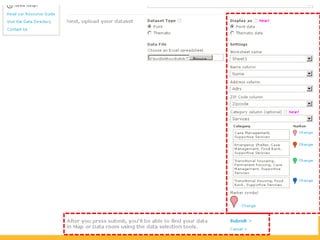
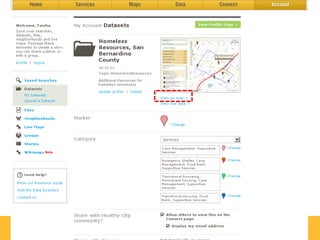
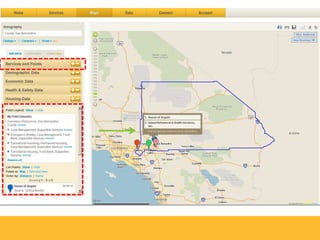
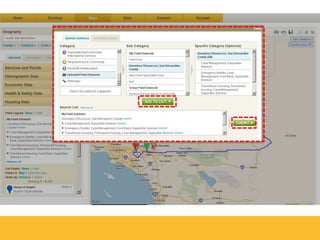
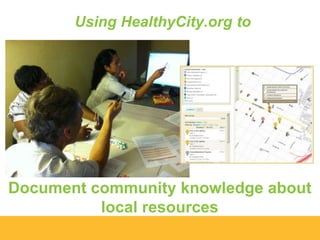
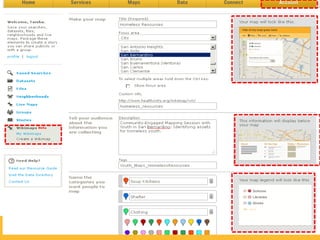
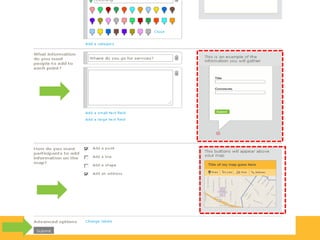
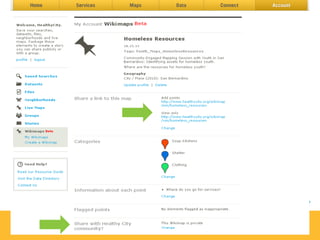
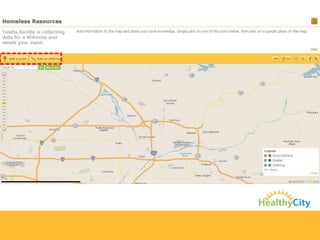
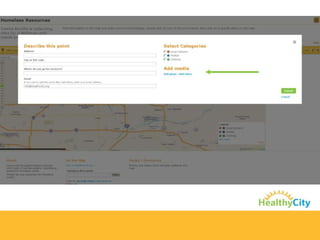
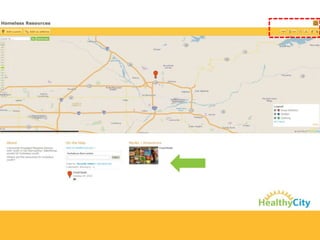
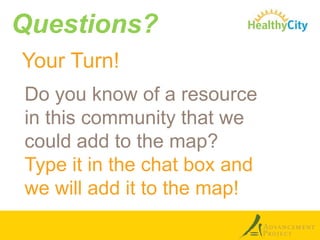
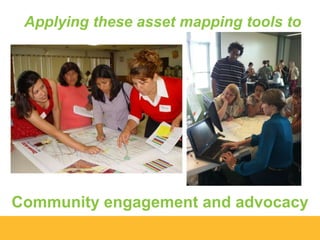
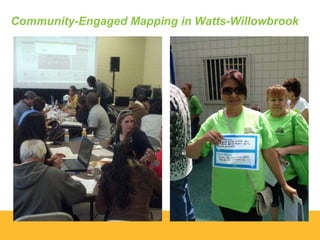
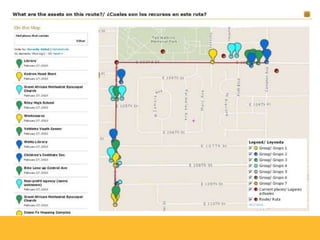
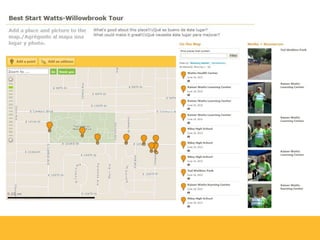
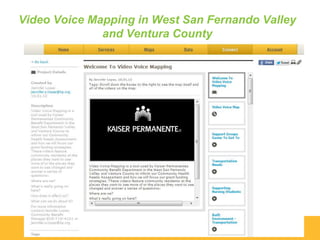

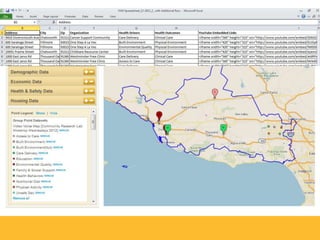
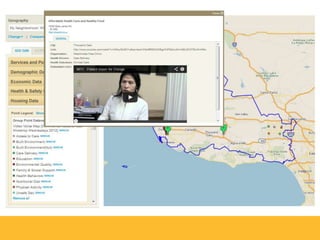
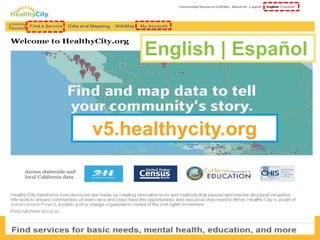
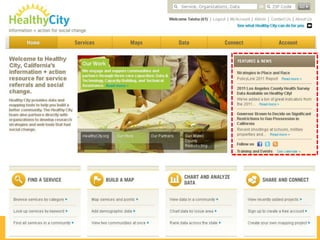
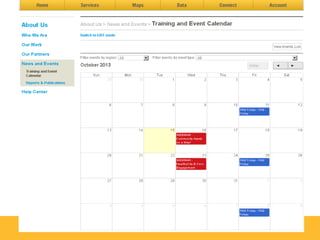

The document describes a webinar on using the HealthyCity.org website to map community assets. It provides details on the presenters and how to participate in the webinar. It outlines what HealthyCity.org is, how it can be used to identify and map local resources, and engage communities to document local knowledge. It also provides examples of how community-engaged mapping has been used in different areas.


