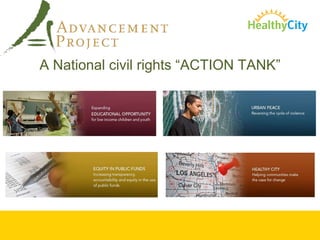
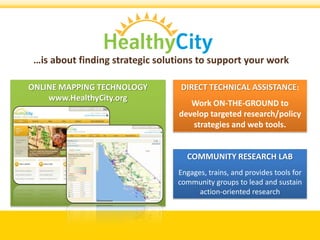
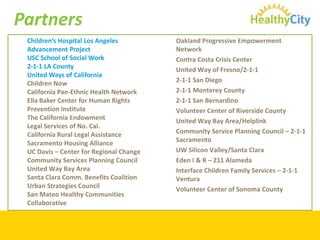
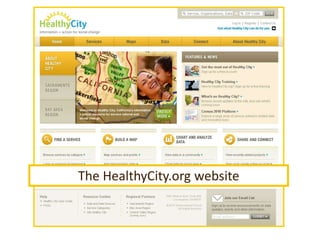
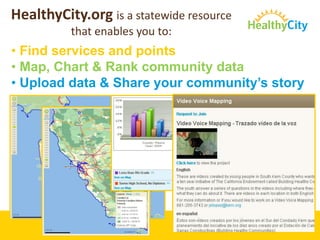
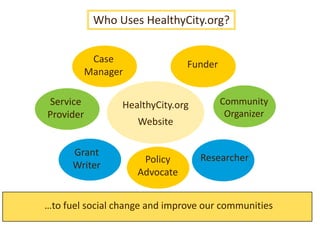
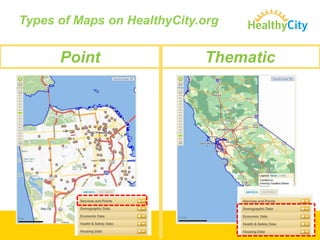
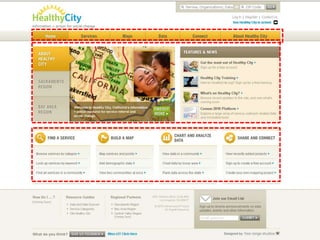
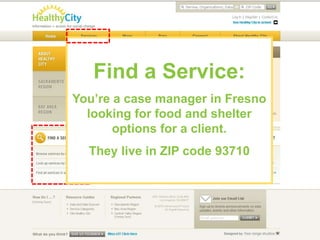
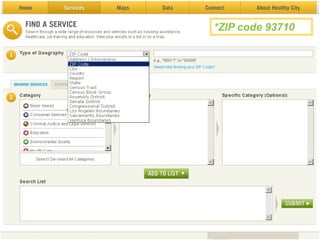
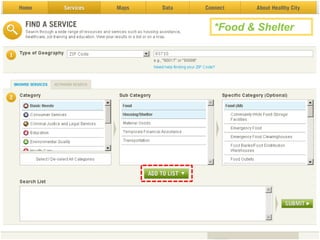
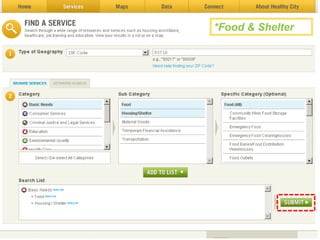
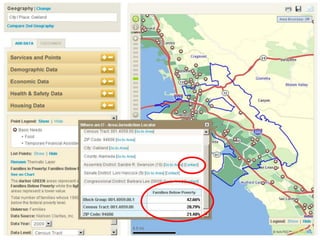
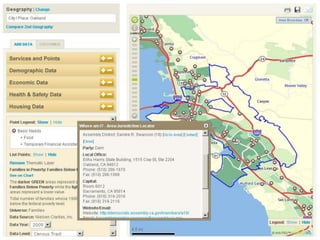
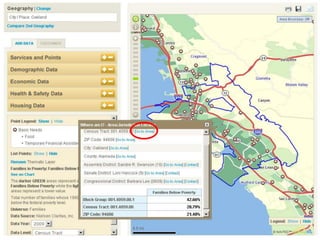
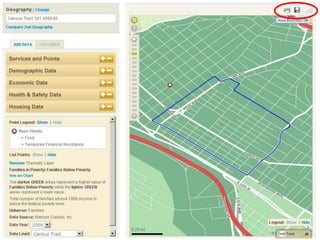
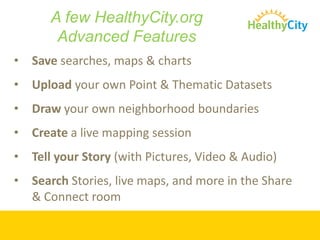
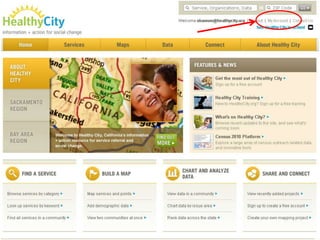
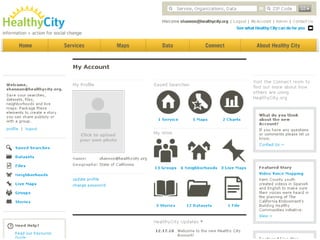
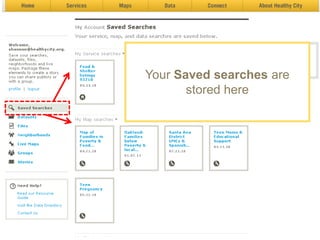
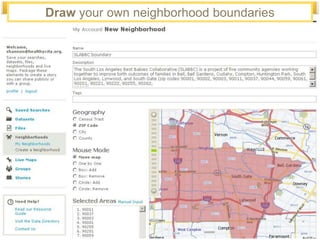
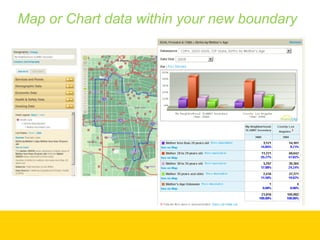
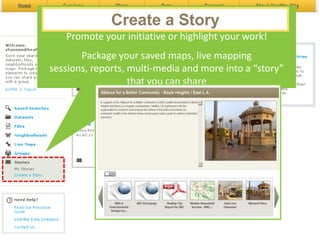
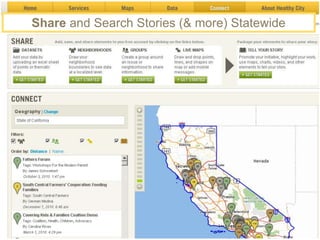
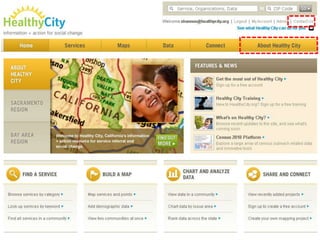
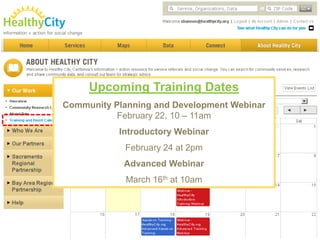
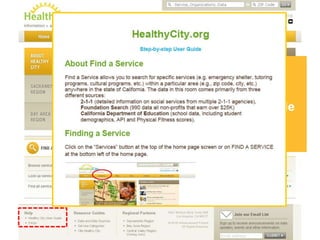
Information + action for social changeA Resource for all of California
Welcome and IntroductionsName and Organization
Briefly, what brought you here today?AgendaIntroduce Advancement Project and Healthy City
Explore region’s interest in a Healthy City partnership
Provide an opportunity to test drive Healthycity.orgA National civil rights “ACTION TANK”
DIRECT TECHNICAL ASSISTANCE:Work ON-THE-GROUND to develop targeted research/policy strategies and web tools. ONLINE MAPPING TECHNOLOGYwww.HealthyCity.orgCOMMUNITY RESEARCH LABEngages, trains, and provides tools for community groups to lead and sustain action-oriented research…is about finding strategic solutions to support your work
PartnersChildren’s Hospital Los AngelesAdvancement ProjectUSC School of Social Work 2-1-1 LA CountyUnited Ways of CaliforniaChildren NowCalifornia Pan-Ethnic Health NetworkElla Baker Center for Human RightsPrevention InstituteThe California EndowmentLegal Services of No. Cal.California Rural Legal AssistanceSacramento Housing AllianceUC Davis – Center for Regional ChangeCommunity Services Planning CouncilUnited Way Bay AreaSanta Clara Comm. Benefits CoalitionUrban Strategies CouncilSan Mateo Healthy Communities CollaborativeOakland Progressive Empowerment NetworkContra Costa Crisis CenterUnited Way of Fresno/2-1-12-1-1 San Diego2-1-1 Monterey County2-1-1 San BernardinoVolunteer Center of Riverside CountyUnited Way Bay Area/HelplinkCommunity Service Planning Council – 2-1-1 SacramentoUW Silicon Valley/Santa Clara Eden I & R – 211 AlamedaInterface Children Family Services – 2-1-1 VenturaVolunteer Center of Sonoma County
The HealthyCity.org website
HealthyCity.org is a statewide resource that enables you to: Find services and points
 Map, Chart & Rank community data
 Upload data & Share your community’s storyCase ManagerFunderService ProviderHealthyCity.orgWebsiteCommunity OrganizerPolicy  AdvocateResearcher…to fuel social change and improve our communitiesWho Uses HealthyCity.org?Grant Writer
What’s on HealthyCity.org?Oh, the Data You’ll See!
Types of Maps on HealthyCity.orgPointThematic
Services & Points
Healthy City has 2-1-1 data (health & human services) for the following counties:Alameda, Contra Costa, Fresno, Los Angeles, Marin, Monterey, Napa, Riverside, Sacramento, San Bernardino, San Diego, San Francisco, Santa Clara, Solano, Sonoma, Ventura
Community DataPopulation Characteristics – Age, Ethnicity, Educational Attainment, etc.Civic ParticipationChild WelfareChild Care & Early EducationIncome & PovertyEmploymentNonprofit InfrastructureEnvironment & Land UseHealth – Birth, Prenatal & ChildHealth - Conditions, Disease & InjuryHealth – DeathsHealth - Insurance & accessHealth – Physical Activity & NutritionNeighborhood & CommunityCrime & Public SafetyHousingOver 2500 variables
Multiple years of data
Find a Service:You’re a case manager in Fresno looking for food and shelter options for a client. They live in ZIP code 93710You can save and share anything you create while logged inGET STARTED!
*ZIP code 93710
*Food & Shelter
*Food & Shelter
List the services ONLY within the area you’ve selected Browse through listings to look at service details
SAVE this list for future referencePRINT  list of services EMAIL a link to this list of servicesYou can get directions for your client
Extensive CDE school data
Finding a ServiceQuestions?
Providing visual evidenceYou can save and share anything you create while logged inGET STARTED!
Where are there families in poverty in Oakland?Are there resources in these highly impoverished areas?
Click the +- buttons to addData to your map
Find local support services
Create a list of services to add to your map
Other Map Room FeaturesCUSTOMIZE  your map:Change the display of dataAdd boundary labels like ZIP or cityCompare your region to another geography
Creating a mapQuestions?
Creating charts and tables to better understand a community or region
In LA County, what is the percentage of Renters v. Owners?
How does this compare to the state of California?Of the Housing Units in L.A. County:48.52 % are Owner Occupied51.48% are Renter Occupied
L.A. County has a higher ratio of renters to owners than the state of CaliforniaView it as a pie chart
Grabbing a Stat using charts and tablesQuestions?
6.Learn about advanced features
A few HealthyCity.org Advanced FeaturesSave searches, maps & chartsUpload your own Point & Thematic DatasetsDraw your own neighborhood boundariesCreate a live mapping sessionTell your Story (with Pictures, Video & Audio)Search Stories, live maps, and more in the Share & Connect room
Your Saved searches are stored here
Draw your own neighborhood boundaries
Map or Chart data within your new boundary
Upload your own Point OR Thematic Datasets
Create an Excel Spreadsheet with up to 1000 points*Save as Excel 97-2003 workbook*
Upload your own Thematic Datasets
Create Live Mapping Sessions(with Pictures, Video & Audio)A Live Map enables multiple people to : Draw and drop points, lines, and shapes on a shared map
 Attach photos & videoCreate a Story to:Promote your initiative or highlight your work! Package your saved maps, live mapping sessions, reports, multi-media and more into a “story” that you can shareCreate a Story
Share and Search Stories (& more) Statewide
Upcoming Training DatesCommunity Planning and Development Webinar February 22, 10 – 11amIntroductory WebinarFebruary 24 at 2pmAdvanced WebinarMarch 16th at 10am
Help is Available:Click on Healthy City User Guideor FAQsHealthy City Strategic PartnershipsGoverningStatewideRegional211/I & R
Regional Partners:“EYES/EARS” ON THE GROUND
LOCAL DATA
LOCAL OUTREACHPriority RegionsBay Area

Healthy City Presentation

  • 1.
    Information + actionfor social changeA Resource for all of California
  • 2.
  • 3.
    Briefly, what broughtyou here today?AgendaIntroduce Advancement Project and Healthy City
  • 4.
    Explore region’s interestin a Healthy City partnership
  • 5.
    Provide an opportunityto test drive Healthycity.orgA National civil rights “ACTION TANK”
  • 6.
    DIRECT TECHNICAL ASSISTANCE:WorkON-THE-GROUND to develop targeted research/policy strategies and web tools. ONLINE MAPPING TECHNOLOGYwww.HealthyCity.orgCOMMUNITY RESEARCH LABEngages, trains, and provides tools for community groups to lead and sustain action-oriented research…is about finding strategic solutions to support your work
  • 7.
    PartnersChildren’s Hospital LosAngelesAdvancement ProjectUSC School of Social Work 2-1-1 LA CountyUnited Ways of CaliforniaChildren NowCalifornia Pan-Ethnic Health NetworkElla Baker Center for Human RightsPrevention InstituteThe California EndowmentLegal Services of No. Cal.California Rural Legal AssistanceSacramento Housing AllianceUC Davis – Center for Regional ChangeCommunity Services Planning CouncilUnited Way Bay AreaSanta Clara Comm. Benefits CoalitionUrban Strategies CouncilSan Mateo Healthy Communities CollaborativeOakland Progressive Empowerment NetworkContra Costa Crisis CenterUnited Way of Fresno/2-1-12-1-1 San Diego2-1-1 Monterey County2-1-1 San BernardinoVolunteer Center of Riverside CountyUnited Way Bay Area/HelplinkCommunity Service Planning Council – 2-1-1 SacramentoUW Silicon Valley/Santa Clara Eden I & R – 211 AlamedaInterface Children Family Services – 2-1-1 VenturaVolunteer Center of Sonoma County
  • 8.
  • 9.
    HealthyCity.org is astatewide resource that enables you to: Find services and points
  • 10.
    Map, Chart& Rank community data
  • 11.
    Upload data& Share your community’s storyCase ManagerFunderService ProviderHealthyCity.orgWebsiteCommunity OrganizerPolicy AdvocateResearcher…to fuel social change and improve our communitiesWho Uses HealthyCity.org?Grant Writer
  • 12.
    What’s on HealthyCity.org?Oh,the Data You’ll See!
  • 13.
    Types of Mapson HealthyCity.orgPointThematic
  • 14.
  • 15.
    Healthy City has2-1-1 data (health & human services) for the following counties:Alameda, Contra Costa, Fresno, Los Angeles, Marin, Monterey, Napa, Riverside, Sacramento, San Bernardino, San Diego, San Francisco, Santa Clara, Solano, Sonoma, Ventura
  • 16.
    Community DataPopulation Characteristics– Age, Ethnicity, Educational Attainment, etc.Civic ParticipationChild WelfareChild Care & Early EducationIncome & PovertyEmploymentNonprofit InfrastructureEnvironment & Land UseHealth – Birth, Prenatal & ChildHealth - Conditions, Disease & InjuryHealth – DeathsHealth - Insurance & accessHealth – Physical Activity & NutritionNeighborhood & CommunityCrime & Public SafetyHousingOver 2500 variables
  • 17.
  • 18.
    Find a Service:You’rea case manager in Fresno looking for food and shelter options for a client. They live in ZIP code 93710You can save and share anything you create while logged inGET STARTED!
  • 19.
  • 20.
  • 21.
  • 22.
    List the servicesONLY within the area you’ve selected Browse through listings to look at service details
  • 23.
    SAVE this listfor future referencePRINT list of services EMAIL a link to this list of servicesYou can get directions for your client
  • 24.
  • 26.
  • 27.
    Providing visual evidenceYoucan save and share anything you create while logged inGET STARTED!
  • 28.
    Where are therefamilies in poverty in Oakland?Are there resources in these highly impoverished areas?
  • 29.
    Click the +-buttons to addData to your map
  • 31.
  • 32.
    Create a listof services to add to your map
  • 38.
    Other Map RoomFeaturesCUSTOMIZE your map:Change the display of dataAdd boundary labels like ZIP or cityCompare your region to another geography
  • 39.
  • 40.
    Creating charts andtables to better understand a community or region
  • 41.
    In LA County,what is the percentage of Renters v. Owners?
  • 42.
    How does thiscompare to the state of California?Of the Housing Units in L.A. County:48.52 % are Owner Occupied51.48% are Renter Occupied
  • 44.
    L.A. County hasa higher ratio of renters to owners than the state of CaliforniaView it as a pie chart
  • 46.
    Grabbing a Statusing charts and tablesQuestions?
  • 47.
  • 48.
    A few HealthyCity.orgAdvanced FeaturesSave searches, maps & chartsUpload your own Point & Thematic DatasetsDraw your own neighborhood boundariesCreate a live mapping sessionTell your Story (with Pictures, Video & Audio)Search Stories, live maps, and more in the Share & Connect room
  • 51.
    Your Saved searchesare stored here
  • 52.
    Draw your ownneighborhood boundaries
  • 53.
    Map or Chartdata within your new boundary
  • 54.
    Upload your ownPoint OR Thematic Datasets
  • 55.
    Create an ExcelSpreadsheet with up to 1000 points*Save as Excel 97-2003 workbook*
  • 56.
    Upload your ownThematic Datasets
  • 57.
    Create Live MappingSessions(with Pictures, Video & Audio)A Live Map enables multiple people to : Draw and drop points, lines, and shapes on a shared map
  • 58.
    Attach photos& videoCreate a Story to:Promote your initiative or highlight your work! Package your saved maps, live mapping sessions, reports, multi-media and more into a “story” that you can shareCreate a Story
  • 59.
    Share and SearchStories (& more) Statewide
  • 61.
    Upcoming Training DatesCommunityPlanning and Development Webinar February 22, 10 – 11amIntroductory WebinarFebruary 24 at 2pmAdvanced WebinarMarch 16th at 10am
  • 62.
    Help is Available:Clickon Healthy City User Guideor FAQsHealthy City Strategic PartnershipsGoverningStatewideRegional211/I & R
  • 63.
  • 64.
  • 65.