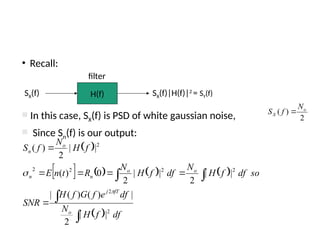
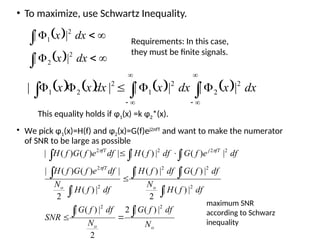
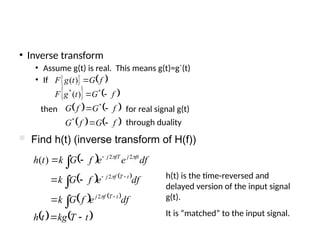
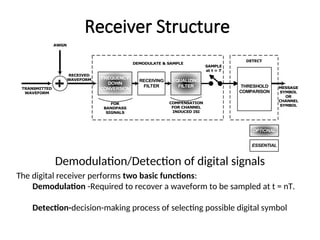
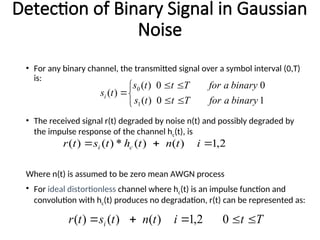
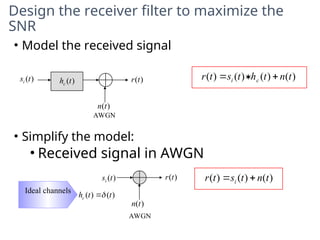
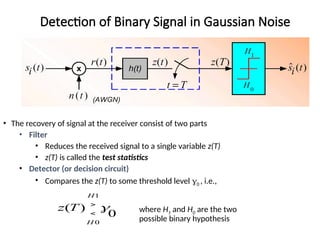
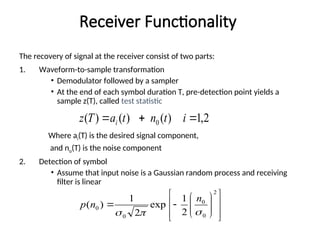
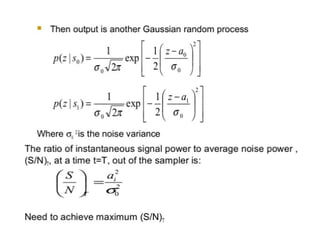
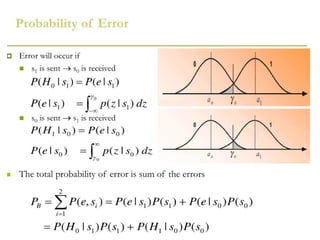
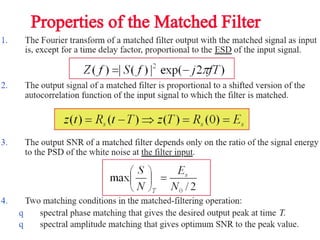
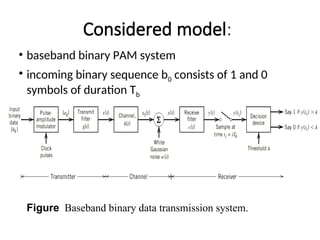
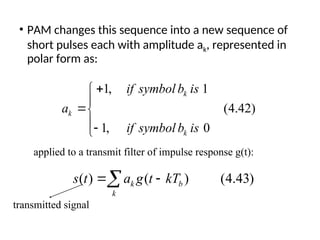
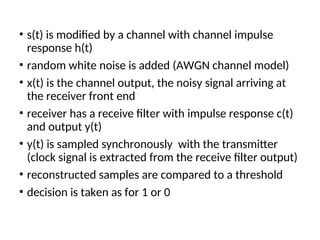
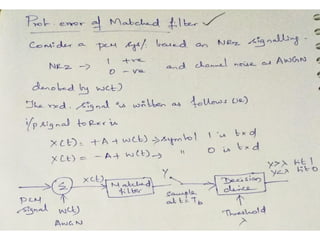
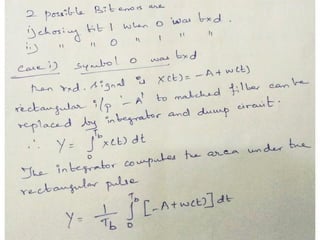
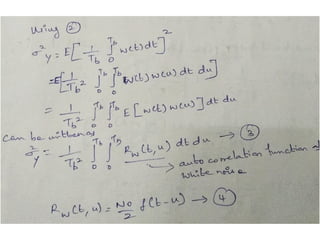
Matched Filters
S11,S12,S13
What is a matched filter?
• A matched filter is a filter used in communications to “match” a
particular transit waveform.
• It passes all the signal frequency components while suppressing
any frequency components where there is only noise and allows to
pass the maximum amount of signal power.
• The purpose of the matched filter is to maximize the signal to noise
ratio at the sampling point of a bit stream and to minimize the
probability of undetected errors received from a signal.
• To achieve the maximum SNR, we want to allow through all the
signal frequency components, but to emphasize more on signal
frequency components that are large and so contribute more to
improving the overall SNR.
Deriving the matched filter
• A basic problem that often arises in the study of communication systems is that of
detecting a pulse transmitted over a channel that is corrupted by channel noise (i.e. AWGN)
• Let us consider a received model, involving a linear time-invariant (LTI) filter of impulse
response h(t).
• The filter input x(t) consists of a pulse signal g(t) corrupted by additive channel noise w(t) of
zero mean and power spectral density No/2.
• The resulting output y(t) is composed of go(t) and n(t), the signal and noise components of
the input x(t), respectively.
)
(
)
(
)
(
0
),
(
)
(
)
(
t
n
t
g
t
y
T
t
t
w
t
g
t
x
o 





LTI filter of impulse
response
h(t)
∑
White noise
w(t)
Signal
g(t)
y(t)
x(t) y(T)
Sample at time
t = T
Linear receiver
The filter input x(t) is:
where
 T is an arbitrary observation interval
 g(t) is a binary symbol 1 or 0
 w(t) is a sample function of white noise, zero mean, psd N0/2
The function of the receiver is to detect the pulse g(t) in an optimum manner,
providing that the shape of the pulse is known and the distortion is due to effects
of noise
To optimize the design of a filter so as to minimize the effects of noise at the filter
output in and improve the detection of the pulse signal.
 
( ) ( ), 0
(4.1)
x t g t w t t T
   
Signal to noise ratio is:
 
)
(
|
)
(
|
|
)
(
|
2
2
2
2
t
n
E
T
g
T
g
SNR o
n
o



where |go(T)|2
is the instantaneous power of the filtered signal, g(t) at point
t = T, and σn
2
is the variance of the white gaussian zero mean filtered noise.
• We sampled at t = T because that gives you the max power of
the filtered signal.
• Examine go(t):
• Fourier transform





2
2
2
2
|
)
(
)
(
|
|
)
(
|
)
(
)
(
)
(
)
(
)
(
)
(
df
e
f
H
f
G
t
g
then
df
e
f
H
f
G
t
g
so
f
H
f
G
f
G
ft
j
o
ft
j
o
o


• Examine σn
2
:
 
   
 
 
 
 
   
   
   
   










df
f
S
R
df
e
f
S
R
R
t
n
t
n
E
t
n
E
t
n
E
t
n
E
n
n
f
j
n
n
n
n
n
1
0
0
var
2
2
2
2
2
2





but this is zero mean so and recall that
autocorrelation at 0


autocorrelation is inverse Fourier
transform of power spectral density
• Recall:
 
       
 


 






df
f
H
N
df
e
f
G
f
H
SNR
so
df
f
H
N
df
f
H
N
R
t
n
E
f
H
N
f
S
o
fT
j
o
o
n
n
o
n
2
2
2
2
2
2
2
|
|
2
|
)
(
)
(
|
|
|
2
|
|
2
0
)
(
|
|
2
)
(


2
)
( o
X
N
f
S 
H(f)
filter
SX(f) SX(f)|H(f)|2
= SY(f)
 In this case, SX(f) is PSD of white gaussian noise,
 Since Sn(f) is our output:
• To maximize, use Schwartz Inequality.
 
  







dx
x
dx
x
2
2
2
1
|
|
|
|
       
 











 dx
x
dx
x
dx
x
x 2
2
2
1
2
2
1 |
|
|
|
|
|
Requirements: In this case,
they must be finite signals.
This equality holds if φ1(x) =k φ2*(x).
• We pick φ1(x)=H(f) and φ2(x)=G(f)ej2πfT
and want to make the numerator
of SNR to be large as possible
o
o
o
o
fT
fT
j
fT
N
df
f
G
N
df
f
G
SNR
df
f
H
N
df
f
G
df
f
H
df
f
H
N
df
e
f
G
f
H
df
e
f
G
df
f
H
df
e
f
G
f
H







  





2
2
2
2
2
2
2
2
2
2
2
|
)
(
|
2
2
|
)
(
|
|
)
(
|
2
|
)
(
|
|
)
(
|
|
)
(
|
2
|
)
(
)
(
|
|
)
(
|
|
)
(
|
|
)
(
)
(
|



maximum SNR
according to Schwarz
inequality
• Inverse transform
• Assume g(t) is real. This means g(t)=g*
(t)
• If    
   
f
G
t
g
F
f
G
t
g
F



*
*
)
(
)
(
   
   
f
G
f
G
f
G
f
G




*
*
then for real signal g(t)
through duality
 
   
   
   
t
T
kg
t
h
df
e
f
G
k
df
e
f
G
k
df
e
e
f
G
k
t
h
t
T
f
j
t
T
f
j
ft
j
fT
j


















2
2
2
2
)
(
 Find h(t) (inverse transform of H(f))
h(t) is the time-reversed and
delayed version of the input signal
g(t).
It is “matched” to the input signal.
FREQUENCY
DOWN
CONVERSION
TRANSMITTED
WAVEFORM
AWGN
RECEIVED
WAVEFORM RECEIVING
FILTER
EQUALIZING
FILTER THRESHOLD
COMPARISON
FOR
BANDPASS
SIGNALS
COMPENSATION
FOR CHANNEL
INDUCED ISI
DEMODULATE & SAMPLE
SAMPLE
at t = T
DETECT
MESSAGE
SYMBOL
OR
CHANNEL
SYMBOL
ESSENTIAL
OPTIONAL
Demodulation/Detection of digital signals
Receiver Structure
The digital receiver performs two basic functions:
Demodulation -Required to recover a waveform to be sampled at t = nT.
Detection-decision-making process of selecting possible digital symbol
Detection of Binary Signal in Gaussian
Noise
• For any binary channel, the transmitted signal over a symbol interval (0,T)
is:
• The received signal r(t) degraded by noise n(t) and possibly degraded by
the impulse response of the channel hc(t), is
Where n(t) is assumed to be zero mean AWGN process
• For ideal distortionless channel where hc(t) is an impulse function and
convolution with hc(t) produces no degradation, r(t) can be represented as:








1
0
)
(
0
0
)
(
)
(
1
0
binary
a
for
T
t
t
s
binary
a
for
T
t
t
s
t
si
2
,
1
)
(
)
(
*
)
(
)
( 

 i
t
n
t
h
t
s
t
r c
i
T
t
i
t
n
t
s
t
r i 



 0
2
,
1
)
(
)
(
)
(
Design the receiver filter to maximize the
SNR
• Model the received signal
• Simplify the model:
• Received signal in AWGN
)
(t
hc
)
(t
si
)
(t
n
)
(t
r
)
(t
n
)
(t
r
)
(t
si
Ideal channels
)
(
)
( t
t
hc 

AWGN
AWGN
)
(
)
(
)
(
)
( t
n
t
h
t
s
t
r c
i 


)
(
)
(
)
( t
n
t
s
t
r i 

Detection of Binary Signal in Gaussian Noise
• The recovery of signal at the receiver consist of two parts
• Filter
• Reduces the received signal to a single variable z(T)
• z(T) is called the test statistics
• Detector (or decision circuit)
• Compares the z(T) to some threshold level 0 , i.e.,
where H1 and H0 are the two
possible binary hypothesis
0
)
(
0
1

H
H
T
z 

Receiver Functionality
The recovery of signal at the receiver consist of two parts:
1. Waveform-to-sample transformation
• Demodulator followed by a sampler
• At the end of each symbol duration T, pre-detection point yields a
sample z(T), called test statistic
Where ai(T) is the desired signal component,
and no(T) is the noise component
2. Detection of symbol
• Assume that input noise is a Gaussian random process and receiving
filter is linear
2
,
1
)
(
)
(
)
( 0 

 i
t
n
t
a
T
z i


















2
0
0
0
0
2
1
exp
2
1
)
(



n
n
p
PAM and Intersymbol Interference
(ISI)
• ISI is due to the fact that the communication channel
is dispersive – some frequencies of the received pulse
are delayed which causes pulse distortion (change in
shape and delay).
• Most efficient method for baseband transmission –
both in terms of power and bandwidth - is PAM.
Considered model:
• baseband binary PAM system
• incoming binary sequence b0 consists of 1 and 0
symbols of duration Tb
Figure Baseband binary data transmission system.
• PAM changes this sequence into a new sequence of
short pulses each with amplitude ak, represented in
polar form as:
1, 1
(4.42)
1, 0
k
k
k
if symbol b is
a
if symbol b is






( ) ( ) (4.43)
k b
k
s t a g t kT
 

applied to a transmit filter of impulse response g(t):
transmitted signal
• s(t) is modified by a channel with channel impulse
response h(t)
• random white noise is added (AWGN channel model)
• x(t) is the channel output, the noisy signal arriving at
the receiver front end
• receiver has a receive filter with impulse response c(t)
and output y(t)
• y(t) is sampled synchronously with the transmitter
(clock signal is extracted from the receive filter output)
• reconstructed samples are compared to a threshold
• decision is taken as for 1 or 0
14 - 46
Eye Diagram
• Eye diagram is empirical measure of signal quality
• Useful for PAM transmitter and receiver analysis and
troubleshooting
• The more open the eye, the better the reception
M=2
t - Tsym
Sampling instant
Interval over which it can be sampled
Slope indicates
sensitivity to
timing error
Distortion over
zero crossing
Margin over noise
t + Tsym
t

UNIT III MATCHED FILTER in communication systems.ppt

  • 1.
  • 2.
    What is amatched filter? • A matched filter is a filter used in communications to “match” a particular transit waveform. • It passes all the signal frequency components while suppressing any frequency components where there is only noise and allows to pass the maximum amount of signal power. • The purpose of the matched filter is to maximize the signal to noise ratio at the sampling point of a bit stream and to minimize the probability of undetected errors received from a signal. • To achieve the maximum SNR, we want to allow through all the signal frequency components, but to emphasize more on signal frequency components that are large and so contribute more to improving the overall SNR.
  • 3.
    Deriving the matchedfilter • A basic problem that often arises in the study of communication systems is that of detecting a pulse transmitted over a channel that is corrupted by channel noise (i.e. AWGN) • Let us consider a received model, involving a linear time-invariant (LTI) filter of impulse response h(t). • The filter input x(t) consists of a pulse signal g(t) corrupted by additive channel noise w(t) of zero mean and power spectral density No/2. • The resulting output y(t) is composed of go(t) and n(t), the signal and noise components of the input x(t), respectively. ) ( ) ( ) ( 0 ), ( ) ( ) ( t n t g t y T t t w t g t x o       LTI filter of impulse response h(t) ∑ White noise w(t) Signal g(t) y(t) x(t) y(T) Sample at time t = T Linear receiver
  • 4.
    The filter inputx(t) is: where  T is an arbitrary observation interval  g(t) is a binary symbol 1 or 0  w(t) is a sample function of white noise, zero mean, psd N0/2 The function of the receiver is to detect the pulse g(t) in an optimum manner, providing that the shape of the pulse is known and the distortion is due to effects of noise To optimize the design of a filter so as to minimize the effects of noise at the filter output in and improve the detection of the pulse signal.   ( ) ( ), 0 (4.1) x t g t w t t T     Signal to noise ratio is:   ) ( | ) ( | | ) ( | 2 2 2 2 t n E T g T g SNR o n o    where |go(T)|2 is the instantaneous power of the filtered signal, g(t) at point t = T, and σn 2 is the variance of the white gaussian zero mean filtered noise.
  • 5.
    • We sampledat t = T because that gives you the max power of the filtered signal. • Examine go(t): • Fourier transform      2 2 2 2 | ) ( ) ( | | ) ( | ) ( ) ( ) ( ) ( ) ( ) ( df e f H f G t g then df e f H f G t g so f H f G f G ft j o ft j o o   • Examine σn 2 :                                         df f S R df e f S R R t n t n E t n E t n E t n E n n f j n n n n n 1 0 0 var 2 2 2 2 2 2      but this is zero mean so and recall that autocorrelation at 0   autocorrelation is inverse Fourier transform of power spectral density
  • 6.
    • Recall:                      df f H N df e f G f H SNR so df f H N df f H N R t n E f H N f S o fT j o o n n o n 2 2 2 2 2 2 2 | | 2 | ) ( ) ( | | | 2 | | 2 0 ) ( | | 2 ) (   2 ) ( o X N f S  H(f) filter SX(f) SX(f)|H(f)|2 = SY(f)  In this case, SX(f) is PSD of white gaussian noise,  Since Sn(f) is our output:
  • 7.
    • To maximize,use Schwartz Inequality.             dx x dx x 2 2 2 1 | | | |                       dx x dx x dx x x 2 2 2 1 2 2 1 | | | | | | Requirements: In this case, they must be finite signals. This equality holds if φ1(x) =k φ2*(x). • We pick φ1(x)=H(f) and φ2(x)=G(f)ej2πfT and want to make the numerator of SNR to be large as possible o o o o fT fT j fT N df f G N df f G SNR df f H N df f G df f H df f H N df e f G f H df e f G df f H df e f G f H                2 2 2 2 2 2 2 2 2 2 2 | ) ( | 2 2 | ) ( | | ) ( | 2 | ) ( | | ) ( | | ) ( | 2 | ) ( ) ( | | ) ( | | ) ( | | ) ( ) ( |    maximum SNR according to Schwarz inequality
  • 8.
    • Inverse transform •Assume g(t) is real. This means g(t)=g* (t) • If         f G t g F f G t g F    * * ) ( ) (         f G f G f G f G     * * then for real signal g(t) through duality               t T kg t h df e f G k df e f G k df e e f G k t h t T f j t T f j ft j fT j                   2 2 2 2 ) (  Find h(t) (inverse transform of H(f)) h(t) is the time-reversed and delayed version of the input signal g(t). It is “matched” to the input signal.
  • 9.
    FREQUENCY DOWN CONVERSION TRANSMITTED WAVEFORM AWGN RECEIVED WAVEFORM RECEIVING FILTER EQUALIZING FILTER THRESHOLD COMPARISON FOR BANDPASS SIGNALS COMPENSATION FORCHANNEL INDUCED ISI DEMODULATE & SAMPLE SAMPLE at t = T DETECT MESSAGE SYMBOL OR CHANNEL SYMBOL ESSENTIAL OPTIONAL Demodulation/Detection of digital signals Receiver Structure The digital receiver performs two basic functions: Demodulation -Required to recover a waveform to be sampled at t = nT. Detection-decision-making process of selecting possible digital symbol
  • 10.
    Detection of BinarySignal in Gaussian Noise • For any binary channel, the transmitted signal over a symbol interval (0,T) is: • The received signal r(t) degraded by noise n(t) and possibly degraded by the impulse response of the channel hc(t), is Where n(t) is assumed to be zero mean AWGN process • For ideal distortionless channel where hc(t) is an impulse function and convolution with hc(t) produces no degradation, r(t) can be represented as:         1 0 ) ( 0 0 ) ( ) ( 1 0 binary a for T t t s binary a for T t t s t si 2 , 1 ) ( ) ( * ) ( ) (    i t n t h t s t r c i T t i t n t s t r i      0 2 , 1 ) ( ) ( ) (
  • 11.
    Design the receiverfilter to maximize the SNR • Model the received signal • Simplify the model: • Received signal in AWGN ) (t hc ) (t si ) (t n ) (t r ) (t n ) (t r ) (t si Ideal channels ) ( ) ( t t hc   AWGN AWGN ) ( ) ( ) ( ) ( t n t h t s t r c i    ) ( ) ( ) ( t n t s t r i  
  • 12.
    Detection of BinarySignal in Gaussian Noise • The recovery of signal at the receiver consist of two parts • Filter • Reduces the received signal to a single variable z(T) • z(T) is called the test statistics • Detector (or decision circuit) • Compares the z(T) to some threshold level 0 , i.e., where H1 and H0 are the two possible binary hypothesis 0 ) ( 0 1  H H T z  
  • 13.
    Receiver Functionality The recoveryof signal at the receiver consist of two parts: 1. Waveform-to-sample transformation • Demodulator followed by a sampler • At the end of each symbol duration T, pre-detection point yields a sample z(T), called test statistic Where ai(T) is the desired signal component, and no(T) is the noise component 2. Detection of symbol • Assume that input noise is a Gaussian random process and receiving filter is linear 2 , 1 ) ( ) ( ) ( 0    i t n t a T z i                   2 0 0 0 0 2 1 exp 2 1 ) (    n n p
  • 27.
    PAM and IntersymbolInterference (ISI) • ISI is due to the fact that the communication channel is dispersive – some frequencies of the received pulse are delayed which causes pulse distortion (change in shape and delay). • Most efficient method for baseband transmission – both in terms of power and bandwidth - is PAM.
  • 28.
    Considered model: • basebandbinary PAM system • incoming binary sequence b0 consists of 1 and 0 symbols of duration Tb Figure Baseband binary data transmission system.
  • 29.
    • PAM changesthis sequence into a new sequence of short pulses each with amplitude ak, represented in polar form as: 1, 1 (4.42) 1, 0 k k k if symbol b is a if symbol b is       ( ) ( ) (4.43) k b k s t a g t kT    applied to a transmit filter of impulse response g(t): transmitted signal
  • 30.
    • s(t) ismodified by a channel with channel impulse response h(t) • random white noise is added (AWGN channel model) • x(t) is the channel output, the noisy signal arriving at the receiver front end • receiver has a receive filter with impulse response c(t) and output y(t) • y(t) is sampled synchronously with the transmitter (clock signal is extracted from the receive filter output) • reconstructed samples are compared to a threshold • decision is taken as for 1 or 0
  • 46.
    14 - 46 EyeDiagram • Eye diagram is empirical measure of signal quality • Useful for PAM transmitter and receiver analysis and troubleshooting • The more open the eye, the better the reception M=2 t - Tsym Sampling instant Interval over which it can be sampled Slope indicates sensitivity to timing error Distortion over zero crossing Margin over noise t + Tsym t