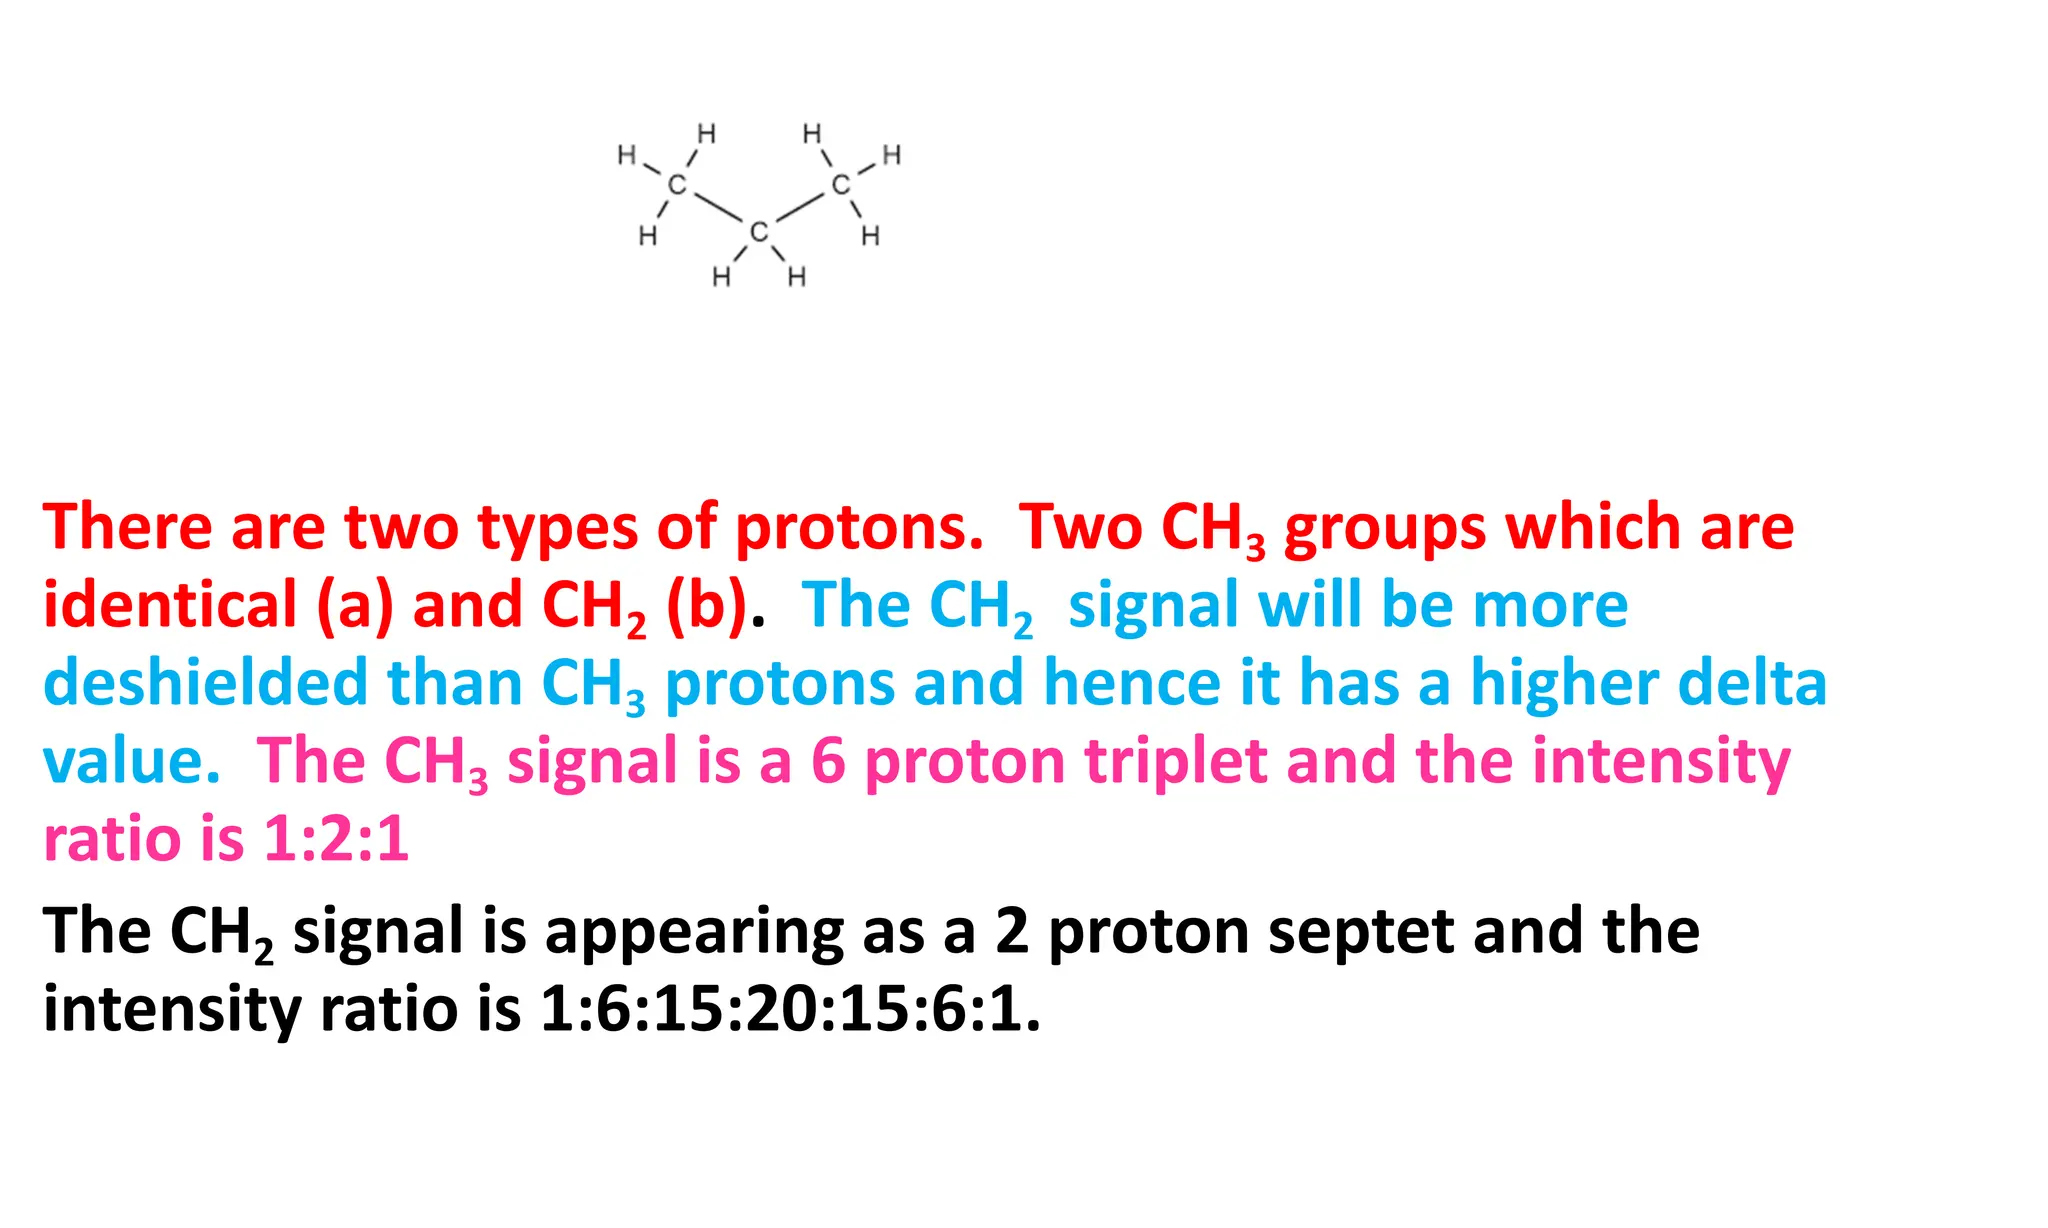
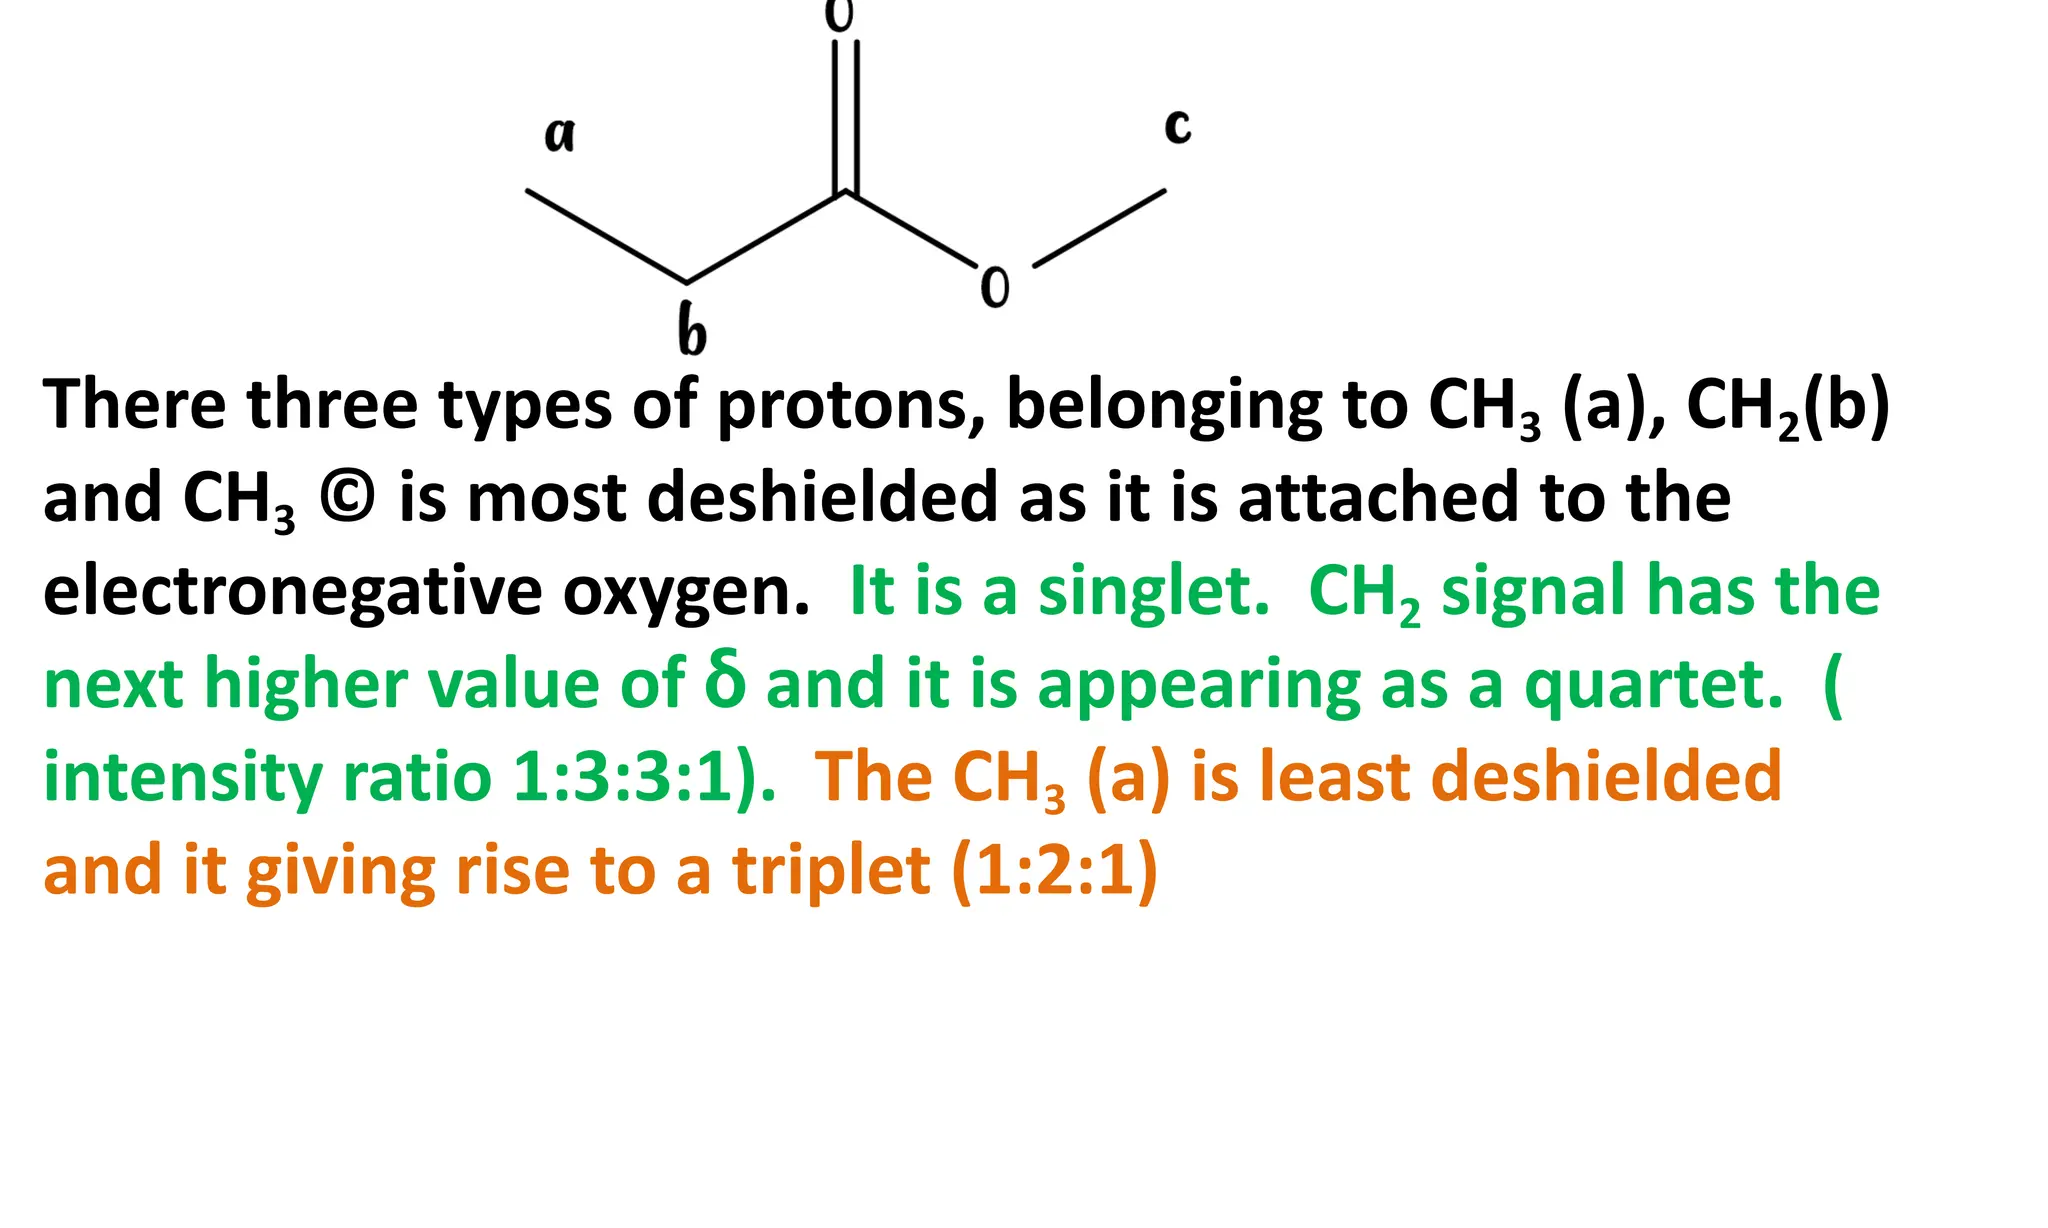
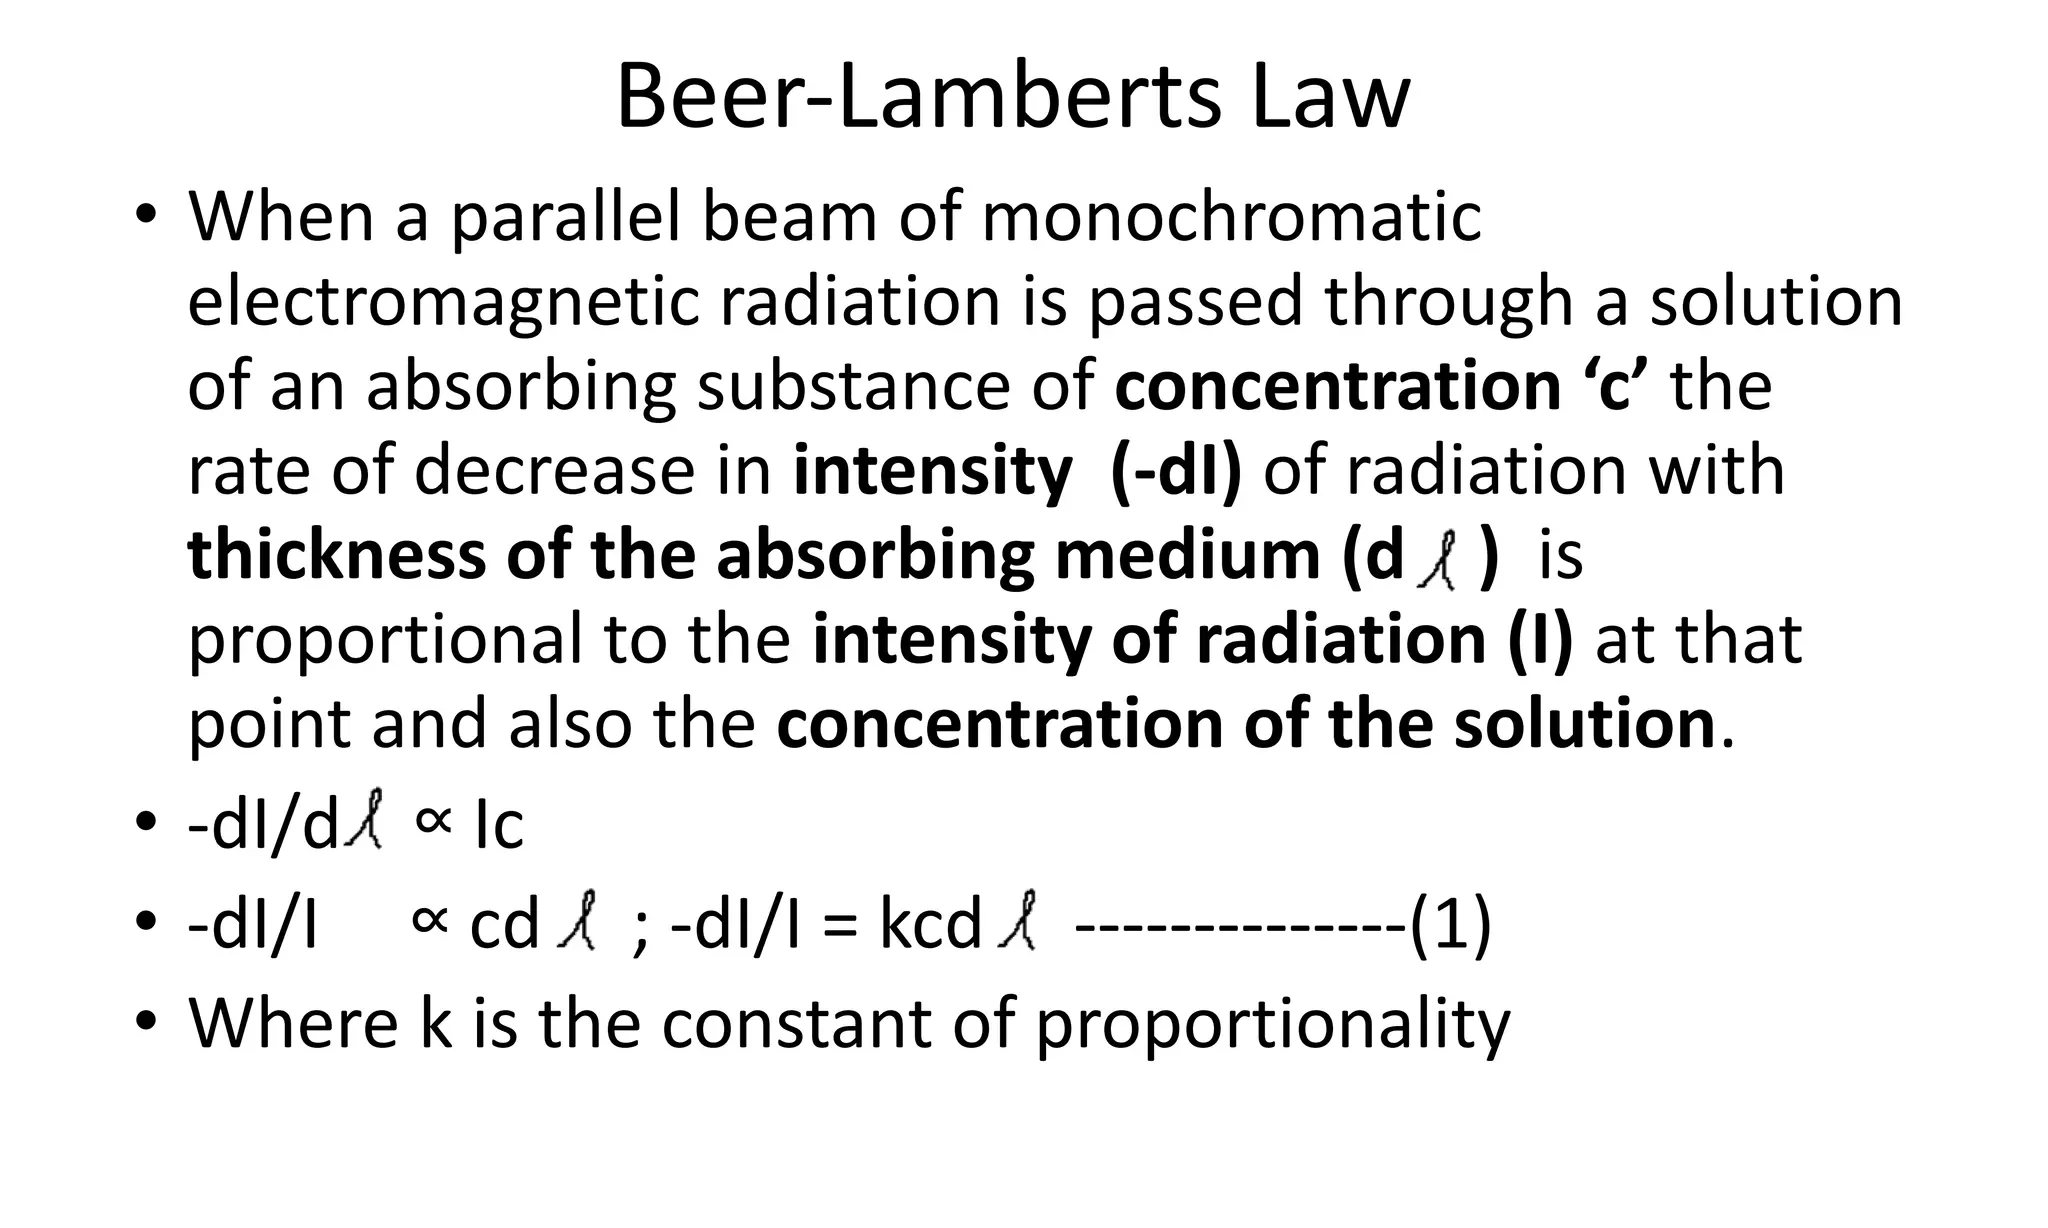
Spectroscopy deals with the interaction of electromagnetic radiation with matter. There are two main types of spectra - absorption and emission. Absorption spectra occur when molecules absorb energy and are excited to higher energy levels, while emission spectra occur when molecules fall to lower energy levels and emit energy. Spectroscopy can provide information about the electronic, vibrational, and rotational energy levels of atoms and molecules. Beer-Lambert's law describes the quantitative relationship between absorbance of a solution and its concentration, with limitations at high concentrations or for fluorescent samples. Infrared spectroscopy specifically involves transitions between vibrational energy levels, detected in the mid-infrared region.


![Q2. If the fundamental vibrational frequency of HCl is 8.667 x 10¹³
s-1
,
calculate the force constant of HCl bond [H = 1.008; Cl = 35.45]
μ = (1.008 x 1.66 x 10-27
kg x 35.45 x 1.66 x 10-27
)
(1.008 x 1.66 x 10-27
kg + 35.45 x 1.66 x 10-27
)
= 1.627 x 10⁻²⁷
Kg
ν = 8.667 x 10¹³
s-1
K = 4π2
ν 2
μ
k= 4 x 3.14²x(8.667x10¹3
s⁻¹) 2
x(1.673 x10⁻27
kg)= 482.086 kg s⁻2
=
482.086kgms⁻2
m⁻¹ = 482.086 Nm⁻¹](https://image.slidesharecdn.com/spectroscopy4-240317052941-e1cbbdc8/75/Engineering-chemistry-SPECTROSCOPY-4-pdf-50-2048.jpg)