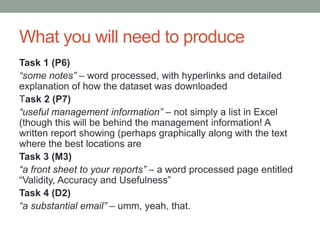
This document outlines an assessment involving research to identify suitable locations for a bank's roadshow targeting young professionals. It provides a scenario where the student must research census data and use a spreadsheet to analyze locations with substantial numbers of young professional workers. The student must then produce: 1) Notes on the selected dataset; 2) A report identifying potential locations using management information from their analysis; 3) A document validating their findings; and 4) An email to their team justifying the information. The document provides guidance on selecting UK census data from NomisWeb to complete the tasks.
Management Information System
Information System
Information Systems Framework
Information Systems Concepts
system
Data Versus Information
Attributes
Transaction Processing Activities
Process Control Systems
Management Information System
Information System
Information Systems Framework
Information Systems Concepts
system
Data Versus Information
Attributes
Transaction Processing Activities
Process Control Systems
Principles of Information Systems,
Information Concepts
Characteristics of Valuable Information,
Management information system,
Information Systems in Society.
Global Challenges in Information Systems
MIS 02 foundations of information systemsTushar B Kute
The series of presentations contains the information about "Management Information System" subject of SEIT for University of Pune.
Subject Teacher: Tushar B Kute (Sandip Institute of Technology and Research Centre, Nashik)
http://www.tusharkute.com
MIS Subsystems
Hierarchical Relations of Subsystems
Types of Subsystems
Organisational Function Subsystem
Activity Subsystem
Organisational Function Subsystems
Organisational Function
Production Subsystem
Marketing Subsystem
Personnel Subsystem
Finance Subsystem
Cambridge Nationals R001 Revision lesson - for more details & resources see http://1000computing.wordpress.com/2014/11/18/the-thing-with-cambridge-nationals-lesson-resources/
Oracle Primavera P6 R8 Release Value Propositionp6academy
ORACLE | P6ACADEMY.COM
Shared by our members
This document provides an overview of features and enhancements included in
Oracle’s Primavera P6 Enterprise Project Portfolio Management Release 8. It is
intended solely to help you assess the business benefits of upgrading to
Primavera P6 Enterprise Project Portfolio Management R8.
Copyright Oracle
Case Study: Building a Culture of Analytics in HR at MicronHuman Capital Media
Supporting 30,000 employees worldwide, the Workforce Information team at Micron Technology Inc. has a clear vision: When someone thinks of analytics at Micron, they want that person to think of HR. For most companies today, that seems a tall order to fulfill. And with Micron’s highly technical staff of more than 10,000 engineers, it was a particularly bold aspiration. Over the past two years Micron’s Workforce Information team, working within the HR department, has made significant progress in achieving that goal.
Since implementing Visier Workforce Analytics in late 2013, Micron’s Workforce Information team has rolled out self-service analytics to more than 150 HR leaders and business partners and more than 800 business-area managers globally. As a result, Micron is uncovering new workforce insights that can be used to make decisions that are closely linked to business performance.
For more than 30 years, Micron’s teams of dreamers, visionaries and scientists have redefined innovation — designing and building some of the world’s most advanced memory and semiconductor technologies.
Join 2014 Brandon Hall Excellence in Technology award-winner Tim Long, director of Workforce Information at Micron, as he discusses his team’s journey in enabling HR to “demand evidence and think critically.”
Long will share his team’s experience:
Developing global standards for workforce data.
Implementing a highly scalable solution for workforce analytics on demand.
Fostering a data-driven culture within HR.
Leveraging workforce analytics in HR processes, such as compensation reviews..
Speaker:
Tim Long - Director of Workforce Information Micron Technology INC.
As the director of Workforce Information at Micron Technology Inc., Tim Long leads a team of business intelligence engineers, analysts and data scientists to create insight from workforce data. Long’s team supports Micron’s strategic commitment to data-driven decision making helping to inform people decisions with sound analytics. Long holds a bachelor’s degree in mechanical engineering from the University of Wyoming and a master’s degree in business analytics from New York University’s Stern School of Business
David Bernstein of eQuest, the global leader in job-posting delivery and job board performance analytics, discusses how Big Data analysis provides organizations with greater recruitment marketing effectivenss than ever before. By not only delivering predictive information on job postings but by also taking a holistic look at your talent pipeline, Big Data analysis provides the insight organizations need to make better-informed decisions more quickly, reducing time-to-hire, costs and administrative burden.
The pioneers in the big data space have battle scars and have learnt many of the lessons in this report the hard way. But if you are a general manger & just embarking on the big data journey, you should now have what they call the 'second mover advantage’. My hope is that this report helps you better leverage your second mover advantage. The goal here is to shed some light on the people & process issues in building a central big data analytics function
Employees, Business Partners and Bad Guys: What Web Data Reveals About Person...Connotate
This presentation will discuss how to collect Web data with precision, transform it and then apply next-generation text analytics to reveal insights about the past activities of persons of interest and/or predict future outcomes. Featured guest speaker Claire Schmidt will discuss results of a project which proved the potential of using automated Web data collection and advanced analytics to identify potential child victims of exploitation.
Data Analytics in Industry Verticals, Data Analytics Lifecycle, Challenges of...Sahilakhurana
Banking and securities
Challenges
Early warning for securities fraud and trade visibilities
Card fraud detection and audit trails
Enterprise credit risk reporting
Customer data transformation and analytics.
The Security Exchange commission (SEC) is using big data to monitor financial market activity by using network analytics and natural language processing. This helps to catch illegal trading activity in the financial markets.
The Data Analytics Lifecycle is designed specifically for Big Data problems and data science projects. The lifecycle has six phases, and project work can occur in several phases at once. For most phases in the lifecycle, the movement can be either forward or backward. This iterative depiction of the lifecycle is intended to more closely portray a real project, in which aspects of the project move forward and may return to earlier stages as new information is uncovered and team members learn more about various stages of the project. This enables participants to move iteratively through the process and drive toward operationalizing the project work.
Phase 1—Discovery: In Phase 1, the team learns the business domain, including relevant history such as whether the organization or business unit has attempted similar projects in the past from which they can learn. The team assesses the resources available to support the project in terms of people, technology, time, and data. Important activities in this phase include framing the business problem as an analytics challenge that can be addressed in subsequent phases and formulating initial hypotheses (IHs) to test and begin learning the data.
Phase 2—Data preparation: Phase 2 requires the presence of an analytic sandbox, in which the team can work with data and perform analytics for the duration of the project. The team needs to execute extract, load, and transform (ELT) or extract, transform and load (ETL) to get data into the sandbox. The ELT and ETL are sometimes abbreviated as ETLT. Data should be transformed in the ETLT process so the team can work with it and analyze it. In this phase, the team also needs to familiarize itself with the data thoroughly and take steps to condition the data.
From Card Sort to Redesigned Intranet Site: A Success StoryBob Thomas
This is a case study describing how we moved an intranet that was not working for its employees into a successful website.
The objectives were to "lead with the need,' to determine how current employees want their information organized and what should be emphasized first. Our goals were to redesign the intranet site, focusing on the navigation and organization (overall information architecture); make the site usable; especially when it comes to finding things; and to make the site attractive and understandable to employees.
A card sort seemed the best solution because we had 2 sites that needed to be unified and that had grown too small for the additional information that kept getting added year in and year out. We had an IA that wasn’t working, and we wanted to discover how employees – the principal users of the site – wanted their information organized.
We chose a open card sort because we wanted participants to tell us how they wanted the main categories of the site named (as opposed to us naming the categories for them).
Cambridge Nationals R001 Revision lesson - for more details & resources see http://1000computing.wordpress.com/2014/11/18/the-thing-with-cambridge-nationals-lesson-resources/
We all have good and bad thoughts from time to time and situation to situation. We are bombarded daily with spiraling thoughts(both negative and positive) creating all-consuming feel , making us difficult to manage with associated suffering. Good thoughts are like our Mob Signal (Positive thought) amidst noise(negative thought) in the atmosphere. Negative thoughts like noise outweigh positive thoughts. These thoughts often create unwanted confusion, trouble, stress and frustration in our mind as well as chaos in our physical world. Negative thoughts are also known as “distorted thinking”.
Synthetic Fiber Construction in lab .pptxPavel ( NSTU)
Synthetic fiber production is a fascinating and complex field that blends chemistry, engineering, and environmental science. By understanding these aspects, students can gain a comprehensive view of synthetic fiber production, its impact on society and the environment, and the potential for future innovations. Synthetic fibers play a crucial role in modern society, impacting various aspects of daily life, industry, and the environment. ynthetic fibers are integral to modern life, offering a range of benefits from cost-effectiveness and versatility to innovative applications and performance characteristics. While they pose environmental challenges, ongoing research and development aim to create more sustainable and eco-friendly alternatives. Understanding the importance of synthetic fibers helps in appreciating their role in the economy, industry, and daily life, while also emphasizing the need for sustainable practices and innovation.
Unit 8 - Information and Communication Technology (Paper I).pdfThiyagu K
This slides describes the basic concepts of ICT, basics of Email, Emerging Technology and Digital Initiatives in Education. This presentations aligns with the UGC Paper I syllabus.
Palestine last event orientationfvgnh .pptxRaedMohamed3
An EFL lesson about the current events in Palestine. It is intended to be for intermediate students who wish to increase their listening skills through a short lesson in power point.
The Indian economy is classified into different sectors to simplify the analysis and understanding of economic activities. For Class 10, it's essential to grasp the sectors of the Indian economy, understand their characteristics, and recognize their importance. This guide will provide detailed notes on the Sectors of the Indian Economy Class 10, using specific long-tail keywords to enhance comprehension.
For more information, visit-www.vavaclasses.com
How to Create Map Views in the Odoo 17 ERPCeline George
The map views are useful for providing a geographical representation of data. They allow users to visualize and analyze the data in a more intuitive manner.
Instructions for Submissions thorugh G- Classroom.pptxJheel Barad
This presentation provides a briefing on how to upload submissions and documents in Google Classroom. It was prepared as part of an orientation for new Sainik School in-service teacher trainees. As a training officer, my goal is to ensure that you are comfortable and proficient with this essential tool for managing assignments and fostering student engagement.
3. Scenario
You are working in the publicity office of a large
bank as a junior publicity and media officer. You
are now required to carry out some research to
identify suitable target locations for the next
roadshow tour which is targeting saving and
investment opportunities for young professionals.
4. Scenario…
These locations should be in areas where there
are likely to be substantial numbers of young
people in professional employment. This research
will produce some reports identifying likely
locations for the roadshow to set up.
Identify a dataset to process into information for
your reports. The data you will need for these
tasks can be found using the school VLE or you
may use any other appropriate sources. Download
your data into a spreadsheet or database.
5. Tasks – there are 4!
Task 1 (P6)
Produce some notes on where the dataset was found and why it was
selected.
Task 2 (P7)
Use a spreadsheet or database for processing the data you find into
useful management information identifying some suitable locations
where the roadshow is likely to find young professional workers.
Task 3 (M3)
You have been asked to produce a front sheet to your reports
explaining how the information you generated is valid, accurate and
useful. This will ideally be a single page, two pages maximum, so
management reading the report s can understand the validity of your
findings.
Task 4 (D2)
Produce a substantial email to your team justifying the information you
selected to support these business decision-making processes.
6. What you will need to produce
Task 1 (P6)
“some notes” – word processed, with hyperlinks and detailed
explanation of how the dataset was downloaded
Task 2 (P7)
“useful management information” – not simply a list in Excel
(though this will be behind the management information! A
written report showing (perhaps graphically along with the text
where the best locations are
Task 3 (M3)
“a front sheet to your reports” – a word processed page entitled
“Validity, Accuracy and Usefulness”
Task 4 (D2)
“a substantial email” – umm, yeah, that.
7. Selecting a data source
• Of course you can ignore this suggestion – but you’d
better have a pretty good plan as it took me an hour to
find the most appropriate source from Census data!
• First task: find out about the UK national census – what is
it, when has it happened, what kinds of data are collected,
how can it be used by organisations?
5 minutes
8. Downloading Census Data
• There are several different government sites that 2011
census data can be downloaded from
• www.ons.gov.uk – Office for National Statistics
• neighbourhood.statistics.gov.uk
• www.nomisweb.co.uk – “Official Labour Market Statistics”
• Census data takes a long time to be entered and process
and released – most of this data has been released in the
last 6 months
9. Downloading Data from NomisWeb
• You will need to produce notes on why the data from
Nomis is the most appropriate source
• For now, follow along as we find the right download!
11. Task 1 (P6)
• Produce some notes on where the dataset
was found and why it was selected.
• This is notes! Not a full on report at this
stage
• This should form part of the final report
12. Analysing the Data
Things to use:
• Filters
• Formulas
• Graphs
Things to think about:
• Is the absolute number of professionals as important as
the percentage of professionals in the area?
• How could we look at concentrations of young people –
our data is 16-49? Other data sets?
• Once you make a decision how will you present it?