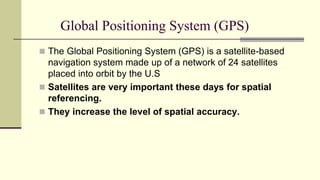
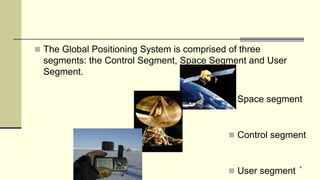
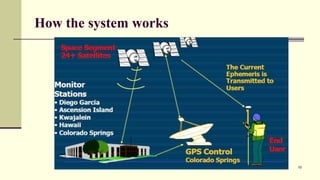
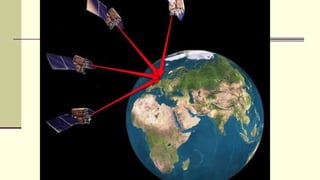
January 2015 1
Global Positioning System (GPS)
 The Global Positioning System (GPS) is a satellite-based
navigation system made up of a network of 24 satellites
placed into orbit by the U.S
 Satellites are very important these days for spatial
referencing.
 They increase the level of spatial accuracy.
 GPS was originally intended for military applications, but
in the 1980s, the government made the system available
for civilian use.
 There are no subscription fees or setup charges to use GPS.
 GPS satellites circle the earth twice a day in a very precise
orbit and transmit signal information to earth
 The Global Positioning System is comprised of three
segments: the Control Segment, Space Segment and User
Segment.
4
 Space segment
 Control segment
 User segment
5
Control Segment
Space Segment
User Segment
Three Segments of the GPS
Ground
Antennas
Master Station Monitor Stations
Space segment
 The orbital position is constantly monitored and updated by the
ground stations.
 Each satellite is identified by number and broadcasts a unique
signal.
6
Control segment
 The Master Control Station (MCS) also known as the
Consolidated Satellite Operations Center) is located at the US Air
Force Space Command Center at Schriever Air Force Base
(formerly Falcon AFB) in Colorado Springs, Colorado.
 It's responsible for satellite control and overall system operations.
The Control segment is made up of a Master Control Station
(MCS), four monitor stations, and three ground antennas (plus a
reserve antenna at Cape Canaveral used primarily for pre-launch
satellite testing) used to uplink data to the satellites.
 Monitor Stations continuously receive GPS satellite
transmissions, and relay this information in real time to the Master
Control Station in Colorado.
7
Kwajalein Atoll
US Space Command
Control Segment
Hawaii
Ascension
Is.
Diego Garcia
Cape Canaveral
Ground Antenna
Master Control Station Monitor Station
User segment
 The user segment is a total user and supplier community,
both civilian and military
 The User Segment consists of all earth-based GPS receivers.
 The user segment comprises of
 any one using a GPS receiver to receive a GPS signal.
 Land navigation,
 Marine navigation,
 Aerial navigation,
 Surveying, etc…
9
How the system works
10
Basic positioning Concept
 If a satellite’s location is known, and a receiver can determine how
far away it is, the receiver must be somewhere on a sphere.
 If a second satellite is used simultaneously, the receiver must be
somewhere where the two spheres intersect (on a circle).
 GPS receivers take information and use triangulation to calculate
the user's exact location
 Essentially, the GPS receiver compares the time a signal was
transmitted by a satellite with the time it was received
 The time difference tells the GPS receiver how far away the satellite
is.
12
GPS Triangulation
 Each satellite knows its position
and its distance from the center
of the earth.
 Each satellite constantly
broadcasts this information.
 With this information and the
calculated distance, the
receiver calculates its position.
 Just knowing the distance to
one satellite doesn’t provide
enough information.
13
GPS Triangulation--cont.
 When the receiver knows its
distance from only one satellite,
its location could be anywhere
on the earths surface that is an
equal distance from the satellite.
 Represented by the circle in the
illustration.
 The receiver must have
additional information.
14
GPS Triangulation--cont.
With signals from two satellites, the
receiver can narrow down its location to
just two points on the earths surface.
Were the two circles intersect.
15
GPS Triangulation cont...
 Knowing its distance from
three satellites, the receiver
can determine its location
because there is only two
possible combinations and
one of them is out in space.
 In this example, the receiver
is located at b.
 The more satellite that are
used, the greater the
potential accuracy of the
position location.
 Now, with distance measurements from a few more satellites,
the receiver can determine the user's position and display it
on the unit's electronic map.
 A GPS receiver must get signals at least from three satellites
to calculate a 2D position (latitude and longitude) and track
movement.
 With four or more satellites in view, the receiver can determine the
user's 3D position (latitude, longitude and altitude).
 Once the user's position has been determined, the GPS unit can
calculate other information, such as speed, bearing, track, trip
distance, distance to destination, sunrise and sunset time and more.
 The satellites are arranged on 6 planes, each of them
containing at least 4 slots where satellites can be arranged
equidistantly
 The inclination angle of the planes towards the equator is 55°,
 Position and coordinates.
 The distance and direction between any two
waypoints, or a position and a waypoint.
 Travel progress reports.
 Accurate time measurement.
Four Primary Functions of GPS
Major Application of GPS
 Environmental resource management
 Aviation
 Military
 Local planning
 Surveying
 Recreation
 Business
23
Advantages of GPS
 GPS has numerous advantages over traditional surveying
methods:
 Inter visibility between points is not required.
 Can be used at any time of the day or night and in any weather.
 Produces results with very high geodetic accuracy.
 More work can be accomplished in less time with fewer people
24
Limitations of GPS
 In order to operate with GPS it is important that the GPS
Antenna has a clear view to at least 4 satellites.
 Sometimes, the satellite signals can be blocked by tall buildings,
trees etc.
 Hence, GPS cannot be used indoors.
 It is also difficult to use GPS in town centers or woodland.
25
Sources of GPS Error
26
Spatial referencing systems
 The earth has a complex surface. A simpler surface is
produced if the
 earth’s topography is removed.
 Geodesy
 What is Geodesy?
It is the science of measuring and portraying the Earth’s
surface
27
An ellipsoid of revolution is the figure
which would be obtained by rotating an
ellipse about its shorter axis. The
GRS80 ellipsoid is used for the NAD83.
a= 6378137.00000 meters
b= 6356752.31414 meters
f= 1/(a-b)/a =
298.2572220972
So we squash the sphere
to fit better at the poles.
This creates a spheroid
a = 6,378,137.00000 m
b
=
6,356,752.31414
m
Close Fit At The Equator
But The Poles Are Out
NAD83 uses the
GRS80 Ellipsoid
GRS80 fits geoid to
about +/- 300’
28
Tadele F
Integration of remote sensing and GIS
 Remote sensing and GIS technologies can be combined to
enhance each other:
1. Remote sensing is used as a tool for gathering data for use in
GIS,
2. GIS data are used as ancillary information to improve the
products derived from remote sensing, and
3. Remote sensing and GIS are used together for modeling and
analysis
29
Planer Coordinate system
• Used for locating positions on a flat map
• Evolved from Cartesian coordinates
• Coordinates tell you how far away from the origin of the axes you are
• Referenced as (X,Y) pairs
• In cartography and surveying, the X axis coordinates are known as Eastings, and the Y
axis coordinates as Northings.
Earth Coordinate System
• It is also termed as Geographical coordinate system
• Uses latitude and longitude to locate positions on the
• Uniformly curved surface of the earth
• Primary system – used for navigation and surveying
30
Geographic coordinates on a spherical (left) and
Cartesian (right) representation. Notice the circles
with a 5 degree radius appear distorted on the
spherical representation, illustrating the change in
surface distance represented by a degree of longitude
from the equator to near the poles.
P
• Coordinate systems can define points in n- dimensional space.
• In cartography and surveying, it uses two-dimensional or three-dimensional space.
• Coordinate Systems Used in Geodesy, Cartography and GIS
• Global Cartesian coordinates (X, Y, Z): a system for the entire Earth. The starting point of
this coordinate system is the center of the Earth.
• This coordinate system is extremely cumbersome and difficult to relate to other
locations when reduced to two dimensions
32
Geographic coordinates
 Geographic coordinates (φ, l, h): Uses an angular unit of measure for
φ and l. The φ-latitude and l-longitude are related to a particular earth
figure, which may be a sphere or an ellipsoid.
 Parameters of geographic system are the prime meridian and datum.
 Geographical coordination is generalized concept of geodetic
(discussed below) and astronomical coordinate (based on astronomic
observations) systems
33
Projected coordinates
 Projected coordinates (x, y, z): An area of the Earth’s surface is
projected into Cartesian or planar coordinates.
 The z-coordinates (heights) in global and projected coordinate
systems are defined geometrically; in a geographical coordinate
system, the z-coordinate is defined gravitationally.
34
 The geographic coordinate system is based on a set of imaginary lines that
intersect one another and encompass the Earth’s surface.
 Determining location and direction using this system is based on two key
lines - the prime meridian and the equator.
 Geographic coordinates are useful in determining location and orientation
and identifying changes in location or relative distance between points on a
spheroidal surface.
 The concept of latitude and longitude (φ, l) and vertical distance the above
the geoid (z) are the basis for any expression of geographic coordinates on
the Earth’s surface.
35
The basic elements of a geographic coordinate system
 The Equator is formed by the intersection of a plain bisection of the Earth at right
angles to the axis of rotation
 Meridians are formed by the intersection of vertical planes passing through the
center of the Earth and the sphere or spheroid (ellipsoid)
 Latitude and longitude are defined using an ellipsoid, an ellipse rotated about an
axis
 Elevation (z) defined using geoid, a surface of constant gravitational potential
 Earth datums define standard baseline values of the ellipsoid and geoid
 Latitude is measured in degrees north or south of the equator (0-900N to 0 -900S)
 Longitude is measured in degrees west or east of the prime meridian( 0-1800 W to
0-1800 E)
 The prime meridian passes through the Royal Observatory at Greenwich, England.
 This base meridian is now internationally recognized
 These lines encompass the globe and form a gridded network called a graticule 36
The parallels and meridians that form a graticule
37
Map Projections
 Whether you treat the earth as a sphere or a spheroid, you must transform its
three-dimensional surface to create a flat map sheet.
 This mathematical transformation is commonly referred to as a map projection.
 It is a systematic representation of the parallels of latitude and the meridians of
longitude of the spherical surface of the earth on a plane surface.
 Map is a mathematical transformation of reality that requires two steps of modeling
and transformation:
 The Earth has to be modeled as an ellipsoid (sphere) or/and geoid
 An ellipsoid (sphere) has to be projected onto a flat surface
38
Two steps of the globe geo-
referenced modeling
• Have discussed the first step of this modeling and transformation in chapter 2.
In this module we discuss the mathematical projection process.
• Two types of coordinate systems are used for the transformation of Earth to
globe, and from globe to map.
• They are geographic and projected coordinate systems. Thus, a map uses a
planar coordinate system to depict entities on a flat surface.
• A map planar coordinate can be calculated from a geographic coordinate of a
globe and backwards.
39
Map projection contin…
• Map or cartographic projections are methods for projecting the spherical
coordinates of latitude and longitude to orthogonal coordinates.
• One may think of this as a metaphorical projection of light through a
transparent globe onto a developable surface such as a flat piece of
paper.
• However, strictly or mathematically speaking, a map projection can be
represented as a system function or equation:
• x = F1(φ, l,)
• y = F2(φ, l,)
• Where x and y are orthogonal map coordinates, and φ and l are angular
geographic coordinates of a sphere or ellipsoid, and F1 and F2 are
projection functions.
40
Map projection contin…
• Cartographic (map) projections try to flatten the curved surface of the globe
without stretching or tearing it. However, since all map projections attempt to
represent the curved surface of the Earth on a flat sheet of paper distortions
are inevitable.
• The degree of distortion differs from point to point on the sphere and from
map to map.
• One easy way to understand how map projections alter spatial properties is
to visualize shining a light through the earth onto a surface, called the
projection surface.
• Imagine the earth's surface is clear with the graticule drawn on it.
• Wrap a piece of paper around the earth.
• A light at the center of the earth will cast the shadows of the graticule onto
the piece of paper.
41
CONTI…
 You can now unwrap the paper and lay it flat. The shape of the
graticule on the flat paper is different from that on the earth.
 The map projection has distorted the graticule.
 A spheroid can't be flattened to a plane any more easily than a
piece of orange peel can be flattened—it will rip.
 Representing the earth's surface in two dimensions causes
distortion in the shape, area, distance, or direction of the data.
 A map projection uses mathematical formulas to maintaining
spatial relationships on the globe to flat, planar coordinates.
42
43
 projection process involves stretching and distortion
 Map projections always introduce some type of distortion
 Selection of a projection is done to minimize distortion for the particular
application
PROJECTIONS
44
SCALE FACTOR
 We have discussed that features on the surface of a sphere or a spheroid
undergo distortions when projected onto a plane.
 It is necessary to have a precise definition of the amount of distortion that
has resulted. This is provided by the definition of the scale factor, which is
given the symbol k in this text.
k = distance on the projection / distance on the sphere
 This parameter will be different at each point on the projection, and in many
cases will have different values in each direction
 The ideal value of scale factor is 1, representing no distortion
 The inevitable distortion on a map differs from point to point on the
spheroid, and from map to map. 45
 Map scale is the amount of reduction that takes place in going from real-
world dimensions (sphere or ellipsoid) to the same area projected onto a
map plane.
 Due to the projection distortions, map projections do not preserve a
constant scale everywhere on a map.
46
WHY MAP PROJECTION
 We cannot see all countries of the globe at a glance as flat map can do at a time
 It is difficult to measure a distance on a globe due to spherical nature of the globe
 It is difficult to construct a large size of a globe & it is equally difficult to carry such
globe from place to place
 It is difficult to trace maps from a globe accurately
 Map can be rolled to make easily carried from place to place
47
Types of projections Based on Developable surface
Azimuthal Cylindrical Conic
Projection aspect
Cylindrical
Conical
Planer/Azimuthal 48
 perspective point/light source
Light rays
Planar/Azimuthal
49
CYLINDRICAL PROJECTIONS
The light source's origin for the map projection is also the origin of the spherical coordinate system,
so simply extending the degree lines until they reach the cylinder creates the map projection. The
poles cannot be displayed on the map projection because the projected 90 degree latitude will never
contact the cylinder.
50
Globe intersects the cone at two circles. Therefore, all points
along both circles have no scale distortion
51
1. CYLINDRICAL MAP PROJECTION
52
 In these projections, the parallels and meridians of a globe are transferred to a
cylinder which is developable surface.
 Taking the cylinder which has equal diameter with the globe and place the
globe inside the cylinder in such away that its equator touches the cylinder
 Therefore cut the cylinder and unroll to get rectangular surface
 The lls are straight lines and equals to the length of the equator
 Thus the lls are longer than the corresponding lls on globe
 Meridians are straight lines and intersect the equator at right angles; equi-
spaced in all latitudes
 These projection is suitable for showing equatorial regions
The known category of Cylindrical Map Projection include:
53
1. lls and meridians are straight lines
2. The meridians intersect the lls at right angles
3. The distance b/n the meridians and those b/n lls remain the same thought the
projection
4. All lls are equals to the equator, have the same length
5. The length of the equator is equal to length of equator on the globe
6. All meridians are ½ of the equator, scale is correct along all meridians
7. The projection is neither equal-area nor orthomorphic
Limitations
Since the lls enlarged toward the poles, areas away from the equator are enlarged
Properties of simple Cylindrical Projection
SPATIAL DATA ANALYSIS AND DATA PRESENTATIONS
54
 GIS allows you to author and
manage the templates in your
map, such as by
 creating,
 deleting,
 copying,
 Importing and exporting,
 renaming templates and setting
template properties.
 It may also address arrangement of
data in many different ways that is
suitable for providing information at
hand.
Data Organization
55
Spatial Analysis
Analysis is the process of inferring meaning from data.
Analysis is carried visually in a GIS
 Analysis in a GIS can also be carried out by
measurements, statistical computations, fitting models to
data values other operation
Spatial Analysis and Modelling by Tadele Feyssa, Wollega
University
56
Spatial analysis concept
Spatial analysis is the process by which we turn
raw data into useful information
Spatial analysis is the crux of GIS because it
includes all of the transformations, manipulations,
and methods that can be applied to geographic
data to add value to them, to support decisions,
and to reveal patterns and anomalies that are not
immediately obvious
Spatial Analysis and Modelling by Tadele Feyssa, Wollega
University
In a narrow sense, spatial analysis has been described as
a method for analyzing spatial data, while in a broad sense
it includes revealing and clarifying processes, structures,
etc., of spatial phenomena that occur on the Earth’s
surface.
Ultimately, it is designed to support spatial decision-
making, and to serve as a tool for assisting with regional
planning and the formulation of government policies,
among other things.
57
Spatial Analysis and Modelling by Tadele Feyssa, Wollega
University
Spatial Analysis
58
Spatial Analysis and Modelling by Tadele Feyssa, Wollega
University
Presentation
 The functional classification follows the logical progression of a
GIS project from data capture, transfer and edit, through store and
structure on to restructure, generalize and transform and query
and analyze and finally present.
Data presentation is the final stage in which the results
of earlier analysis are presented in an appropriate way
The data representation phase deals with putting all
together into a format that communicates the result of
data analysis in the best possible way.
Spatial Analysis and Modelling by Tadele Feyssa, Wollega
University
59
Maps in GIS are based on spatial data.
You can communicate complex information more
effectively using maps than tables or lists, because maps take
advantage of our natural abilities to distinguish and interpret
colors, patterns and spatial relationships.
When you display your data properly on a map you’ll see
spatial distributions, relationships and trends that you couldn’t
see before.
Your maps will help you make decisions and solve problems
Spatial Analysis and Modelling by Tadele Feyssa, Wollega
University
60
Many issues come up when we want to have an optimal
presentation
Creating and presenting a map is not as easy as it may
seem
Spatial Analysis and Modelling by Tadele Feyssa, Wollega
University
61
1. What purpose does the map serve?
2. What user group is aimed at?
3. What is the title of the map going to be?
4. What spatial components are to be displayed in the legend?
5. What is the hierarchy between the components?
6. What is the data scale of these components?
7. How many classes does each component contain?
8. Which graphic symbols can be used?
9. Which graphic attributes have to be included?
10.Add the North arrow
11.Add the Scale bar or map reference grid,
12.Add the data source, text, and graphics.
Spatial Analysis and Modelling by Tadele Feyssa, Wollega University
62
Spatial Analysis and Modelling by Tadele Feyssa, Wollega
University
63
GIS.pptx

GIS.pptx

  • 1.
  • 2.
    Global Positioning System(GPS)  The Global Positioning System (GPS) is a satellite-based navigation system made up of a network of 24 satellites placed into orbit by the U.S  Satellites are very important these days for spatial referencing.  They increase the level of spatial accuracy.
  • 3.
     GPS wasoriginally intended for military applications, but in the 1980s, the government made the system available for civilian use.  There are no subscription fees or setup charges to use GPS.  GPS satellites circle the earth twice a day in a very precise orbit and transmit signal information to earth
  • 4.
     The GlobalPositioning System is comprised of three segments: the Control Segment, Space Segment and User Segment. 4  Space segment  Control segment  User segment
  • 5.
    5 Control Segment Space Segment UserSegment Three Segments of the GPS Ground Antennas Master Station Monitor Stations
  • 6.
    Space segment  Theorbital position is constantly monitored and updated by the ground stations.  Each satellite is identified by number and broadcasts a unique signal. 6
  • 7.
    Control segment  TheMaster Control Station (MCS) also known as the Consolidated Satellite Operations Center) is located at the US Air Force Space Command Center at Schriever Air Force Base (formerly Falcon AFB) in Colorado Springs, Colorado.  It's responsible for satellite control and overall system operations. The Control segment is made up of a Master Control Station (MCS), four monitor stations, and three ground antennas (plus a reserve antenna at Cape Canaveral used primarily for pre-launch satellite testing) used to uplink data to the satellites.  Monitor Stations continuously receive GPS satellite transmissions, and relay this information in real time to the Master Control Station in Colorado. 7
  • 8.
    Kwajalein Atoll US SpaceCommand Control Segment Hawaii Ascension Is. Diego Garcia Cape Canaveral Ground Antenna Master Control Station Monitor Station
  • 9.
    User segment  Theuser segment is a total user and supplier community, both civilian and military  The User Segment consists of all earth-based GPS receivers.  The user segment comprises of  any one using a GPS receiver to receive a GPS signal.  Land navigation,  Marine navigation,  Aerial navigation,  Surveying, etc… 9
  • 10.
  • 11.
    Basic positioning Concept If a satellite’s location is known, and a receiver can determine how far away it is, the receiver must be somewhere on a sphere.  If a second satellite is used simultaneously, the receiver must be somewhere where the two spheres intersect (on a circle).  GPS receivers take information and use triangulation to calculate the user's exact location  Essentially, the GPS receiver compares the time a signal was transmitted by a satellite with the time it was received  The time difference tells the GPS receiver how far away the satellite is.
  • 12.
    12 GPS Triangulation  Eachsatellite knows its position and its distance from the center of the earth.  Each satellite constantly broadcasts this information.  With this information and the calculated distance, the receiver calculates its position.  Just knowing the distance to one satellite doesn’t provide enough information.
  • 13.
    13 GPS Triangulation--cont.  Whenthe receiver knows its distance from only one satellite, its location could be anywhere on the earths surface that is an equal distance from the satellite.  Represented by the circle in the illustration.  The receiver must have additional information.
  • 14.
    14 GPS Triangulation--cont. With signalsfrom two satellites, the receiver can narrow down its location to just two points on the earths surface. Were the two circles intersect.
  • 15.
    15 GPS Triangulation cont... Knowing its distance from three satellites, the receiver can determine its location because there is only two possible combinations and one of them is out in space.  In this example, the receiver is located at b.  The more satellite that are used, the greater the potential accuracy of the position location.
  • 16.
     Now, withdistance measurements from a few more satellites, the receiver can determine the user's position and display it on the unit's electronic map.  A GPS receiver must get signals at least from three satellites to calculate a 2D position (latitude and longitude) and track movement.
  • 17.
     With fouror more satellites in view, the receiver can determine the user's 3D position (latitude, longitude and altitude).  Once the user's position has been determined, the GPS unit can calculate other information, such as speed, bearing, track, trip distance, distance to destination, sunrise and sunset time and more.
  • 19.
     The satellitesare arranged on 6 planes, each of them containing at least 4 slots where satellites can be arranged equidistantly  The inclination angle of the planes towards the equator is 55°,
  • 22.
     Position andcoordinates.  The distance and direction between any two waypoints, or a position and a waypoint.  Travel progress reports.  Accurate time measurement. Four Primary Functions of GPS
  • 23.
    Major Application ofGPS  Environmental resource management  Aviation  Military  Local planning  Surveying  Recreation  Business 23
  • 24.
    Advantages of GPS GPS has numerous advantages over traditional surveying methods:  Inter visibility between points is not required.  Can be used at any time of the day or night and in any weather.  Produces results with very high geodetic accuracy.  More work can be accomplished in less time with fewer people 24
  • 25.
    Limitations of GPS In order to operate with GPS it is important that the GPS Antenna has a clear view to at least 4 satellites.  Sometimes, the satellite signals can be blocked by tall buildings, trees etc.  Hence, GPS cannot be used indoors.  It is also difficult to use GPS in town centers or woodland. 25
  • 26.
  • 27.
    Spatial referencing systems The earth has a complex surface. A simpler surface is produced if the  earth’s topography is removed.  Geodesy  What is Geodesy? It is the science of measuring and portraying the Earth’s surface 27
  • 28.
    An ellipsoid ofrevolution is the figure which would be obtained by rotating an ellipse about its shorter axis. The GRS80 ellipsoid is used for the NAD83. a= 6378137.00000 meters b= 6356752.31414 meters f= 1/(a-b)/a = 298.2572220972 So we squash the sphere to fit better at the poles. This creates a spheroid a = 6,378,137.00000 m b = 6,356,752.31414 m Close Fit At The Equator But The Poles Are Out NAD83 uses the GRS80 Ellipsoid GRS80 fits geoid to about +/- 300’ 28 Tadele F
  • 29.
    Integration of remotesensing and GIS  Remote sensing and GIS technologies can be combined to enhance each other: 1. Remote sensing is used as a tool for gathering data for use in GIS, 2. GIS data are used as ancillary information to improve the products derived from remote sensing, and 3. Remote sensing and GIS are used together for modeling and analysis 29
  • 30.
    Planer Coordinate system •Used for locating positions on a flat map • Evolved from Cartesian coordinates • Coordinates tell you how far away from the origin of the axes you are • Referenced as (X,Y) pairs • In cartography and surveying, the X axis coordinates are known as Eastings, and the Y axis coordinates as Northings. Earth Coordinate System • It is also termed as Geographical coordinate system • Uses latitude and longitude to locate positions on the • Uniformly curved surface of the earth • Primary system – used for navigation and surveying 30 Geographic coordinates on a spherical (left) and Cartesian (right) representation. Notice the circles with a 5 degree radius appear distorted on the spherical representation, illustrating the change in surface distance represented by a degree of longitude from the equator to near the poles.
  • 31.
  • 32.
    • Coordinate systemscan define points in n- dimensional space. • In cartography and surveying, it uses two-dimensional or three-dimensional space. • Coordinate Systems Used in Geodesy, Cartography and GIS • Global Cartesian coordinates (X, Y, Z): a system for the entire Earth. The starting point of this coordinate system is the center of the Earth. • This coordinate system is extremely cumbersome and difficult to relate to other locations when reduced to two dimensions 32
  • 33.
    Geographic coordinates  Geographiccoordinates (φ, l, h): Uses an angular unit of measure for φ and l. The φ-latitude and l-longitude are related to a particular earth figure, which may be a sphere or an ellipsoid.  Parameters of geographic system are the prime meridian and datum.  Geographical coordination is generalized concept of geodetic (discussed below) and astronomical coordinate (based on astronomic observations) systems 33
  • 34.
    Projected coordinates  Projectedcoordinates (x, y, z): An area of the Earth’s surface is projected into Cartesian or planar coordinates.  The z-coordinates (heights) in global and projected coordinate systems are defined geometrically; in a geographical coordinate system, the z-coordinate is defined gravitationally. 34
  • 35.
     The geographiccoordinate system is based on a set of imaginary lines that intersect one another and encompass the Earth’s surface.  Determining location and direction using this system is based on two key lines - the prime meridian and the equator.  Geographic coordinates are useful in determining location and orientation and identifying changes in location or relative distance between points on a spheroidal surface.  The concept of latitude and longitude (φ, l) and vertical distance the above the geoid (z) are the basis for any expression of geographic coordinates on the Earth’s surface. 35
  • 36.
    The basic elementsof a geographic coordinate system  The Equator is formed by the intersection of a plain bisection of the Earth at right angles to the axis of rotation  Meridians are formed by the intersection of vertical planes passing through the center of the Earth and the sphere or spheroid (ellipsoid)  Latitude and longitude are defined using an ellipsoid, an ellipse rotated about an axis  Elevation (z) defined using geoid, a surface of constant gravitational potential  Earth datums define standard baseline values of the ellipsoid and geoid  Latitude is measured in degrees north or south of the equator (0-900N to 0 -900S)  Longitude is measured in degrees west or east of the prime meridian( 0-1800 W to 0-1800 E)  The prime meridian passes through the Royal Observatory at Greenwich, England.  This base meridian is now internationally recognized  These lines encompass the globe and form a gridded network called a graticule 36
  • 37.
    The parallels andmeridians that form a graticule 37
  • 38.
    Map Projections  Whetheryou treat the earth as a sphere or a spheroid, you must transform its three-dimensional surface to create a flat map sheet.  This mathematical transformation is commonly referred to as a map projection.  It is a systematic representation of the parallels of latitude and the meridians of longitude of the spherical surface of the earth on a plane surface.  Map is a mathematical transformation of reality that requires two steps of modeling and transformation:  The Earth has to be modeled as an ellipsoid (sphere) or/and geoid  An ellipsoid (sphere) has to be projected onto a flat surface 38 Two steps of the globe geo- referenced modeling
  • 39.
    • Have discussedthe first step of this modeling and transformation in chapter 2. In this module we discuss the mathematical projection process. • Two types of coordinate systems are used for the transformation of Earth to globe, and from globe to map. • They are geographic and projected coordinate systems. Thus, a map uses a planar coordinate system to depict entities on a flat surface. • A map planar coordinate can be calculated from a geographic coordinate of a globe and backwards. 39
  • 40.
    Map projection contin… •Map or cartographic projections are methods for projecting the spherical coordinates of latitude and longitude to orthogonal coordinates. • One may think of this as a metaphorical projection of light through a transparent globe onto a developable surface such as a flat piece of paper. • However, strictly or mathematically speaking, a map projection can be represented as a system function or equation: • x = F1(φ, l,) • y = F2(φ, l,) • Where x and y are orthogonal map coordinates, and φ and l are angular geographic coordinates of a sphere or ellipsoid, and F1 and F2 are projection functions. 40
  • 41.
    Map projection contin… •Cartographic (map) projections try to flatten the curved surface of the globe without stretching or tearing it. However, since all map projections attempt to represent the curved surface of the Earth on a flat sheet of paper distortions are inevitable. • The degree of distortion differs from point to point on the sphere and from map to map. • One easy way to understand how map projections alter spatial properties is to visualize shining a light through the earth onto a surface, called the projection surface. • Imagine the earth's surface is clear with the graticule drawn on it. • Wrap a piece of paper around the earth. • A light at the center of the earth will cast the shadows of the graticule onto the piece of paper. 41
  • 42.
    CONTI…  You cannow unwrap the paper and lay it flat. The shape of the graticule on the flat paper is different from that on the earth.  The map projection has distorted the graticule.  A spheroid can't be flattened to a plane any more easily than a piece of orange peel can be flattened—it will rip.  Representing the earth's surface in two dimensions causes distortion in the shape, area, distance, or direction of the data.  A map projection uses mathematical formulas to maintaining spatial relationships on the globe to flat, planar coordinates. 42
  • 43.
  • 44.
     projection processinvolves stretching and distortion  Map projections always introduce some type of distortion  Selection of a projection is done to minimize distortion for the particular application PROJECTIONS 44
  • 45.
    SCALE FACTOR  Wehave discussed that features on the surface of a sphere or a spheroid undergo distortions when projected onto a plane.  It is necessary to have a precise definition of the amount of distortion that has resulted. This is provided by the definition of the scale factor, which is given the symbol k in this text. k = distance on the projection / distance on the sphere  This parameter will be different at each point on the projection, and in many cases will have different values in each direction  The ideal value of scale factor is 1, representing no distortion  The inevitable distortion on a map differs from point to point on the spheroid, and from map to map. 45
  • 46.
     Map scaleis the amount of reduction that takes place in going from real- world dimensions (sphere or ellipsoid) to the same area projected onto a map plane.  Due to the projection distortions, map projections do not preserve a constant scale everywhere on a map. 46
  • 47.
    WHY MAP PROJECTION We cannot see all countries of the globe at a glance as flat map can do at a time  It is difficult to measure a distance on a globe due to spherical nature of the globe  It is difficult to construct a large size of a globe & it is equally difficult to carry such globe from place to place  It is difficult to trace maps from a globe accurately  Map can be rolled to make easily carried from place to place 47
  • 48.
    Types of projectionsBased on Developable surface Azimuthal Cylindrical Conic Projection aspect Cylindrical Conical Planer/Azimuthal 48
  • 49.
     perspective point/lightsource Light rays Planar/Azimuthal 49
  • 50.
    CYLINDRICAL PROJECTIONS The lightsource's origin for the map projection is also the origin of the spherical coordinate system, so simply extending the degree lines until they reach the cylinder creates the map projection. The poles cannot be displayed on the map projection because the projected 90 degree latitude will never contact the cylinder. 50
  • 51.
    Globe intersects thecone at two circles. Therefore, all points along both circles have no scale distortion 51
  • 52.
    1. CYLINDRICAL MAPPROJECTION 52  In these projections, the parallels and meridians of a globe are transferred to a cylinder which is developable surface.  Taking the cylinder which has equal diameter with the globe and place the globe inside the cylinder in such away that its equator touches the cylinder  Therefore cut the cylinder and unroll to get rectangular surface  The lls are straight lines and equals to the length of the equator  Thus the lls are longer than the corresponding lls on globe  Meridians are straight lines and intersect the equator at right angles; equi- spaced in all latitudes  These projection is suitable for showing equatorial regions The known category of Cylindrical Map Projection include:
  • 53.
    53 1. lls andmeridians are straight lines 2. The meridians intersect the lls at right angles 3. The distance b/n the meridians and those b/n lls remain the same thought the projection 4. All lls are equals to the equator, have the same length 5. The length of the equator is equal to length of equator on the globe 6. All meridians are ½ of the equator, scale is correct along all meridians 7. The projection is neither equal-area nor orthomorphic Limitations Since the lls enlarged toward the poles, areas away from the equator are enlarged Properties of simple Cylindrical Projection
  • 54.
    SPATIAL DATA ANALYSISAND DATA PRESENTATIONS 54  GIS allows you to author and manage the templates in your map, such as by  creating,  deleting,  copying,  Importing and exporting,  renaming templates and setting template properties.  It may also address arrangement of data in many different ways that is suitable for providing information at hand. Data Organization
  • 55.
    55 Spatial Analysis Analysis isthe process of inferring meaning from data. Analysis is carried visually in a GIS  Analysis in a GIS can also be carried out by measurements, statistical computations, fitting models to data values other operation Spatial Analysis and Modelling by Tadele Feyssa, Wollega University
  • 56.
    56 Spatial analysis concept Spatialanalysis is the process by which we turn raw data into useful information Spatial analysis is the crux of GIS because it includes all of the transformations, manipulations, and methods that can be applied to geographic data to add value to them, to support decisions, and to reveal patterns and anomalies that are not immediately obvious Spatial Analysis and Modelling by Tadele Feyssa, Wollega University
  • 57.
    In a narrowsense, spatial analysis has been described as a method for analyzing spatial data, while in a broad sense it includes revealing and clarifying processes, structures, etc., of spatial phenomena that occur on the Earth’s surface. Ultimately, it is designed to support spatial decision- making, and to serve as a tool for assisting with regional planning and the formulation of government policies, among other things. 57 Spatial Analysis and Modelling by Tadele Feyssa, Wollega University
  • 58.
    Spatial Analysis 58 Spatial Analysisand Modelling by Tadele Feyssa, Wollega University
  • 59.
    Presentation  The functionalclassification follows the logical progression of a GIS project from data capture, transfer and edit, through store and structure on to restructure, generalize and transform and query and analyze and finally present. Data presentation is the final stage in which the results of earlier analysis are presented in an appropriate way The data representation phase deals with putting all together into a format that communicates the result of data analysis in the best possible way. Spatial Analysis and Modelling by Tadele Feyssa, Wollega University 59
  • 60.
    Maps in GISare based on spatial data. You can communicate complex information more effectively using maps than tables or lists, because maps take advantage of our natural abilities to distinguish and interpret colors, patterns and spatial relationships. When you display your data properly on a map you’ll see spatial distributions, relationships and trends that you couldn’t see before. Your maps will help you make decisions and solve problems Spatial Analysis and Modelling by Tadele Feyssa, Wollega University 60
  • 61.
    Many issues comeup when we want to have an optimal presentation Creating and presenting a map is not as easy as it may seem Spatial Analysis and Modelling by Tadele Feyssa, Wollega University 61
  • 62.
    1. What purposedoes the map serve? 2. What user group is aimed at? 3. What is the title of the map going to be? 4. What spatial components are to be displayed in the legend? 5. What is the hierarchy between the components? 6. What is the data scale of these components? 7. How many classes does each component contain? 8. Which graphic symbols can be used? 9. Which graphic attributes have to be included? 10.Add the North arrow 11.Add the Scale bar or map reference grid, 12.Add the data source, text, and graphics. Spatial Analysis and Modelling by Tadele Feyssa, Wollega University 62
  • 63.
    Spatial Analysis andModelling by Tadele Feyssa, Wollega University 63