This survey revealed that the public wants more transportation options and investment in public transportation rather than new roads. Three-quarters of respondents favored improving rail systems over building new highways to accommodate future population growth. Half believed the top priority should be maintaining existing infrastructure, while nearly a third preferred expanding bus and rail options. Most felt their communities did not do a good job providing transportation choices. Improving public transportation was seen as the best long-term solution to reducing traffic by nearly half of respondents.

![Transportation and Real Estate: Making the Connections 3
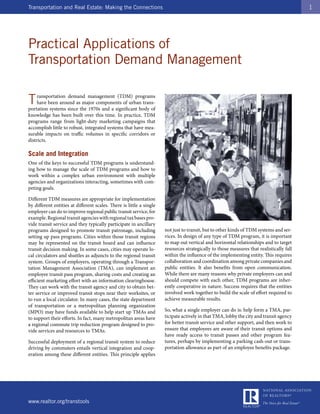
typical weekday, the Silver Line has 14,200 boardings com-
pared to 800 to 13,000 a day on the other bus routes.
The Silver Line is just one part of a massive transit system in
the Boston area that also includes light rail and subways. Joe
Pesaturo, director of communications, notes when planning
was underway, some people thought the Silver Line should
be a light rail or trolley system, but the cost would have been
substantially higher. “And trolleys still compete with traffic,”
he says. “All it takes is one car, one accident and trolleys have
to come to a stop.” A bus can veer around a crash scene and
keep going.
BRT vs. Light Rail
Opponents say Bus Rapid Transit doesn’t measure up to light
rail when it comes to long-term labor costs, fuel use, or eco-
nomic development. “You can’t make a bus into a train and
that’s what’s been promoted,” said Dave Dobbs, publisher of
LightRailNow.org, based in Austin, Texas.
A study by the California Center for Innovative Transporta-
tion showed the Orange Line, a BRT route that travels from
the end of a subway line across the San Fernando Valley, has
reduced traffic congestion on the parallel U.S. Highway 101
by 14 percent. Dobbs says he thinks the Orange Line prob-
ably could have been converted to light rail for a relatively
small cost “and would carry even more people than it does
today.” According to Dobbs, about 50 United States cities ei-
ther have light rail lines or are considering building them;
France is building an electric-powered light rail system in ev-
ery city of 100,000 or more. “Operational costs of light rail,
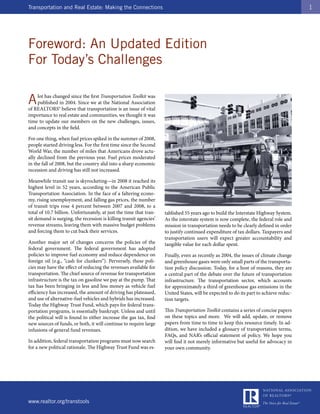
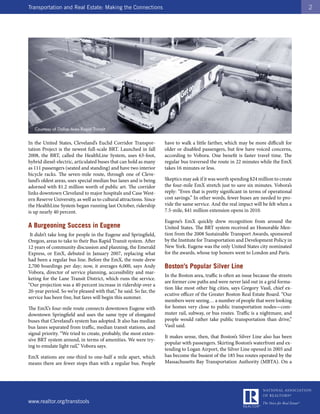
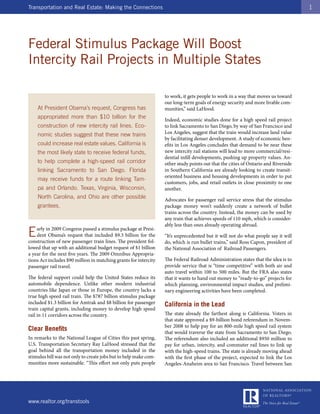
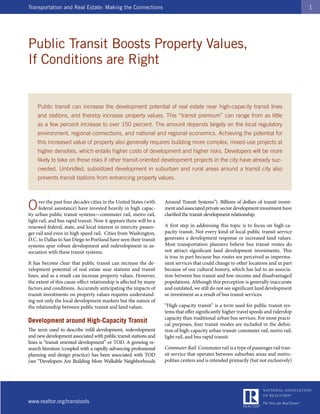
over time, are much lower than a bus,” Dobbs said. He said
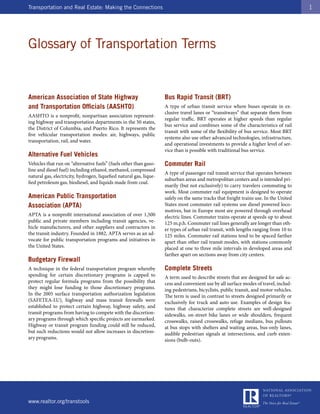
a study by LightRailNow.org shows energy consumption on Boston’s Silver Line
a per-passenger-mile basis is lower with light rail than with
cars or buses. Space constraints can also pose problems for BRT, where
downtown streets in big cities may be narrow, says Aimee
Dobbs also contends that Bus Rapid Transit does little to en- Gauthier, communications director for the Institute for Trans-
courage economic development along its routes because bus portation Development Policy. “What we want is for [com-
routes are less permanent than rail lines and can be changed. munities] to implement a good quality, customer-oriented
“A bus tends to be an afterthought. Buses are followers where- mass transit system. Most cities can’t afford to pay for light
as trains and rails are leaders,” he says. “A bus stop can go rail or heavy rail. But Bus Rapid Transit is not only affordable,
anywhere it wants to go tomorrow.” you can also provide the same level of service and demand
as rail.”
www.realtor.org/transtools](https://image.slidesharecdn.com/wholetoolkit-100407075048-phpapp01/85/National-Association-of-Realtors-Transportation-Tool-Kit-2010-11-320.jpg)
![Transportation and Real Estate: Making the Connections 2
Even the $27.5 billion ostensibly designated for highways was
put largely into a funding category, the Surface Transportation
Program, that can be used for transit, ports, and other trans-
portation modes. About 30 percent of the money was assigned
to metropolitan area planning agencies for allocation as they
see fit. Congress resisted entreaties to require state Depart-
ments of Transportation to fix their worst highways and bridg-
es before building big, new projects. Even so, the requirement
that the funds be spent quickly has meant that most DOTs are
fast-tracking maintenance and rehabilitation, resurfacings, and
bridge painting. These are the types of projects that can move
without a lot of engineering and approval processes.
The bill also designates $8.4 billion for public transit capital
projects. It was a bittersweet moment for transit supporters:
Overjoyed at receiving the capital dollars at a moment when
transit ridership was at a 50-year high, they were disappoint-
ed that there were no funds to preserve existing service in the
face of economic devastation that was requiring major cuts in
operations. Not everyone in Congress loves the idea. Sen. Max Baucus,
the Montana Democrat who chairs the Finance Commit-
tee, which would have a say on creating the legislation, has
The 2010 Budget voiced opposition. “I think that bank idea will rob the fu-
If the stimulus debate sent mixed messages about the nation’s ture growth of the highway program and that will destroy
direction on transportation infrastructure, President Obama’s the national scope of our highway program,” he said dur-
first full-year budget, for fiscal year 2010, seemed to give ing an April hearing on transportation spending held by the
clearer indications of future priorities. The narrative in the Senate Environment and Public Works Committee. Baucus
budget overview emphasized investments that advance envi- indicated that he believes that wealthier states would be bet-
ronmental sustainability, livable communities, and produc- ter suited to compete for the funds, which would have to be
tive growth. It charted new territory by proposing to require paid back.
more rigorous economic analysis and performance measures
for transportation projects. The president’s budget document A New Direction for the U.S. DOT
also linked cleaner transportation options like public transit
to climate and air-quality issues. At the Department of Transportation, Secretary Ray La-
Hood—the former Illinois congressman who was the second
President Obama also called for $25.2 billion to create and Republican in the administration—came into office promis-
operate a national infrastructure bank through 2019. Like the ing to promote “livability” as the watchword of his tenure.
Federal Reserve Bank, the infrastructure bank would operate
under an independent board, evaluating and funding infra- “The era of one-size-fits-all transportation projects must give
structure of national significance, including water and sewer way to ones where preserving and enhancing unique com-
plants, public transit systems, roads and bridges, and afford- munity characteristics, be they rural or urban, is a primary
able housing. The bank essentially would be a revolving loan goal rather than an afterthought,” LaHood said at his Senate
fund, allowing transportation projects to be debt-financed. confirmation hearing.
Most federal projects today are funded on a pay-as-you-go He followed that with a joint announcement with Housing
basis from gas tax receipts. and Urban Development Secretary Shaun Donovan that the
In a February 2009 interview President Obama said, “The two departments would begin to coordinate on transit plan-
idea [is] that we get engineers, and not just elected officials, ning and housing development, and that they would exam-
involved in thinking about and planning how we’re spend- ine federal rules that either promote or thwart the creation
ing these dollars … The needs are massive and we can’t do of walkable neighborhoods. Smart growth principles would
everything. It would be nice if we said here are the 10 most animate this initiative, the two said. They aim to build afford-
important projects and let’s do those first, instead of maybe able housing near public transportation, create shorter neigh-
doing the 10 least important projects, but the ones that have borhood street blocks to promote walking, and expand bus
the most political pull.” routes to reach more areas.
www.realtor.org/transtools](https://image.slidesharecdn.com/wholetoolkit-100407075048-phpapp01/85/National-Association-of-Realtors-Transportation-Tool-Kit-2010-22-320.jpg)


![Transit policy utsc presentation june 24 [compatibility mode]](https://cdn.slidesharecdn.com/ss_thumbnails/transitpolicyutscpresentation-june24compatibilitymode-150908121123-lva1-app6892-thumbnail.jpg?width=640&height=640&fit=bounds)


