Download to read offline
![IJRET: International Journal of Research in Engineering and Technology eISSN: 2319-1163 | pISSN: 2321-7308
_______________________________________________________________________________________
Volume: 05 Issue: 03 | Mar-2016, Available @ http://www.ijret.org 69
TRAFFIC CENSUS AND ANALYSIS (A CASE STUDY)
Faheem Ahmed Malik1
, Mansoor Ahmed Lone2
, Riyaz Ahmed Qasab3
, Misba Gul4
1
Undergraduate B.Tech Student, Department of Civil Engineering, IUST Awantipora, J&K India-192122
malikfaheemahmed@gmail.com
+91-9419777676
2
Undergraduate B.Tech Student, Department of Civil Engineering, IUST Awantipora, J&K India-192122
3
Assistant Professor, Department of Civil Engineering, IUST Awantipora J&K India-192122
4
Assistant Professor, Department of Civil Engineering , IUST Awantipora, J&K India-192122
Abstract
Traffic Census is the baseline of Transportation Engineering. All management as well as engineering operations are done on the
basis of this only. There is a considerable variations in flow, so for the purpose of designing averaging of these counts is done into
single volume count. There are four main methods of Traffic Census namely Manual Method, Automatic Method, Combination of
Manual and Automatic Method and Photographic Methods. All these have their pros and cons. These have different preferences
with respect to Accuracy, ease of Documentation, Versatility and economics. Three main methods of Traffic Analysis IRC, U.K
method and U.S.A practices have been discussed along with IOWA Department of Transport guidelines for measurement of
Congestion. For better management of Traffic, duration of Survey as per IRC has to be increased as urban areas are moving from
Developed to developing. Sanat Nagar/Rawalpora Intersection is the most important that is encountered in 17.8km stretch of
NH1A Bypass which is expected to be the jugular Vein of the Greater Srinagar City. It can be considered as a place where whole
of Kashmir meets. A case study of Traffic Census and Analysis of the said intersection is presented.
Keywords: Traffic Census, Traffic Analysis, Transport
---------------------------------------------------------------------***---------------------------------------------------------------------
1. INTRODUCTION
John F Kennedy said “It was not our wealth that led to good
Transport Infrastructure but our good Transport
Infrastructure led to our wealth” Transportation and its
allied problems are the phenomenon concerning all Road
users in various forms and an effective remedy to these is
necessary for the overall betterment of the society.
Transportation should satisfy Safety, Rapidness, Comfort,
Convenience and economic considerations as well as be
Eco-Friendly.
“Srinagar, the capital of the state has to function as a place
of pride for the people ofstate who look towards the city as a
model city” [8]
. With the proposal of Satellite Town of
Greater Srinagar likely to Comprehend in very near future,
National Highway 1A Bypass Stretching 17.8km’s from
Panthachowk-Shalteng will be the Jugular Vein of the
City.Rawalpora Intersection is the most important
intersection that is encountered in the 17.8Km Stretch of
NH1A Bypass. It is a Four Armed at Grade junction which
is at a Distance of 7,752meters from Athwajan from where
NH1A Bypass starts and 10,048 meters from Shalteng
where NH1A Bypass ends. It can be considered as the
Intersection where whole of Kashmir meets. One side of the
Intersection approaches South Kashmir from Athwajan
where is the Second side Approaches North Kashmir via
Hyderpora-Shalteng, whereas from third side it approaches
to Central Business District LalChowk and Fourth Side
meets the Army Airport i.e. Old Airprt
1.1 Understanding the Problem
In Transportation Engineering thing of primary importance
is the measurement of Flow and then analysis of the same,
be it in the form of Motorists, Cyclists, Passengers,
Pedestrians, etc. A proper estimate is essential for a
particular facility to function properly and give the requisite
results. Overestimate leads to waste of resources.
Underestimate leads to drop in L.O.S, congestion and allied
effects.
1.2 Need
There are four Basic E’s of Transportation Engineering
namely, Engineering, Education, Enforcement and
Emergency Response. Except for the education, Flow
Measurement and Analysis are the pre-requisite for all the
other E’s. Level and type of Education also depends to some
extent Flow Characteristics.
WHY!!‽‽
It is the baseline of Transportation Engineering.
It serves as the Standard document for the further
evaluation.
Creation of Transport network for a new city is based on
this only.
Only based on Traffic Census an Intelligent Solution can
be sought out of a Traffic Problem be it Congestion, lack
of facilities, economy of time, diversion.
All Traffic Management operations are done on the basis
of this only e.g. Restriction on Entry, Loading](https://image.slidesharecdn.com/trafficcensusandanalysisacasestudy-160922073355/85/Traffic-census-and-analysis-a-case-study-1-320.jpg)
![IJRET: International Journal of Research in Engineering and Technology eISSN: 2319-1163 | pISSN: 2321-7308
_______________________________________________________________________________________
Volume: 05 Issue: 03 | Mar-2016, Available @ http://www.ijret.org 69
TRAFFIC CENSUS AND ANALYSIS (A CASE STUDY)
Faheem Ahmed Malik1
, Mansoor Ahmed Lone2
, Riyaz Ahmed Qasab3
, Misba Gul4
1
Undergraduate B.Tech Student, Department of Civil Engineering, IUST Awantipora, J&K India-192122
malikfaheemahmed@gmail.com
+91-9419777676
2
Undergraduate B.Tech Student, Department of Civil Engineering, IUST Awantipora, J&K India-192122
3
Assistant Professor, Department of Civil Engineering, IUST Awantipora J&K India-192122
4
Assistant Professor, Department of Civil Engineering , IUST Awantipora, J&K India-192122
Abstract
Traffic Census is the baseline of Transportation Engineering. All management as well as engineering operations are done on the
basis of this only. There is a considerable variations in flow, so for the purpose of designing averaging of these counts is done into
single volume count. There are four main methods of Traffic Census namely Manual Method, Automatic Method, Combination of
Manual and Automatic Method and Photographic Methods. All these have their pros and cons. These have different preferences
with respect to Accuracy, ease of Documentation, Versatility and economics. Three main methods of Traffic Analysis IRC, U.K
method and U.S.A practices have been discussed along with IOWA Department of Transport guidelines for measurement of
Congestion. For better management of Traffic, duration of Survey as per IRC has to be increased as urban areas are moving from
Developed to developing. Sanat Nagar/Rawalpora Intersection is the most important that is encountered in 17.8km stretch of
NH1A Bypass which is expected to be the jugular Vein of the Greater Srinagar City. It can be considered as a place where whole
of Kashmir meets. A case study of Traffic Census and Analysis of the said intersection is presented.
Keywords: Traffic Census, Traffic Analysis, Transport
---------------------------------------------------------------------***---------------------------------------------------------------------
1. INTRODUCTION
John F Kennedy said “It was not our wealth that led to good
Transport Infrastructure but our good Transport
Infrastructure led to our wealth” Transportation and its
allied problems are the phenomenon concerning all Road
users in various forms and an effective remedy to these is
necessary for the overall betterment of the society.
Transportation should satisfy Safety, Rapidness, Comfort,
Convenience and economic considerations as well as be
Eco-Friendly.
“Srinagar, the capital of the state has to function as a place
of pride for the people ofstate who look towards the city as a
model city” [8]
. With the proposal of Satellite Town of
Greater Srinagar likely to Comprehend in very near future,
National Highway 1A Bypass Stretching 17.8km’s from
Panthachowk-Shalteng will be the Jugular Vein of the
City.Rawalpora Intersection is the most important
intersection that is encountered in the 17.8Km Stretch of
NH1A Bypass. It is a Four Armed at Grade junction which
is at a Distance of 7,752meters from Athwajan from where
NH1A Bypass starts and 10,048 meters from Shalteng
where NH1A Bypass ends. It can be considered as the
Intersection where whole of Kashmir meets. One side of the
Intersection approaches South Kashmir from Athwajan
where is the Second side Approaches North Kashmir via
Hyderpora-Shalteng, whereas from third side it approaches
to Central Business District LalChowk and Fourth Side
meets the Army Airport i.e. Old Airprt
1.1 Understanding the Problem
In Transportation Engineering thing of primary importance
is the measurement of Flow and then analysis of the same,
be it in the form of Motorists, Cyclists, Passengers,
Pedestrians, etc. A proper estimate is essential for a
particular facility to function properly and give the requisite
results. Overestimate leads to waste of resources.
Underestimate leads to drop in L.O.S, congestion and allied
effects.
1.2 Need
There are four Basic E’s of Transportation Engineering
namely, Engineering, Education, Enforcement and
Emergency Response. Except for the education, Flow
Measurement and Analysis are the pre-requisite for all the
other E’s. Level and type of Education also depends to some
extent Flow Characteristics.
WHY!!‽‽
It is the baseline of Transportation Engineering.
It serves as the Standard document for the further
evaluation.
Creation of Transport network for a new city is based on
this only.
Only based on Traffic Census an Intelligent Solution can
be sought out of a Traffic Problem be it Congestion, lack
of facilities, economy of time, diversion.
All Traffic Management operations are done on the basis
of this only e.g. Restriction on Entry, Loading](https://image.slidesharecdn.com/trafficcensusandanalysisacasestudy-160922073355/75/Traffic-census-and-analysis-a-case-study-1-2048.jpg)
![IJRET: International Journal of Research in Engineering and Technology
__________________________________________________________
Volume: 05 Issue: 03 | Mar-2016, Available @
Unloadingand Restriction on Parking, employment of
number of officials for enforcement.
Up gradation of Existing facilities.
Used to determine critical flow time periods, influence
of large vehicles or pedestrians on vehicular traffic flow.
Helps in documentation of traffic volume trend
Length of the sampling period depends type of count &
intended use of data recorded.
1.3 Conflicts at Sanat Nagar/ Rawalpora
Intersection
Any location having merging, diverging or crossing
maneuvers of two vehicles is a potential Conflict Point.
These are highly undesirable as these cause delay in Traffic
and are major reason for all the accidents. The main aim of
intersection Control is resolving these conflicts for ensuring
safe as well as efficient movement of Traffic including
Vehicles as well as Pedestrians.
Fig 1: Drawing of Sanat Nagar/ Rawalpora Intersection.
Fig 2: Conflicts at Sanat Nagar/ Rawalpora Intersection.
IJRET: International Journal of Research in Engineering and Technology eISSN: 2319
_______________________________________________________________________________________
, Available @ http://www.ijret.org
, employment of
etermine critical flow time periods, influence
of large vehicles or pedestrians on vehicular traffic flow.
traffic volume trend.
sampling period depends type of count &
.3 Conflicts at Sanat Nagar/ Rawalpora
Any location having merging, diverging or crossing
maneuvers of two vehicles is a potential Conflict Point.
These are highly undesirable as these cause delay in Traffic
cidents. The main aim of
intersection Control is resolving these conflicts for ensuring
safe as well as efficient movement of Traffic including
Drawing of Sanat Nagar/ Rawalpora Intersection.
Conflicts at Sanat Nagar/ Rawalpora Intersection.
In the Present Scenario Conflicts for through traffic are 4,
whereas for Right turn are 4. For Right turn through
movement are 8. Merging & Diverging Conflicts are 4
whereas Pedestrian Conflicts are. There
of 32 Conflicts.
Identifying Major Conflict Problem
The main wedlock at each Leg is created by through traffic,
Right Turn, Diverging Traffic which merges at the same
point due to which long queues are formed thereby
disrupting the flow in all directions.
3. METHODS OF TRAFFIC CENSUS
3.1 Manual Method [1]
Manual methods use field personal to count and classify
traffic flowing past a fixed
enumerators needed to count the vehicle depends upon the
number of lanes in highway on which count is to be taken,
type and accuracy of information desired. IRC
recommends recording of data in each direction of travel
separately and posting of observers for each direction. It is
desirable to have literate enumerators with qualification
preferably middle or matriculation.
accuracy and maintaining preci
shifts, with adequate time given to each surveyor for rest as
well as food and water.
Method
The data is recorded mostly in five
vertical Strokes are entered for the first 4 vehicles which is
followed by an Oblique stroke for the Fifth so as to
represent a total of 5. Once an observer is familiar with this
system, he tends to follow this is momentarily
evaluation simple, hassle free with minimum of errors.
For examplefor Traffic entering a Fou
is broken usually into three Categories viz a viz Left
Turning, Right turning and Straight ahead
flow conditions are such that the percentage of U
significant than they are also calculated.
are posted on each arm of the Intersection. IRC has
prescribed the field data sheet
3.2 Automatic Methods
Portable counters serve the same purpose as manual counts
but with automatic counting equipment. The period of data
collection using this method is usually longer than while
using manual counts. For 24
have to be used.
3.2.1 Mechanism
Automatic methods consists of an equipment
the purpose of Traffic measurement in
1. Detecting the passage or presence of a vehicle known as
Detector or Sensor.
2. Recording the count.
eISSN: 2319-1163 | pISSN: 2321-7308
_____________________________
70
In the Present Scenario Conflicts for through traffic are 4,
whereas for Right turn are 4. For Right turn through
movement are 8. Merging & Diverging Conflicts are 4
whereas Pedestrian Conflicts are. Therefore there are a total
Identifying Major Conflict Problem
The main wedlock at each Leg is created by through traffic,
Right Turn, Diverging Traffic which merges at the same
point due to which long queues are formed thereby
flow in all directions.
3. METHODS OF TRAFFIC CENSUS
Manual methods use field personal to count and classify
traffic flowing past a fixed point (Section). Number of
enumerators needed to count the vehicle depends upon the
lanes in highway on which count is to be taken,
type and accuracy of information desired. IRC [2]
recommends recording of data in each direction of travel
separately and posting of observers for each direction. It is
desirable to have literate enumerators with qualification
preferably middle or matriculation. For keeping up the
g precision the work is done in
shifts, with adequate time given to each surveyor for rest as
mostly in five Dash System in which
vertical Strokes are entered for the first 4 vehicles which is
y an Oblique stroke for the Fifth so as to
represent a total of 5. Once an observer is familiar with this
e tends to follow this is momentarily. It makes
evaluation simple, hassle free with minimum of errors.
entering a Four legged Intersection,
usually into three Categories viz a viz Left
and Straight ahead Traffic. If the
flow conditions are such that the percentage of U-turns is
significant than they are also calculated.Traffic Enumerators
are posted on each arm of the Intersection. IRC has
sheet [2]
for such flows.
Portable counters serve the same purpose as manual counts
but with automatic counting equipment. The period of data
hod is usually longer than while
24-hr census Automatic Methods
consists of an equipment which serves
measurement in two steps:-
passage or presence of a vehicle known as](https://image.slidesharecdn.com/trafficcensusandanalysisacasestudy-160922073355/85/Traffic-census-and-analysis-a-case-study-2-320.jpg)
![IJRET: International Journal of Research in Engineering and Technology eISSN: 2319-1163 | pISSN: 2321-7308
_______________________________________________________________________________________
Volume: 05 Issue: 03 | Mar-2016, Available @ http://www.ijret.org 71
Sensors operate on following different principles, thus
deriving the types of censors on the basis of operations
only:-
1. Road Tube: - Also known as Pneumatic tube is a flexible
tube in which one end is sealed is clamped to the road
surface at right angles to the pavement, other end is
connected to a diaphragm actuated switch. When an axle
of vehicle crosses the tube, volume of air gets displaced
which instantaneously sends the electric signal. Two
such contacts actuated results in one count of the vehicle.
2. Electric Contact: - The Sensor equipment consists of a
pair of steel strips contained in a rubber strip which is
buried beneath the surface. On being pressed by the
weight of a moving axle the Steel strips come in contact
with each other, thus resulting in flow of electric current.
It has an advantage that it is able to distinguish between
different streams of traffic flow, otherwise there is no
difference between Road tube and electric tube except
for the mechanism.
3. Photo-electric: - On one end of the road is fixed with a
source of light which emits a beam across the road, other
end has a fixed Photo-cell which can distinguish between
Light beam and absence of it. Passage of a traffic cause
the obstruction, thereby causing a detection by photo-
cell. It is also not able to distinguish between different
lanes of flow.
4. Magnetic: -In this case magnetic disturbance caused in a
magnetic field by passage of a vehicle is used as the
basis of sensing. Magnetic field is provided by a coil
buried beneath the surface of road.
After traffic is detected by a Sensor second part of an
automatic Traffic Counting Device is the recording
mechanism. Some of the common types are:-
1. Counting Register: - It is an accumulator counter
indicating directly number of vehicles on a meter just
like the number of electric units or water units consumed
by a consumer is depicted by an electric/water meter
installed by the authorities. Readings have to be taken
before and after counting period. For division of
counting period into desirable intervals like hours,
minutes etc. readings on these intervals has to be taken.
2. Printed Output: - This device prints the accumulated
count at regular intervals on a roll of paper. Counter is
set at zero at the start of a counting period. Time is
directly linked to the local clock. Time of the day and
no. of vehicles are printed side by side. This mechanism
is programmed to give the count after the predefined
interval of time.
3. Electronic System: - it is the modern system using
electronic registering of data on Electronic storage
devices such as Compact Discs, Mass storage devices.
Now a days advanced systems are available which can
be directly connected to computers through a port
provide on the said system.
3.3 Combination of Manual and Mechanical
Methods
Due to certain constraints as in case of Heterogeneous Flow
of traffic like India, Automatic methods are not effective
because they are not. In order to increase the effectiveness
of Census and making it less hassle free a combination of
both the methods may be used. The assembly consists of a
chart which moves at predefined intervals of time. When a
particular switch/ pen is pressed representing a particular
class of vehicle the pen on the channel on the chart identifies
it with the arrival of that class of vehicle.
3.4 Photographic Methods
Photographic techniques were first used for Traffic study
between Baltimore and Washington in 1927[9]
. Greenshield
who is regarded as one of the earliest pioneer in Traffic
engineering was a proponent of Photographic methods. In
1933 he proposed the use of Photography method of
Studying Traffic Behavior [10]
.
Photographic Techniques can touch many important aspects
of Traffic Engineering and also offer many benefits. It has
virtually unlimited Potentialities and is a powerful tool
which can be used for research as well as operational
studies. These have many advantages:-
Highly accurate data
Limited use of manpower.
Permanent record of Traffic Conditions
Various Conditions on which Analysis is to be
performed without having the need of going back to field
Driver Behavior is unaffected by the study.(IOWA
Department of Transport recommends extensively the
mode of survey in which Road users especially
Motorcyclists are not affected by the study ).
Analysis can be easily done in the office by playing the
Recorded Analysis on Monitor.
These also have indirect benefits. It also can be used to
identify violators.
In Modern Countries with advanced Traffic Engineering
System, Big Screens are available in which minute details
can be easily analyzed which also serve as a Standard
Document for Enforcement of Rules and Regulations.
4. METHODS OF TRAFFIC ANALYSIS
4.1 Indian Practice
Methodology/Approach is based on the average of two
week of Traffic Survey one in the Lean and other in
harvesting Season as recommended by IRC{}
. The survey is
to be recorded in the field data sheet in the hourly manner in
the Five Dash system which included Vertical Strokes for
the first four vehicles which was followed by an Oblique
Stroke for the Fifth Vehicle so as to depict a total of five.
Census once complied, evaluated and analyzed serve as the
Standard document for further evaluation.Accordingly Peak
Hour Traffic is determined and then the requisite facility is
evaluated as per this Peak Hour](https://image.slidesharecdn.com/trafficcensusandanalysisacasestudy-160922073355/85/Traffic-census-and-analysis-a-case-study-3-320.jpg)
![IJRET: International Journal of Research in Engineering and Technology eISSN: 2319-1163 | pISSN: 2321-7308
_______________________________________________________________________________________
Volume: 05 Issue: 03 | Mar-2016, Available @ http://www.ijret.org 72
4.1.1 Traffic Volume Study [1]
Traffic volume Study is to be done on all the directions of
Traffic movement 2 times for consecutive 7 days in
Accordance with IRC [1]
. The Traffic plying in India is of
Heterogeneous in nature, therefore the equivalency factors
as recommended by IRC is to be used for obtaining the
desired PCU’s.
Duration of Traffic Census: - The Traffic Census is to be
carried out for 12hours continuously at a stretch though with
adequate time given to each Surveyor in rotation to have
proper rest and food.
Abnormal Condition: - Abnormal Traffic condition if
encountered at any instance during the survey, then Survey
should be immediately called off. Abnormal conditions may
arrive due to Diversion from or to the Control point, due to a
state holiday or any other incident.
Recording of Data: - A field data Sheet as recommended by
IRC {}
should be prepared for recording of data in Hourly
manner.
Compiling of Data: - Data should be compiled immediately
after the Survey and care should be taken to minimize errors
and Omissions.
4.2 U.K.Practice [6]
The practice in United Kingdom is to measure the 7-day
average flow for 16 hours (6am-10pm) in the month of
August. Various Studies as well as past trends have yielded
that in the month of August Average Travel Demand has
been consistently the Highest. For Observations taken
during any other month, Average Adjustment factors are
applied to convert them to their August Equivalent.
4.3 U.S.A Practice [7]
Counts are carried on for 24 hours
Control Points Station:-Repeated Counts are made on a
large number of Control points to obtain Seasonal and daily
Traffic Characteristics and to obtain factors to convert these
counts into daily average figures. Depending upon the
importance of a Control point, there are Major and Minor
Control Points. There are two types of counts recommended
[Ref No.]
Major Control Points:- Count on these Control points is
carried out 12 times in an year i.e. in each month. Each
count consists of 3 weekdays, one Saturday and One
Sunday.
Minor Control Points:-Counts on these Control Points is
carried out four to six times in year, in alternate months,
with each count covering a minimum of 48 hours on a
week days.
4.4 Iowa Department of Transport Practice[3]
.
This provides an easy method of measuring Congestion.
There are several types and descriptions of traffic delay
involving intersections. The type being addressed in this
section is stopped-time delay, also known as stopped delay,
which is the time that vehicles are waiting in line on the
approach to an intersection. This study provides the Per cent
of Vehicles Stopped, which is a useful indicator of
signalized intersection performance.
4.4.1 Procedure
The field survey portion of the study includes the four
highest consecutive fifteen-minute periods. Special care was
taken, that the survey was conducted under normal
conditions involving the weather, nearby traffic generator
schedule, etc. Two observers are to be positioned on each
leg, one to count and record the stopped vehicles at 15-
second intervals and the other to count the number of
approach vehicles in 15-second intervals. The procedure is
based on the assumption that each vehicle is stopped for the
entire fifteen-second interval.
The observers should be strategically positioned so as to be
able to see the entire approach. The observers’ location and
actions should be such that it doesn’t distract the Road User
especially motorists or influence their behavior.
Observers have to count those vehicles with locked wheels
as being stopped as well as vehicles that had been stopped
and are creeping forward in a queue that is not discharging.
4.4.2 Method
One observer will records the count of the number of
stopped vehicles in each fifteen-second interval of time for
each minute of the study time on Intersection Delay Study
Field Sheet. The other observer will count the number of
vehicles that stopped and the number that did not stop and
give them to the first observer for recording in 15-minute
intervals. A timing device with an audible cue at the 15-
second intervals is to be used so that it is not necessary for a
member of the team to read a watch at each interval.
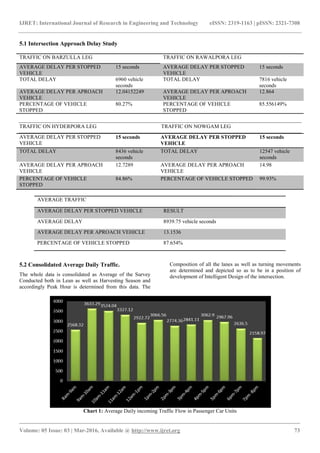
5. RESULTS AT SANAT NAGAR/RAWALPORA
INTERSECTION.
Extensive Traffic survey was done at the Sanat
Nagar/Rawalpora Intersection and analysis of the same was
done which is depicted below:-](https://image.slidesharecdn.com/trafficcensusandanalysisacasestudy-160922073355/85/Traffic-census-and-analysis-a-case-study-4-320.jpg)
![IJRET: International Journal of Research in Engineering and Technology eISSN: 2319-1163 | pISSN: 2321-7308
_______________________________________________________________________________________
Volume: 05 Issue: 03 | Mar-2016, Available @ http://www.ijret.org 74
Chart 2: Intersection Design Data for Hyderpora Leg as
recommended by IRC [2]
Chart 3: Intersection Design Data for Nowgam Leg as
recommended by IRC [2]
Chart 4: Intersection Design Data for Rawalpora Leg as
recommended by IRC [2]
Chart 5: Intersection Design Data for Barzulla Leg as
recommended by IRC [2]](https://image.slidesharecdn.com/trafficcensusandanalysisacasestudy-160922073355/85/Traffic-census-and-analysis-a-case-study-6-320.jpg)
![IJRET: International Journal of Research in Engineering and Technology eISSN: 2319-1163 | pISSN: 2321-7308
_______________________________________________________________________________________
Volume: 05 Issue: 03 | Mar-2016, Available @ http://www.ijret.org 75
Chart 6: Intersection Design Data Peak Hour Design
Vehicle as recommended by IRC [2]
6. THE DISCUSSION
Photographic methods are the most suitable for maintaining
high accuracy as these video tapes are analyzed in the office
calmly with relative ease. This tapes can be analyzed many
times, so if at all there is any kind of error it can easily be
rectified and reconnaissance of earlier work can be done at
any given moment of time. Automatic methods present the
most inaccurate data, as when a vehicle with more than one
axle passes over the selected section of the road, results in
recording of the inaccurate result. This is of significance only
when there are large no. of vehicle having more than two
axles present in the traffic flow. It cannot detect different
lanes of vehicle or their corresponding different maneuvers.
Moreover it is likely to get damaged by crawler tractor, tire
chain, snow ploughs and other similar equipment’s. In case
of photoelectric type of censor obstruction may be caused by
pedestrian or more than one vehicle in different traffic lanes
may be present but positioned in the line of beam
simultaneously, which will result in recording of inaccurate
data. In case of Manual Counts if trained professional are not
employed they present the worst data in terms of accuracy or
if less number of people are employed, but in actual practice
it rarely occurs. In case of Combination of manual and
automatic methods, the flaw of automatic methods is
overcome with the hassle free mechanism of automaticity but
precision is not of the same scale as that of Photographic
methods.
In terms of tabulation of data Automatic methods are the
simplest as the count is either directly given in the form of
output (either soft copy of the hard copy). Automatic are
followed by Combination of Manual and Automatic. Manual
may take a longer time to tabulate if not done in five Dash
System, but still with respect to former it is time consuming.
Photographic methods are cumbersome to tabulate as they
required to be tabulated by counting in the office (Census is
done by recording of traffic volume on video tapes, then
counting the same in the office will be regarded as
tabulation).
Photographic Methods are the most versatile as these can be
used in any type of terrain, flow conditions be it
Heterogeneous or homogenous, irrespective of distance
between the control points, topography. Automatic methods
are the least versatile as these cannot be used for
heterogeneous Flow conditions or its mechanism being
influenced by other factor e.g. Magnetism mechanism
,damaging by crawler tractor, tire chain, snow ploughs and
other similar equipment’s may also occur. Combination of
Manual and Automatic methods may get affected if there is a
large variation in different class of vehicles. Manual Methods
are not viable where control point is near two intersections
very close to each other, distracting the line of sight, however
such condition rarely occurs.Photographic Equipment are the
most expensive in purchasing as well as maintenance,
followed by Automatic Methods, combination of both the
two. Manual methods are the cheapest of all but need
supervision.
U.K practice is based on designing the facility for the highest
flow occurring in an year whereas Indian Practice is to design
a facility for the average Flow occurring in the year which is
done by taking the average of the Highest flow and lowest
flow occurring in the year. By doing so the facility is able to
suffice itself during the majority of the year with due
considerations to economy as India being a Developing
Country with a low Standard of living as compared to U.K.
or U.S.A. The U.S.A practice is to measure the traffic flow
every month for Major points whereas for minor Roads
measure the same in 4-6 times in ayear. By this way seasonal
variation is measured accurately which is then used for
designing of the particular facility. U.S.A and U.K methods
are therefore best approaches for the purpose of design,
improved L.O.S, thus evolvement of design which will
suffice through the maximum incoming flow. U.S.A method
provides a wider data which can be used for all the Traffic
Management operations, like the time of period for
maintenance, time period of diversion to or from, percentage
of different class of vehicles using the particular section at
different time period and requisite measures to be taken. In
case of Sanat Nagar/ Rawalpora Intersection many Accidents
(Fatal as well as Non-Fatal) have taken place during 8.00
p.m. to 8.00 a.m., during which survey was not undertaken.
For a country such as India in which urban areas are moving
from being developing to being developed introspection of
Standards (methods) is now inevitable.](https://image.slidesharecdn.com/trafficcensusandanalysisacasestudy-160922073355/85/Traffic-census-and-analysis-a-case-study-7-320.jpg)
![IJRET: International Journal of Research in Engineering and Technology eISSN: 2319-1163 | pISSN: 2321-7308
_______________________________________________________________________________________
Volume: 05 Issue: 03 | Mar-2016, Available @ http://www.ijret.org 76
7. SUMMARY AND CONCLUSION
Census method is based on type of accuracy, economy, and
method of evaluation of a particular place. .Different
methods of analysis with respect to economic consideration,
L.O.S required, Standard of living of people, local practice as
well as type of Flow. Different methods of traffic Census
described, their order as per Accuracy can be enlisted as:-
1. Photographic Method
2. Combination of Manual and automatic Method
3. Manual Method4. Automatic Method
However, with respect to tabulation, Documentation the
order can be enlisted as:-
1. Automatic Method
2. Combination of Manual and Automatic Method
3. Manual Method
4. Photographic Methods
As per Versatility, the order can be enlisted as:-
1. Photographic Methods
2. Manual Method
3. Combination of Manual and Automatic method
4. Automatic Method
The order with respect to economic considerations can be
enlisted as:-
1. Manual Methods
2. Combination of Manual and Automatic method
3. Automatic Method
4. Photographic Method
The order with respect to Method of Analysis can be enlisted
as:-
1. U.S.A Method
2. U.K Method
3. IRC Method
IOWA Department of transport guidelines provide a
simplified manner in which Congestion can be measured,
thereby depicting the level of analysis to be done as well as
priority of analysis, They give us an idea about the loss
suffered to economy be it in the form of Time lost, increased
Vehicle operating cost, Fuel cost as all these are directly
linked to the level of congestion. It can also be used as a
scale to showcase the necessity of up gradation or benefits by
comparing level of Congestion before and after on IOWA
Department of Transport Scale.
IRC[1]
in which survey is recommended for seven
consecutive days for 12 hours, one weekday and an off day, a
full 24 hours survey should be comprehended which will
give an idea about flow taking place during the whole day
and then requisite Traffic Management operations can be
undertaken based on this. Decisions with respect to
Maintenance operations like feasibility of time (during a year
or even during the 24 hours interval) as well as necessary
measures to be taken. For the type of maintenance operations
to be allowed while the present roadway is functional, it is
imperative full data with respect to flow for full 24 hours is
available. Sometimes class of vehicles using the facility or
the flow is comparatively high that proper diversions routes
are to be sought out. In some cases alternate facility to which
traffic may be diverted may not be able to cater the demand
and thus may lead to congestion.
REFERENCES
[1] IRC-9-1972,Manual on “Traffic Census on Roads”,
National Highway Authority of India(NHAI),Ministry of
Surface Transport, The Indian Road Congress (IRC)
publication09,New Delhi,1972.
[2] IRC-SP41-1994,Manual on “Guidelines for the Design
of At-Grade Intersection in Rural & Urban Areas”,
National Highway Authority of India(NHAI),Ministry of
Surface Transport, The Indian Road Congress
(IRC)Special publication41,New Delhi,1994.
[3] Traffic & safety Manual on "Intersection Delay
Study”,lowa Department of Transportation, Office of
traffic & Safety ,issued on 19-02-07.
[4] Dr.L.R.Kadiyali, “Traffic Engineering and Highway
Transport Planning”, Khanna Publishers, Daryaganj,
New, New Dehli, 8th Edition 3rd Reprint
2014.
[5] Tom V.Mathew, “Transportation Engineering I ”,
Transportation Systems Engineering, Civil Engineering
Department, Indian Institute of Technology Bombay,
Powai, Mumbai 400076, India,Jan-May 2006.
[6] Traffic prediction, Ministry of Transport (U.K), Her
Majesty’s Stationary Office, London, 1968.
[7] Traffic Counting Classification and weighing,
U.S.Bureau of Public Roads, Washington,1957
[8] Master Plan , Srinagar Metropolitan Area 2021,
Government of Jammu and Kashmir, Town Planning
Organization, Kashmir.
[9] Johnson, A.N.,Maryland Aerial Traffic density survey,
Proceedings, Highway Research Board, 7(1).
Washington, 1927.
[10]Greenshields, B.D., The Photographic method of
Studying Traffic Behavior,Proceedings, Highway
Research Board, Vol. 13. Washington, 1933..](https://image.slidesharecdn.com/trafficcensusandanalysisacasestudy-160922073355/85/Traffic-census-and-analysis-a-case-study-8-320.jpg)

The document discusses traffic census and analysis, emphasizing its importance in transportation engineering for effective traffic management. It covers methods of conducting traffic censuses (manual, automatic, photographic, and combination methods) and highlights the analysis approaches used in India, the UK, and the USA. A case study on the Sanat Nagar/Rawalpora intersection, a significant junction in Kashmir, illustrates the need for thorough traffic analysis to address congestion and enhance overall traffic flow.


