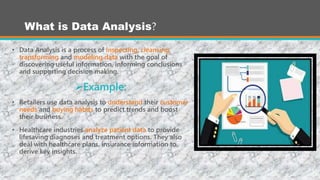
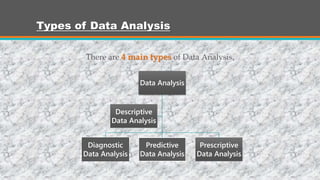
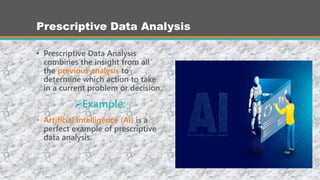
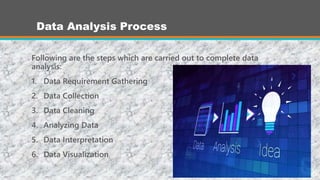
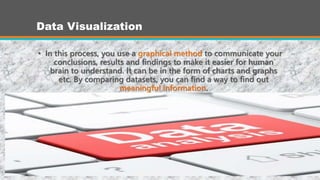
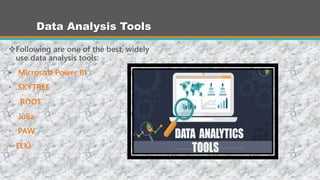
This presentation gives the idea about Data Preprocessing in the field of Data Mining. Images, examples and other things are adopted from "Data Mining Concepts and Techniques by Jiawei Han, Micheline Kamber and Jian Pei "
My class presentation at USC. It gives an introduction about what is data science, machine learning, applications, recommendation system and infrastructure.
Statistics For Data Science | Statistics Using R Programming Language | Hypot...Edureka!
( ** Data Science Certification Using R: https://www.edureka.co/data-science ** )
This Edureka tutorial on "Statistics for Data Science" talks about the basic concepts of Statistics, which is primarily an applied branch of mathematics, that attempts to make sense of observations in the real world. Statistics is generally regarded as one of the most crucial aspects of data science.
Introduction to statistics
Basic Terminology
Categories in Statistics
Descriptive Statistics
Reasons for moving to R
Descriptive Statistics in R Studio
Inferential Statistics
Inferential Statistics using R Studio
Check out our Data Science Tutorial blog series: http://bit.ly/data-science-blogs
Check out our complete Youtube playlist here: http://bit.ly/data-science-playlist
The Basics of Statistics for Data Science By StatisticiansStat Analytica
Want to learn data science, but don't know how to start learn data science from scratch? Here in this presentation you will going to learn the basics of statistics for data science. Start learn these basic statistics to get the good command over data science.
presentation on recent data mining Techniques ,and future directions of research from the recent research papers made in Pre-master ,in Cairo University under supervision of Dr. Rabie
In this presentation, let's have a look at What is Data Science and it's applications. We discussed most common use cases of Data Science.
I presented this at LSPE-IN meetup happened on 10th March 2018 at Walmart Global Technology Services.
Data Analysis Methods 101 - Turning Raw Data Into Actionable InsightsDataSpace Academy
Data analytics is powerful for organisations. It can help companies improve their overall efficiency and effectiveness. The blog offers a step-by-step narration of the data analysis methods that will help you to comprehend the fundamentals of an analytics project.
what is ..how to process types and methods involved in data analysisData analysis ireland
Data analysis is the process of cleaning, transforming, and processing raw data in order to extract useful and actionable information that can assist businesses in making better decisions.
leewayhertz.com-Data analysis workflow using Scikit-learn.pdfKristiLBurns
Data analysis is the process of analyzing, cleaning, transforming, and modeling data to uncover useful information and draw conclusions from it to support decision-making. It involves applying various statistical and analytical techniques to uncover patterns, relationships, and insights from raw data.
Chatty Kathy - UNC Bootcamp Final Project Presentation - Final Version - 5.23...John Andrews
SlideShare Description for "Chatty Kathy - UNC Bootcamp Final Project Presentation"
Title: Chatty Kathy: Enhancing Physical Activity Among Older Adults
Description:
Discover how Chatty Kathy, an innovative project developed at the UNC Bootcamp, aims to tackle the challenge of low physical activity among older adults. Our AI-driven solution uses peer interaction to boost and sustain exercise levels, significantly improving health outcomes. This presentation covers our problem statement, the rationale behind Chatty Kathy, synthetic data and persona creation, model performance metrics, a visual demonstration of the project, and potential future developments. Join us for an insightful Q&A session to explore the potential of this groundbreaking project.
Project Team: Jay Requarth, Jana Avery, John Andrews, Dr. Dick Davis II, Nee Buntoum, Nam Yeongjin & Mat Nicholas
Levelwise PageRank with Loop-Based Dead End Handling Strategy : SHORT REPORT ...Subhajit Sahu
Abstract — Levelwise PageRank is an alternative method of PageRank computation which decomposes the input graph into a directed acyclic block-graph of strongly connected components, and processes them in topological order, one level at a time. This enables calculation for ranks in a distributed fashion without per-iteration communication, unlike the standard method where all vertices are processed in each iteration. It however comes with a precondition of the absence of dead ends in the input graph. Here, the native non-distributed performance of Levelwise PageRank was compared against Monolithic PageRank on a CPU as well as a GPU. To ensure a fair comparison, Monolithic PageRank was also performed on a graph where vertices were split by components. Results indicate that Levelwise PageRank is about as fast as Monolithic PageRank on the CPU, but quite a bit slower on the GPU. Slowdown on the GPU is likely caused by a large submission of small workloads, and expected to be non-issue when the computation is performed on massive graphs.
StarCompliance is a leading firm specializing in the recovery of stolen cryptocurrency. Our comprehensive services are designed to assist individuals and organizations in navigating the complex process of fraud reporting, investigation, and fund recovery. We combine cutting-edge technology with expert legal support to provide a robust solution for victims of crypto theft.
Our Services Include:
Reporting to Tracking Authorities:
We immediately notify all relevant centralized exchanges (CEX), decentralized exchanges (DEX), and wallet providers about the stolen cryptocurrency. This ensures that the stolen assets are flagged as scam transactions, making it impossible for the thief to use them.
Assistance with Filing Police Reports:
We guide you through the process of filing a valid police report. Our support team provides detailed instructions on which police department to contact and helps you complete the necessary paperwork within the critical 72-hour window.
Launching the Refund Process:
Our team of experienced lawyers can initiate lawsuits on your behalf and represent you in various jurisdictions around the world. They work diligently to recover your stolen funds and ensure that justice is served.
At StarCompliance, we understand the urgency and stress involved in dealing with cryptocurrency theft. Our dedicated team works quickly and efficiently to provide you with the support and expertise needed to recover your assets. Trust us to be your partner in navigating the complexities of the crypto world and safeguarding your investments.
2. DATA ANALYSIS
Prepared and Presented By:
AMMAR ABBAS SHAH (2020-ME-73)
HARIS RIAZ (2020-ME-61)
AHSAN HASEEB (2020-ME-75)
AWAIS AHMED (2020-ME-58)
3. DATA ANALYSIS
• What is Data Analysis?
• What are the types of Data Analysis?
• How Data Analysis process is carried out?
• Data Analysis Tools
4. What is Data Analysis?
• Data Analysis is a process of inspecting, cleansing,
transforming and modeling data with the goal of
discovering useful information, informing conclusions
and supporting decision making.
Example:
• Retailers use data analysis to understand their customer
needs and buying habits to predict trends and boost
their business.
• Healthcare industries analyze patient data to provide
lifesaving diagnoses and treatment options. They also
deal with healthcare plans, insurance information to
derive key insights.
6. Types of Data Analysis
There are 4 main types of Data Analysis.
Data Analysis
Diagnostic
Data Analysis
Predictive
Data Analysis
Prescriptive
Data Analysis
Descriptive
Data Analysis
7. Descriptive Data Analysis
Descriptive data analysis looks at past data and tells what happened. This is often used when tracking Key
Performance Indicators(KPIs), revenue, sales leads and more.
Example:
1) CGPA of a student.
2) Batting Average of a Batsman.
3) Previous sales record of a specific product.
8. Diagnostic Data Analysis
Diagnostic Analysis shows ”WHY did it happen?” by finding
the cause from the insight found in Descriptive Analysis.
This analysis is useful to identify behavior patterns of data.
If a new problem arrives in your business process, you can
look into this Analysis to find similar patterns of that
problem. And it may have chances to use similar
prescriptions for the new problems.
Examples:
A freight company investigating the cause of slow
shipments in a certain region.
A company drilling down to determine which
marketing activities increased trials.
9. Predictive Data Analysis
Predictive Analysis shows “What is likely to happen?” by
using previous data. This analysis makes predictions
about future outcomes based on current or past data.
Forecasting is just an estimate. Its accuracy is based on
how much detailed information you have and how much
you dig in it.
Example:
Risk Assessment
Sales Forecasting
Customer Success Teams
10. Prescriptive Data Analysis
• Prescriptive Data Analysis
combines the insight from all
the previous analysis to
determine which action to take
in a current problem or decision.
Example:
• Artificial Intelligence (AI) is a
perfect example of prescriptive
data analysis.
12. Data Analysis Process
Following are the steps which are carried out to complete data
analysis:
1. Data Requirement Gathering
2. Data Collection
3. Data Cleaning
4. Analyzing Data
5. Data Interpretation
6. Data Visualization
13. Data Requirement Gathering
• In this process, you decide these things:
Aim of analysis
Type of data analysis you want
What to analyze?
How to measure?
14. Data Collection
• In this process, you collect your data based on your requirements.
As you collected data from various sources, you must have to
keep a log with a collection date and source of the data. Data may
be collected from sensors in the environment, including traffic
cameras, satellites, recording devices, etc. It may also be obtained
through interviews, downloads from online sources, or reading
documentation.
15. Data Cleaning
• In this process, you clean your data by
removing not be useful or irrelevant
data to your aim of analysis. The data
which is collected may contain
duplicate records, white spaces or
errors. So it must be cleaned and
made error-free before analyzing
data.
16. Analyzing Data
• In this process, you
manipulate your data.
During this phase, you
can use data analysis tools
and software which will
help you to understand,
interpret, and derive
conclusions based on the
requirements.
17. Data Interpretation
• In this section, you interpret your
results. You can choose the way to
express or communicate your data
analysis either you can use simply in
words or maybe a table or chart. Then
use the results of your data analysis
process to decide your best course of
action.
18. Data Visualization
• In this process, you use a graphical method to communicate your
conclusions, results and findings to make it easier for human
brain to understand. It can be in the form of charts and graphs
etc. By comparing datasets, you can find a way to find out
meaningful information.